
Abstract
Engine performance and mapping were done using diesel and used cooking oil biodiesel fuels. This was done using the Tempest, 1500 cc compression ignition engine testbed. This engine is connected to a dynamometer testbed and its control panel to measure the needed performance parameters. The crankshaft speed varied between 35 and 60 rps, while the load tested from no load to full load. The engine speed according to the manufacturer should not exceed 60 rps. The coolant temperature remained almost constant at around 70oC. The experimental results were then utilized to adjust the engine simulation model using the Diesel-RK software. Results showed that improvement in engine operation with diesel is slightly compared with that of biodiesel fuel. It was also found that the combustion process with biodiesel starts earlier during the mixing phase than diesel fuel. The primary results showed that using potassium hydroxide as a catalyst, the biodiesel yielded 45% more compared with sodium hydroxide, 5% higher calorific value, and 10% lower viscosity. From mapping point of view, the results showed that biofuel has a lower thermal efficiency than the regular diesel. A diesel-powered engine has the lowest fuel consumption of around 250–300 g/kWh at the relatively higher power and mean effective pressure values. While for the biodiesel fuels this is around 350 g/kWh at relatively lower engine speeds, power, and mean effective cylinder pressure. From heat release rate point of view, biodiesel burns earlier than diesel fuel due to higher cetane number and reduced delay periods, on cylinder pressure and temperatures, for the ignition timing and engine-operating parameters, diesel shows better performance than biodiesel for high and half loads.
Introduction
Several factors, such as the huge rise in energy price, the massive influx of refugees from unstable neighboring countries, and the unbearable cost of petroleum-based fuels, made it mandatory for Jordan to go for alternative sources of energy. Jordan’s power sector relies heavily on diesel and gas turbine power plants. This means heavy diesel fuel consumption. Products of combustion of such fuels contain chemicals, such as polycyclic aromatic hydrocarbons (PAH) that are dangerous and harmful to human health, on the surface of the emitted particles and—to a lesser amount—in the gaseous phase depending on engine type and load. 1
Efforts to reduce these emissions and their harmful contents are categorized into three central schemes as follows: design a new engine (e.g. electrical, hybrid, solar, etc.) or modify an existing one, pre-combustion treatment of fuel and inlet manifold (e.g. alternative fuel, fuel additive, inlet manifold dynamic waves, etc.) as well as the fuel injection system (e.g. common rail, multipoint injection, etc.), and post-combustion treatment of the exhaust products (e.g. catalytic converter, air injection, exhaust additives, etc.). It is known that engine design parameters (e.g. injection timing, valve timing, air/fuel ratio, compression ratio, etc) are dependent on the fuel used.
Biodiesel is mainly non-aromatic 2 and free from sulfur. Conventional diesel in Jordan contains 1.2% sulfur and 20–40 wt% aromatic compounds. Hence, diesel engines are dominant in sulfur dioxide and black smoke particulate emissions. In Jordan, the primary supply of petroleum products comes from neighboring countries such as Saudi Arabia, Kuwait, and Iraq.
With the increase in oil price, there is an urgent need for alternative or cofuel to replace entirely or partially petroleum-based fuel. Upon considering the University of Jordan (UoJ) on a small scale, the oil used in the restaurants is being thrown away in the sewer system, thus wasting a potential source for green energy. This source of energy can be utilized to fuel various combustion systems including internal combustion engines (ICEs).
The primary objectives of this research are as follows: to compare the change in biodiesel properties using potassium hydroxide (KOH) and sodium hydroxide (NaOH) as catalysts and to draw the engine performance map for the engine using both petrodiesel and biodiesel fuels and compare them.
Upon reviewing the literature, one finds a considerable amount of work related to engine performance using biodiesel fuel as mono or dual fuel. Sahoo and Das 3 found that biofuel made from neat Polanga seeds resulted in maximum peak cylinder pressure. The ignition delays were consistently shorter for neat Jatropha biodiesel, varying between 5.9° and 4.2°. This difference was reported to increase with the load.
Similarly, ignition delays were shorter for neat Karanja and Polanga biodiesel when compared with diesel. Yamin et al. 4 reported a 13.43% loss in biodiesel fuel’s calorific value compared with diesel fuel, with 4.75% higher density. As for the performance, they found that biodiesel was reported to perform better in regard to torque, power and thermal efficiency, and specific fuel consumption (SFC). This behavior was obtained at both full and low loads.
Utlu and Koçak 5 showed that there is no change in the engine torque, power, and SFC between waste frying oil biodiesel (WFOBD) and No. 2 diesel. However, the carbon monoxide (CO), carbon dioxide, nitrogen oxides (NOx), and smoke were reportedly reduced.
Lapuerta et al. 6 reviewed and analyzed the literature related to the use of biodiesel fuel in ICEs. They found that the majority of research results agreed on that the amount of increase in SFC is proportional to the decrease in heating value of biodiesel. On the contrary, thermal efficiency did not increase significantly.
Regarding the effect on emissions, they reported that there is a sharp decrease in both smoke and particulate matter (PM) levels as the concentration of biodiesel in the fuel blend was increased.
Devan and Mahalakshmi 7 reported a slight increase in hydrocarbon (HC) and CO emissions and a reduction in brake thermal efficiency and NOx emission when using Poon oil. They also showed that the combustion of Poon oil–diesel blends was better than the neat biofuel.
Giakoumis and Alafouzos 8 used the engine mapping technique to make an initial assessment on the engine performance and emissions during a speed/torque versus time transient cycle. They concluded that urban driving was responsible for most of the engine-out emissions. They reasoned that it is due to the most frequent and abrupt load changes involved.
Fu et al. 9 also used the engine mapping technique to study the energy and exergy as well as the potential for waste heat recovery for a spark ignition engine using gasoline as fuel. They concluded that at low engine speeds, the prime focus should be toward the engine coolant, while at higher engine speeds, attention should be directed toward exhaust gasses.
The major problem with most of the research available in the literature is that none has tried to explore the best engine performance parameters or draw the engine performance map using this new fuel. This research article is the first to try to do this experimentally by drawing the engine performance map for the engine using biofuel. An engine fuel consumption map was drawn for both fuels. Brake mean effective pressure (BMEP) was used in the map to eliminate the effect of engine size. BMEP is the average (hypothetical) pressure that is thought to be acting on the piston throughout the cycle to produce the same amount of work found by integrating the variation in pressure and volume along the cycle. Since there is no universally accepted and adapted definition for thermal efficiency, researchers use brake-specific fuel consumption (BSFC) rather than thermal efficiency.
Engines operate under variable speeds and load ranges. The fuel consumed by a moving vehicle during a trip is calculated by the BSFC, the BMEP, and engine speed. A standard way of presenting these three data is a contour plot showing lines of constant fuel consumption on a load and speed plane. This graph is called the engine or performance map. It contains the necessary information to estimate the fuel consumption by an engine given the load and speed.
Therefore, to utilize the properties of the fuel to its best, one has to find the performance map of the engine based on the new fuel properties. This will enable the designer to utilize the properties of the fuel to its fullest. This map was found for the waste oil biodiesel, which was made from UoJ restaurants, and the engine performance parameters were studied compared with original petrodiesel. Biodiesel has advantages over ordinary diesel regarding its sulfur content, aromatic contents, and flash point.
Experimental setup
The work plan for this research was divided into the following three main parts: production of WFOBD using both KOH and NaOH catalysts and testing their properties and decide which one is suitable for compression ignition (CI) engines. Testing the relative change in engine performance and mapping using both fuels. Using the obtained data for simulation and to further draw engine mapping. The first part is well documented in other published articles of the authors.4,10,11 Hence, there was no need to repeat the procedure in this article.
Engine setup
This study was conducted using the Tempest, 1500 cc, four-stroke, four-cylinder, direct injection, water-cooled CI engine dynamometer testbed. Two orifice plates with manometers were used to measure the coolant and air mass flow rate. The testbed is shown in Figure 1.

The experimental setup.
Engine performance was shown by plotting engine torque (as the dependent variable) and engine speed (as an independent one). This performance curve is called an engine map curve. Then, the contours of constant BSFC are superimposed on the map. This map was drawn for all engine speeds and loads to cover the entire operational range of the engine.
The areas in the map that show low BSFC indicate that these are the regions within the engine operation where the engine can produce power, torque, or work at less fuel consumption rate. 12 After all measurement systems were corrected from drift and set to zero, the experiment began with ordinary locally used diesel fuel in Jordan to set the baseline performance; then, biofuel was introduced.
The engine conditions were kept as close as those used in the diesel fuel test to eliminate any variability in the results due to different conditions. The test data were measured twice with increasing and decreasing loads and speeds (to the best capability of the engine), and the average reading was taken. The engine was given a good time to reach the steady state (which was in some cases difficult to achieve by 100%).
This was done by checking the coolant temperature at engine outlet, exhaust temperature, and engine speed. Some problems were encountered with the engine speed measurement, which was little fluctuating. Furthermore, due to the non-steady water supply, the water outlet temperature was allowed to vary by ±4°C, which was the best control we could achieve.
Engine speeds were varied between 30 and 60 rps. Engine speeds outside this range could not be reached due to excessive vibrations of the engine and dynamometer. Three loads were chosen, that is full, half load, and no load. At each throttle position and fixed speed, the load was varied from lowest to full load and each time the air, fuel, and cooling water mass flow rates were noted, the engine torque and temperatures at different locations were also measured.
Performance maps as functions of the engine speed, BSFC, BMEP, and brake power at different loads have been produced using data obtained from the experimental setup. These data were then fed to engine simulation software (Diesel-RK) already validated for this engine, and the effect of other parameters, for example, injection timing and atmospheric conditions, was varied. The final diagram was drawn with the help of specialized software.
Specification of the engine is shown in Table 1. The data obtained were then used to verify/modify the model used in Diesel-RK software with the primary aim of drawing the engine map.
Engine specifications.

IVO: inlet valve opening; IVC: inlet valve closing; EVO: exhaust valve opening; EVC: exhaust valve closing; TDC: top dead center; BDC: bottom dead center; a: after; b: before.
Model verification
Figure 2 represents a comparison between the experimental and model results for both fuels. Figure 2 shows that the model can be used for this study with a reasonable degree of accuracy.

Model verification at full load.
Results and discussion
In this chapter, the various test results for the fuels and engine are presented and discussed.
Results of biodiesel production methods
In this section, the results will be presented and discussed in two main parts. The first part will discuss the process of making biofuel. The second part will be directed to engine mapping.
Achieving low viscosity biodiesel yield was the prime aim of changing the catalyst. Moderate values of fuel viscosity make it more suitable for its function as fuel in CI engine.
Researchers have tested numerous options and processes to produce a biofuel that is suitable for ICEs. Among the variables tested were raw material, lye, and catalysts used in the making of biofuel. In this study, the use of alkalis only was tested mainly because the transesterification of vegetable oils occurs faster with alkali-catalyzed reactions than with acid-catalyzed one.
The procedure followed in this research was in accordance to the methods found in the literature. 13 With reference to Table 2, the viscosity of the biodiesel produced by KOH catalyst is 4.7 cP, and so it is lower than the viscosity of biodiesel by NaOH as a catalyst.
Biodiesel properties.

KOH: potassium hydroxide; NaOH: sodium hydroxide.
Viscosity is a prime property of any fuel as it indicates the flowability of a material. It, therefore, influences the injection system’s operation, especially at low temperatures.
It also influences the spray pattern, volume flow, and fuel distribution inside the engine cylinder. This had an undesired effect on the process of combustion and the engine emissions. The maximum allowable limit according to ASTM D445 ranges is 1.9–6.0 and 3.5–5.0 mm2/s in EN ISO 3104. 14 Further noticed in Table 2 is the slightly higher acid value for KOH-based biodiesel compared with NaOH one.
Acid number is a measure of free fatty acids (FFA) contained in a fresh fuel sample. A higher amount of FFA leads to higher acid value. The acid value is expressed as milligram KOH required for neutralizing 1 g of fatty acid methyl esters (FAME). Higher rates of corrosion can be inflicted on the fuel injection system components if fuel with higher acid content is used.
The acid value is determined using the ASTM D664 and EN 14104. Both standards approved a maximum acid value for biodiesel of 0.50 mg KOH/g. 15 Percentage yield is another property noticed from Table 2. It is the percentage of feedstock that (actually) gets converted to useful materials, that is biodiesel materials. It is clear from the table that with KOH, the percentage yield is much higher than NaOH.
The literature is full of research work explaining the reason for this trend. The reaction of methanol with sodium methoxide and vegetable oil is very quick. Complete transesterification of triglyceride at room temperature may take place within 2–5 min. Using the same triglyceride samples with equivalent molar concentrations, potassium methoxide is quicker in completing the esterification process compared with sodium methoxide. Because of the risks in handling metallic potassium, it is preferable to use sodium methoxide in methanol. 16
Heating value can be defined as the amount of heating energy released by the combustion of a unit quantity of fuels. The presence of moisture in the raw material has a greater influence on the heating value of the fuel. A minimum of 35 MJ/kg for biodiesel is prescribed in EN 14213 (biodiesel for the heating purpose).
As noticed in Table 2, the biodiesel produced with the NaOH catalyst has around 4.5% less energy content compared with KOH-based biodiesel. This reduction in the energy content of the fuel may increase the gap of energy loss that already exists between the biodiesel fuel and ordinary diesel. 15
Fuel properties
The relative properties of both fuels as measured in laboratory are listed in Table 3. The first thing to notice is the lower value of biofuel’s calorific value compared with ordinary diesel fuel. Biofuel has approximately 11.75% less energy content compared with ordinary petrodiesel.
Fuel specifications.

The presence of oxygen in biodiesel structure, which does not count in the calorific value of the fuel can be thought of to be the prime cause for this reduction in the biofuel calorific value. This means that when used as monofuel or dual fuel, the amount of energy admitted to the engine will be reduced. Hence, the engine should consume more fuel to obtain the same performance of that of pure diesel-powered engine.
Hence, in addition to the loss of power (or torque or work or mean effective pressure (MEP)) the engine’s SFC is expected to rise (and its efficiency to drop) compared with ordinary diesel fuel. Further noticed is the lower viscosity of biodiesel compared with the diesel fuel. There is approximately 9.6% reduction in the fuel’s viscosity compared with diesel. This means that it can be easily injected, atomized, and mixed with the air. However, this will affect the lubricity of the fuel and may harm the fuel system components.
Hence, lubricant additive is recommended to be added to the fuel to improve its lubrication effect. An attractive property of biodiesel is the absence of sulfur content compared with the Jordanian diesel fuel. Hence, it would be expected that sulfur dioxide concentrations of the exhaust should be less than that for pure diesel fuel.
Engine Performance Resoles
This section discusses the engine performance using the above mentioned fuels.
Brake power and torque
Brake power and torque represent the actual energy, force, or work available at the crankshaft. As noticed in Figures 3 and 4, the engine power and torque decrease as the load decreases. This trend is evident in the case of biodiesel fuel more than diesel. Further noticed is that within the speed and load range studied, the engine performance with diesel fuel is better than that for the biodiesel fuel.

Variation in brake power.
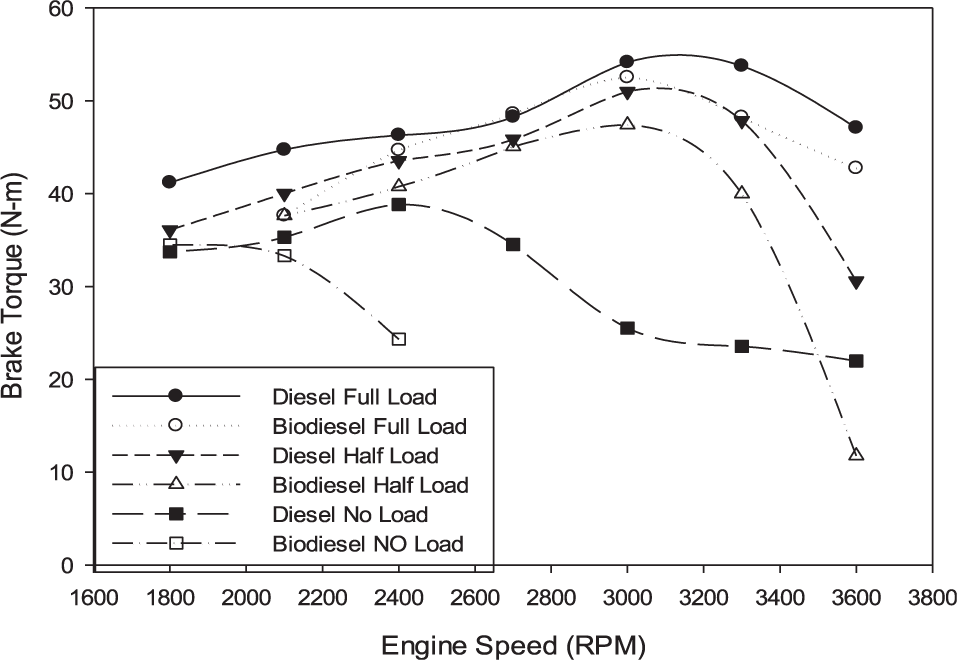
Variation in brake torque.
This is in agreement with several researchers who reported power losses in the same range as the reduction in heating value. Yucesu et al. 17 reported a 3%–8% loss in the engine torque and power using cottonseed biofuel, which has 5% less energy content. Murillo et al. 18 also reported a 7.14% loss in the engine power using waste cooking oil biodiesel, which is in the same range as the difference in heating value. Von Wedel 19 also reported a loss of about 17% in engine power when using waste oil biodiesel.
Biofuel viscosity, as shown in the majority of the literature, was used to explain the torque and power trend, especially at full load concerning that obtained with diesel fuel. The higher bulk modulus and sound velocity of biodiesel, together with its higher viscosity, lead to an advanced start of injection. However, greater than specified values of viscosity cause performance and spray problems to the engine fuel supply system. This, ultimately, has a negative effect on the combustion and emission characteristics of the engine. This behavior made the viscosity of prime concern when searching for alternatives to conventional fuel. This, jointly with any cetane number increase, may slightly advance the start of combustion. Higher engine powers may be achieved by higher lubricity value fuels as it causes the frictional losses to reduce.
Furthermore, torque (τ) can be written for a single cylinder, four-stroke engines as follows 20

where
Equation (1) suggests that fuel conversion and volumetric efficiencies, the swept volume, calorific value of the fuel, air density at inlet conditions, and fuel–air ratio influence the torque developed by the engine. 21
Engine power (P) can be written for a single cylinder, four-stroke engines as follows 20

where N is the engine speed (rps).
On the contrary, based on equation (2) engine power is mainly affected by the fuel conversion and volumetric efficiencies, the swept volume, fuel calorific value, air density at inlet conditions, engine speed, and fuel–air ratio. Equations (1) and (2) reiterate the fact that fuel’s calorific value and fuel conversion and volumetric efficiency affect both engine power and torque.
Referring to Figure 5, it can be noticed that for all the loads and speed range studied, the thermal efficiency for diesel fuel engine is slightly higher than that for biodiesel engine. Similar results were shown by Von Wedel. 19 A combination of several factors resulted in this reduction of thermal efficiency, that is, lower brake power, lower heating value, and a higher fuel flow rate. All of which resulted in the loss of thermal efficiency.
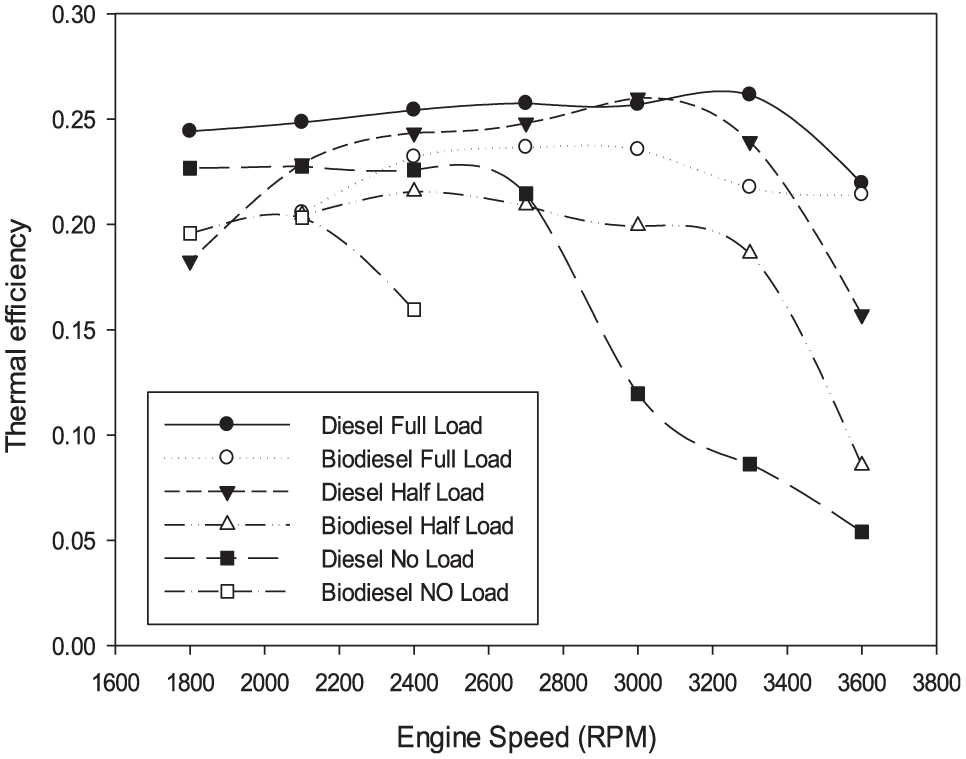
Variation in thermal efficiency.
The improvement in thermal efficiency with biofuel can be related to the existence of oxygen in the biofuel structure (which increases the concentration of the total oxygen inside the cylinder and helps improve the combustion process) as well as the higher cetane number (which makes the fuel combustion much better and easier). These properties lead to favorable effects on the combustion process and improve thermal efficiency slightly in biodiesel operation in spite of the lower heating value of biodiesel.
Hence, providing better combustion and increasing brake power and consequently causing higher thermal efficiency but still less than the diesel engine.
The values of thermal efficiencies with different loads for both fuels are approximately changed in a limited range, except no-load operation. In Figure 5, the thermal efficiency for diesel engine differs from biodiesel engine in a big range.
Variation in BSFC
BSFC defines the amount of fuel needed by the engine to produce 1 kWh of useful energy output.
For a given fuel, it is inversely proportional to thermal efficiency, which defines how effectively the engine is utilizing the energy input to produce useful work output. BSFC can be written as follows 20

This indicates that the parameters that control the engine BSFC are the fuel consumption rate and brake power.
The variations in BSFC with engine revolution for diesel fuel and biodiesel fuel are shown in Figure 6 for all loads. For both fuels tested, minimum BSFC was measured at about 52.75 r/min as 0.323 kg/kWh and at 48.36 rpm as 0.3427 kg/kWh biodiesel fuel. The average BSFC for biodiesel is 6% higher than diesel fuel.
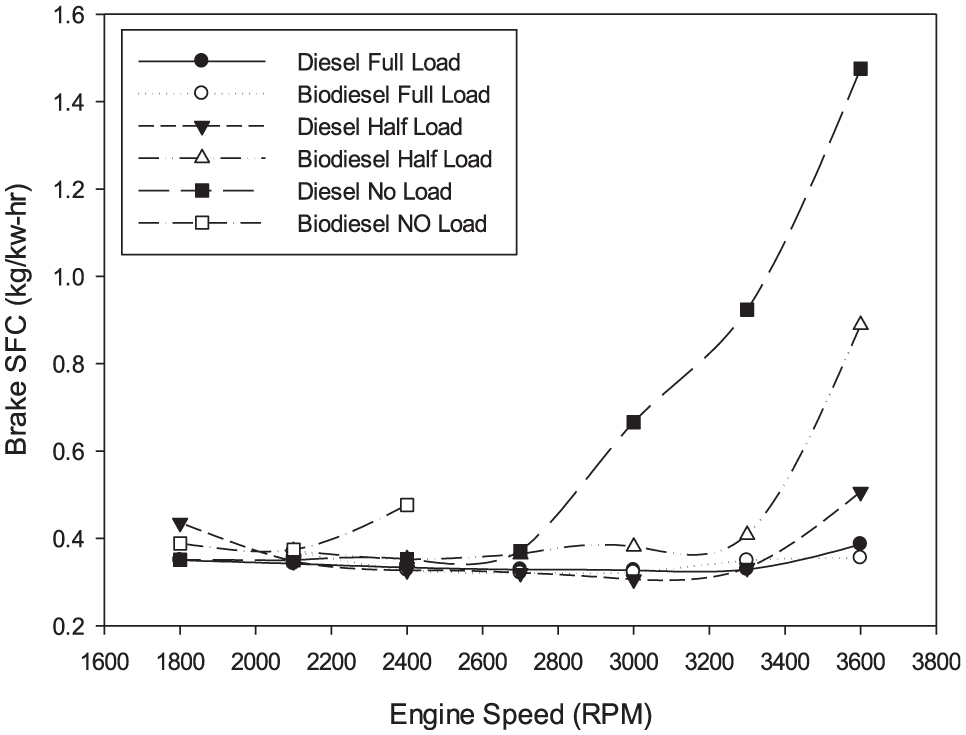
Variation in BSFC.
One possible explanation for this increase could be due to lower heating value and density of biodiesel fuel. The figure also shows that the differences in BSFC are shallow at no load. This difference rises with the load. For all other loads, BSFC for diesel fuel is lower than that for biodiesel fuel. This is expected due to the lower heating value of biodiesel.
Based on the study conducted by the United States Environmental Protection Agency (EPA), the following equation was obtained with 95% confidence interval 21

Variations in mass flow rate
The variations in mass flow rate with engine revolution for diesel fuel and biodiesel fuel are presented in Figure 7 for all loads. The maximum mass flow rate was measured at 60 r/min as 0.0017 kg/s for diesel fuel and 54.79 r/min as 0.0016 kg/s for biodiesel fuel. The maximum mass flow rate of biodiesel fuel decreased with 5%.

Mass flow rate.
Mass flow rate values of both fuels are very close to one another, and biodiesel fuel’s mass flow rate value was slightly lower than diesel fuel. This was due to lower density and higher viscosity. Figure 7 shows the comparison between the variations in mass flow rate with the different loads for both fuels, as the mass flow rate rise with the increase in the engine load for both fuels.
But the increase in the diesel mass flow rate in the diesel engine is more than biodiesel when the load increased, and the differences in mass flow rate between diesel and biodiesel fuels are very small at full load.
Variation in the exhaust temperature
The variations in exhaust temperature with engine revolution for diesel fuel and biodiesel are indicated in Figure 8.

Exhaust temperature.
Maximum exhaust temperatures were measured between 50 and 55 rps. At this point, maximum power was also obtained. These temperatures were determined as 585°C for diesel fuel and 552°C for biodiesel fuel at 52 rps.
Exhaust temperatures for biodiesel fuel were lower by 5.6% at all test periods than diesel fuel. This could be because biodiesel fuel has a higher cetane number and lower heating value than diesel fuel. Hence, shorter ignition delay and peak cylinder temperature for the case of biodiesel. Figure 8 also shows the variations in exhaust temperature with engine loads for both fuels.
As shown in the figure, for the same engine speed, the exhaust temperature increases with the increase in the engine load for both fuels. However, the rise in exhaust temperature for the diesel fuel is more significant than a biodiesel engine.
Heat release rate
Heat release rate (HRR) comparison between the two fuels is shown in Figure 9 for all loads at 2100 r/min. As shown in Figure 9, biodiesel fuel starts the combustion process earlier during the premix phase than petro-diesel. This may be the result of the higher compressibility 14 and cetane number of biodiesel compared with diesel.

Heat release rate comparison at full load.
Indicator diagram
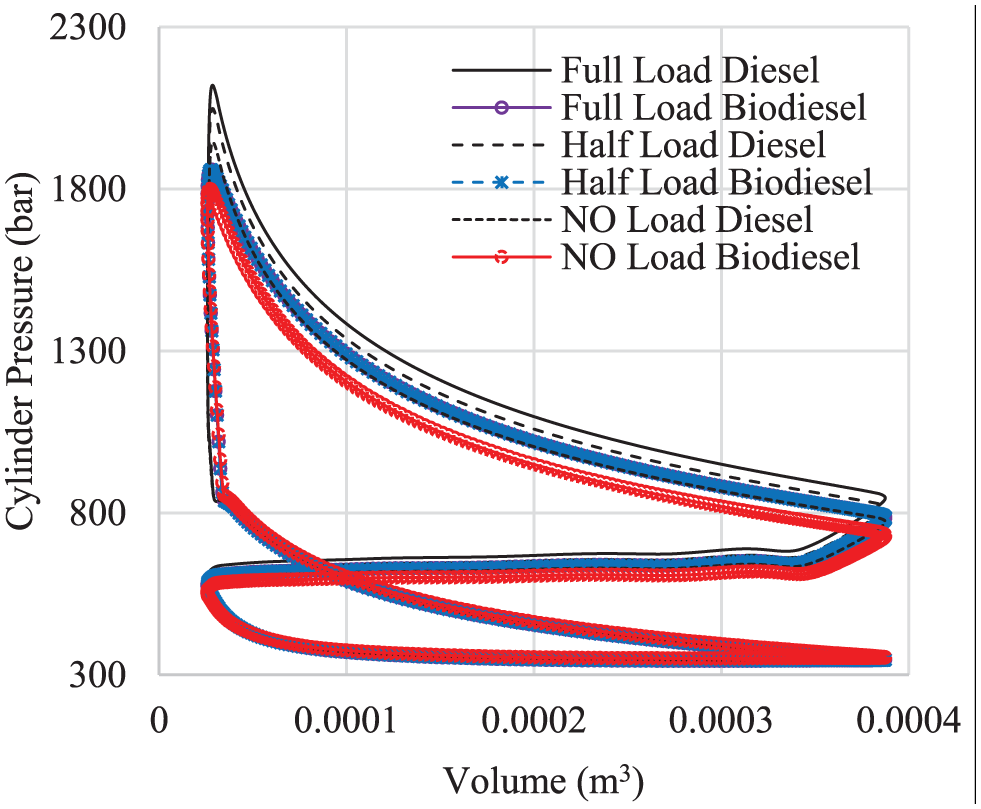
Another parameter that helps understand the abovementioned engine behavior is the indicator diagram. Figure 10(a)–(c) show the indicator diagram at 2100 r/min for full, half, and no load, respectively. The figures show higher cylinder pressures for both full and half load for the case of diesel fuel.

Indicator diagram at 2100 r/min: (a) full load, (b) half load, and (c) no load.
Another thing shown by the figure is the slight delay in fuel combustion with diesel fuel. This is clearly shown in Figure 9.
At lower loads, the performance is in favor of biodiesel. Several researchers 14 attributed this to the fuel compressibility and higher cetane number.
Temperature theta diagram
Similar trend is shown in Figure 11, which shows the temperature variation in the cylinder for both fuels at all loads at 2100 r/min. The higher cylinder temperature for full and half loads for the case of diesel engine indicates higher heat release rates and hence better engine performance.
Average cylinder temperature for all loads.
Engine mapping
The two maps shown in Figures 12 and 13 summarize the performance of the engine based on fuel and power parameters. They were drawn with the help of Diesel-RK software. 22

Engine map for diesel fuel engine.

Engine map for biodiesel fuel engine.
Those maps can be fed to the engine controller to choose the required rod-load curve characteristics. Concerning the abovementioned maps, a diesel-powered engine has the lowest fuel consumption of around 250–300 g/kWh at the relatively higher power and MEP values. While for the biodiesel fuels this is around 350–400 g/kWh at relatively lower engine speeds, power, and mean effective cylinder pressure.
This shows the advantage of using diesel fuel over biodiesel. It can be observed from both Figures 12 and 13 that at fixed engine speed, increasing engine load decreases BSFC, for example, at average speeds that is 40–45 rps the BSFC of diesel fuel engine decreased from 0.7 to 0.3 kg/kWh while that for biodiesel decreased from approximately 0.65 kg/kWh to less than 0.35 kg/kWh as the BMEP increased from 100 to 400 kPa.
Now, keeping in mind that friction losses are mainly related to the speed of mechanical parts of the engine, so at a constant speed, when increasing engine load, efficiency is gained, as an increase in the mechanical power without actually changing the friction losses. Similar results were also found by Lapuerta and Cheikh21,23 According to the contour slope in the maps, if the engine speed increases, BSFC increases slightly for diesel fuel.
However, for pure biodiesel, BSFC changes with a more significant amount than that for diesel fuel. At a specific load, the injection pump delivers the same volume of fuel, but the higher density of biodiesel compared to diesel (844 kg/m3 for diesel and 882 kg/m3 for biodiesel) led to an increase in fuel mass flow rate, also shown in Figure 7. The heating value of pure biodiesel is approximately 11.75% less than that for diesel, both the abovementioned factors led to increasing BSFC of biodiesel compared with diesel fuel.
Conclusion
The primary results obtained from this study are as follows: using KOH as a catalyst to make biodiesel produce much better results than NaOH.
The experimental results of this study showed lower average brake power for biodiesel for all loads due to its lower heating value and also the biofuel has a lower thermal efficiency than the regular diesel. A diesel-powered engine has the lowest fuel consumption of around 250–300 g/kWh at the relatively higher power and MEP values.
While for the biodiesel fuels this is around 350 g/kWh at relatively lower engine speeds, power, and mean effective cylinder pressure. This shows the advantage of using diesel fuel over biodiesel. The engine mapping results show that operation with regular diesel fuel tends to be more effective (economic and at higher power) at moderate engine speeds (around 40–45 rps within the range studied) while that for biodiesel is at lower speeds.
Footnotes
Handling Editor: James Baldwin
Declaration of conflicting interests
The author(s) declared no potential conflicts of interest with respect to the research, authorship, and/or publication of this article.
Funding
The author(s) received no financial support for the research, authorship, and/or publication of this article.