
Abstract
Bolted joints are widely used for the mechanical assembly of engineering structures and friction coefficient of the contact surface of a bolted connection is the main factor that influences its structural performance. This article presents a mathematical model based on the Florida contact model to obtain the friction coefficient for the contact surface of a bolted joint. The pressure distribution function of the bolted joint is introduced into the mathematical model and elastic, elastic–plastic, and full plastic deformation of asperities at the microscale is also considered. By varying the peak height of asperities, an improved exponential distribution function was constructed. In addition, the proposed model was verified by comparing simulation results to experimental values obtained using a CETR UMT-5 high-precision ball-on-disk friction and wear tester. Then the theoretical friction coefficient was used in the finite element model of the bolted joint, and through numerical simulation, the state of the contact surface of the tightened bolted connection was analyzed. Increasing the friction coefficient was shown to improve the structural performance of the bolted joint. The results provide a theoretical basis for designing uniform preloading of bolted joints and reducing micro-slip at the joint interface.
Introduction
Bolted joints have the advantages of being highly standardized and offering convenient disassembly and assembly and are therefore the most widely used connections in mechanical structures. The quality of a bolted joint will directly affect the assembly quality and connection reliability, and the loosening of bolted joints will greatly reduce the reliability of mechanical structures. 1 Moreover, loosening will increase geometric error, along with friction and abrasion at contact surfaces, eventually leading to the degradation of machining accuracy. 2 Through experimental analysis, Izumi 3 revealed that micro-slip, which was affected by the friction coefficient, is the main factor associated with reducing the connected quality of bolted joints. Through observing the variation of friction coefficient of flank lock type precision locknut at the different tightening speeds, Chen and Sun 4 found that the increase of friction coefficient associates with the increase of anti-loosening ratio. After that, Yu and Zhou 5 considered helix angle for threaded connections and found that the friction coefficient of contact surface between nut and flange has great impact on preload. However, researches on the friction coefficient of bolted joint surfaces are still rare. Therefore, studies on the influence of the friction coefficient of bolted contact surfaces on the performance of bolted structures will be of great significance.
The friction coefficient is an important dimensionless parameter. Various mechanisms are usually designed to control the friction coefficient and improve the safety of equipment. For a specific contact pair, accurately obtaining the friction coefficient is the key to analyzing and solving the problem. 6 In general, the friction coefficient is obtained by querying design manuals. However, although a relatively large range of average friction coefficients are known for certain materials, the values may not accurately reflect the real situation between a contact pair. 7 This is mainly due to the fact that the actual contact surface and the mechanisms involved are highly sensitive to the geometry of the friction pair, applied loads, and environmental factors. Croccolo et al. 8 provide an experimental methodology to determine the overall friction coefficients of bolted joints. Then, Yuanxin et al. 9 present an analytical model to predict the friction force in composite joint, but the analytical model has not been verified by experiments. In addition, Kim et al. 10 used friction-resistance equation to approximate the frictional resistance of the friction bolt connection based on the load-preload relationship. However, it is difficult to obtain the coefficient of friction of the contact surface in bolted joint directly. Thus, the accuracy of the friction coefficient may have an enormous impact on analysis of bolted structures. 11 It is directly related to the eigenvalues of a particular pair of surfaces comprising the bolted joint.
Quantitative descriptions of friction are an important basis for tribology studies. Current tribological research often seeks to develop quantitative methods for interpreting and characterizing tribological phenomena. Archard 12 first proposed an adhesive wear calculation model based on the proportional relationships between material wear, loading, and sliding distance. To establish an abrasive wear model, He and Rabinowicz then measured the static friction coefficients of 210 different metal combinations. 13 Based on this research, Glib 14 established a numerical calculation method for wear between a given friction pair. Furthermore, Myshkin et al. 15 simulated and analyzed the friction mechanism, micro-roughness, and micro-topography of contact surfaces and proposed an improved version of Archard’s model based on techniques for testing smooth frictional surface topography and contact entity simulation methods. Environmental factors were also shown to be important in simulating physical contact problems and should be properly considered. Robbins and colleagues16,17 pointed out that it is possible to fully control geometric parameters, chemical parameters, and sliding conditions through tribological simulation to achieve idealized tests, thereby making it possible to control the influence of each variable, including friction lubrication, and wear. Since the solid friction mechanism still remains unclear, existing friction theory can only explain but not predict the friction coefficient.18,19 Therefore, in practical applications, the friction coefficients of various materials are often obtained by experiment. In recent years, friction mechanisms have been studied further,20,21 and attempts have been made to study the friction coefficient from the perspective of its fundamental origin, and the influence of a number of major factors on the friction coefficient has been discussed.22–24 KS Baek et al. 25 measured the effects of rolling speed, contact pressure, and slip rate on the contact friction coefficient of a sliding roller under dry and wet friction conditions. Tian et al. 26 calculated the friction coefficient according to the Coulomb model using a force sensor to detect positive pressure and friction. Chang et al. 27 proposed the Chang, Etsion, and Bogy (CEB) friction model, based on the classic Greenwood–Williamson (GW) contact model, as a means of predicting the friction between two metal surfaces The CEB friction model considers the ability of the elastic contact point to bear tangential loads and concludes that the static friction coefficient decreases with increasing normal load. However, Kogut and Etsion’s study28,29 found that elastic–plastic contact points in addition to the elastic contact points have the ability to withstand tangential loads; however, the static friction coefficient obtained by the CEB friction model is smaller. Therefore, the resulting friction coefficient only considers unilateral factors and does not comprehensively consider changes in the friction coefficient due to various influencing factors.
In the literature, the surface roughness and the pressure distribution affecting the friction coefficient of the bolted connections were not considered at the same time. Therefore, it is extremely important to establish a mathematical model that considers many influencing factors and more accurately describes the friction coefficients of bolted joints. Herein, a modified mathematical model of the friction coefficient based on the Florida contact model is presented and can be used to obtain the friction coefficient of the contact surface of a bolted joint. The proposed model considers the existence of elasticity, elastoplastic, and fully plastic deformation of asperities to construct an improved exponential distribution function based on variation of the peak height of asperities. Accuracy of the model was verified by experiment. The verified friction coefficient was then used in the finite element model to explore the influence of the surface friction coefficient on the structural performance of the bolted connection. This study will serve as a valuable reference for improving the fatigue performance and reliability of bolted joints.
Mathematical model of friction coefficient of bolted joint
Details of mathematical model based on Florida model
When two surfaces of a bolted joint are in contact with each other and acted upon by an external load, roughness of the surfaces implies that only a few asperities on the surface will actually be in contact. The contact points between asperities are discrete and the actual contact area only accounts for a small proportion of the nominal contact area. This suggests that the applied load is mainly borne by a small amount of asperities. When the surface roughness of one of the friction pair is altered, asperities of the contact will also change accordingly. When the surface roughness changes, the coefficient of friction changes with it. Therefore, studying the relationship between the friction coefficient and surface roughness is prerequisite to establishing a rough surface contact model. In general, the friction coefficient of a dry sliding surface is considered to be the result of interaction between the furrows and rough peaks. More specifically, the rough peaks bite and the furrows remain on the surface as wear particles leading to wear of the friction pair. However, these three effects are usually analyzed separately. Figure 1 shows the Florida contact model of a bolted joint. 30 The mathematical model of the friction coefficient based on the surface roughness of the bolted connection is presented and each of the three types of contact acting on the model is considered.

Rough surface contact model of the bolted joint.
The average shear stress at each actual contact point of the bolted joint is assumed to be different. The total plastic deformation energy should be equal to the total plastic deformation energy of a single contact point. The formula for the general friction coefficient between the contact pairs can be obtained as

Therefore, the friction coefficient between the bolted joint can be simplified to

As depicted by Sherrington and Hayhurst,
30
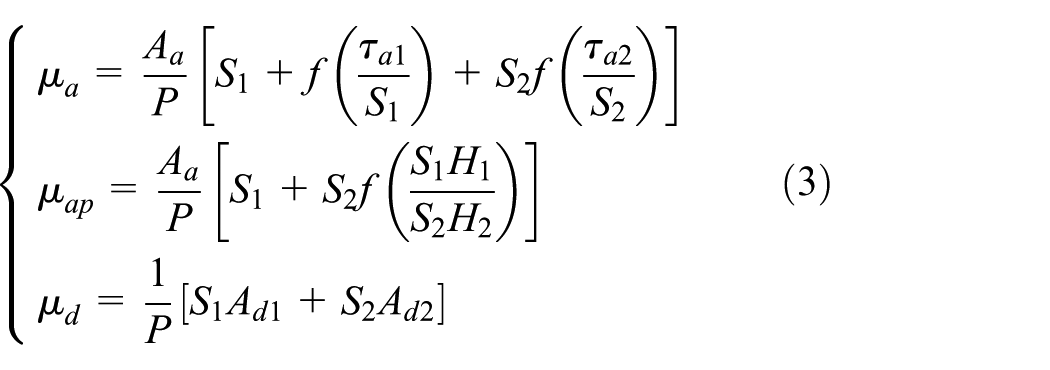
where P is the total load in the vertical direction,
Mathematical model of friction coefficient for asperities individually acting on the bolted joint surface
When the torque wrench exerts a torque on the nut and the smooth contact surface of the connector begins to slide relative to each other, the bolted joint does not generate residual debris due to wear. Therefore, only conditions caused by ploughing and adhesion of asperities are considered to contribute to the friction coefficient of the bolted joint. When the tightening process begins, the expression for the friction coefficient can be simplified to

The side of the connector that is stressed by the nut is analyzed first. As shown in Figure 2, the contact surface is subject to an average pressure P.
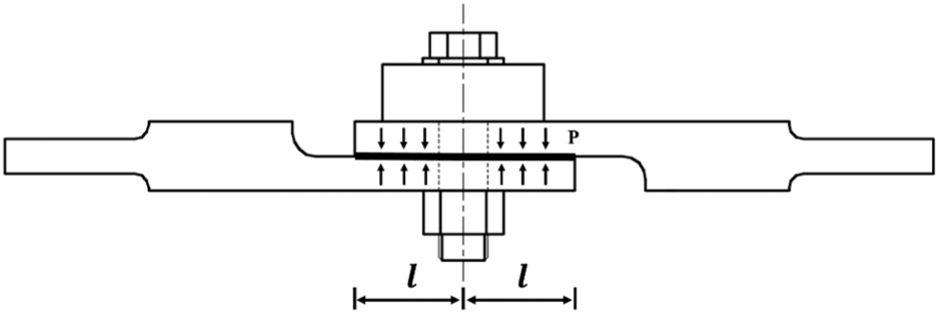
Bolted structure schematic.
The pressure distribution under the preload force can be obtained as

where

where
The pressure distribution form of the bolt contact surface is different before the nut is fully tightened. According to equation (5), the pressure distribution under the preload force can be established in the form of a power function. In order to ensure the universality of the pressure distribution function, m and n are assigned. The pressure distribution can be obtained as

Five different pressure distribution forms are analyzed and compared, including uniform pressure distribution, pressure distribution with different contact areas, and pressure distribution with different power exponents. It can be seen that when m = 0 and n = 1, p(x) represents a uniform pressure distribution; when m = 1 and n = 1 or 2, p(x) represents two pressure distribution forms with different contact areas; when n = 2 and m = 1/2 or 1 or 2, p(x) represents pressure distribution forms with different power exponents.
The load on the actual contact area is

The relationship between the rough peak contact area and the bearing load is given by the GW model.
31
The GW model assumes that the rough surface is isotropic, and the peak height of the asperities is randomly modified and obeys a modified exponential distribution function
Assuming that the radius of a spherical asperity is R and the number of asperities per unit area is


where
It can be seen that both
Now,

where c = 17 and λ = 3. The modified exponential distribution approximates the Gaussian distribution well, in contrast to the simple exponential distribution, and the predicted value is approximately equal to the mean of the Gaussian distribution.
In order to obtain the actual contact area, a probability density function describing the height of the asperities must be introduced. It is assumed that the upper and lower surfaces, with standard deviations in surface roughness,

where x is the surface roughness
The following analysis uses the surface of the machined connector as an example to analyze the relationship between the separation distance and the surface roughness of the friction pair surface.
The separation distance between the rough surface and the smooth surface 32 is given by
where
According to You and Chen, 34 the contact area of the contour is

where
Surface roughness parameters during the machining of steel surfaces can be obtained using various methods.
36
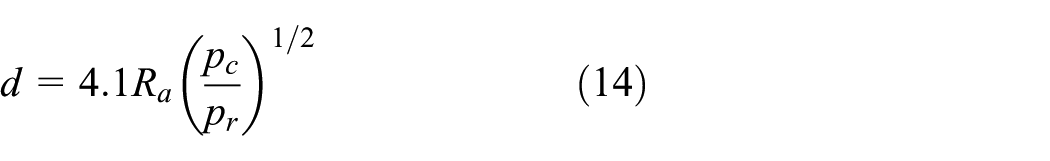
The relationship between the asperity capping radius

Substituting equations (15)–(17) into equation (14), the relationship between the surface separation distance d and the surface roughness

where
It can clearly be seen that the contact of asperities results in frictional resistance due to ploughing and adhesion. Therefore, the contribution of each should be separated and analyzed separately when studying these problems. The contact area due to the compression of asperities by ploughing

where β takes a value of 0.5 for purely elastic contact and 1 for purely plastic contact.
Considering the contact condition of the bolted joint during the clamping process of the bolt connector, an expression for the coefficient of friction can be obtained according to equation (1), expressed as

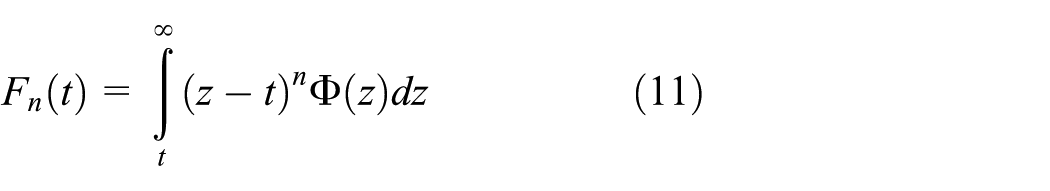
The function f can be defined for the general variable t by

When shear stress

Experimental measurement of friction coefficient
Experimental research is an important means of determining the friction coefficient. Experimental values can be used to verify the friction coefficient obtained through theoretical calculations and to study the influence of the friction coefficient on the structural performance of bolted connections.
Test specimen description
Four sets of connectors were tested in total. The material of each connectors was grade 45 steel and after heat treatment, the hardness and processing parameters of the upper and lower connectors were the same. The test specimen was a 4 cm long cylinder, and contact form used in the friction test was surface-to-surface contact. Special machining was used to vary the roughness of the contact surfaces; the contact surface of each processed part was examined in detail. Roughness of the connector surface was measured by an ST400 three-dimensional surface profilometer (Nanovea). The four sets of connector specimens were placed and fixed with a clamp at a specific location on the tester. Roughness of both surfaces of the friction pair established by test components was the same. Results are listed in Table 1.
Material properties of grade 45 steel test pieces.

Measurement and comparison
The device used to measure the friction coefficient in this experiment was the UMT-5 ball-on-disk friction and wear tester (CETR). As shown in Figure 3, the hardware structure adopts a modular design and can be used to study and test the mechanical properties, tribological characteristics, and actual working conditions of various materials at the nanometer, microscopic and macroscopic levels. Specimens can be any shape and size, with specimen diameters ranging anywhere from the nanometer scale (such as carbon nanotubes) to several hundreds of millimeters.

The process of measurement of friction coefficient.
For the four sets of test pieces representing different friction pairs, the surface of each test piece was measured several times and the final results were taken as the average of values of multiple measurements. Results of the experimental measurements of friction coefficient are presented in Table 2.
Measured values of friction coefficient for different friction pairs.

According to the specific properties of test specimens, Young’s modulus of the upper and lower connectors is
As shown in Figure 4, results of the measured values and the theoretical values of the four sets of friction coefficients are comparable. It can be seen that the friction coefficient increases with roughness of the contact surface, mainly due to the fact that the actual contact area increases with increasing surface roughness. Since the friction coefficient changes with surface roughness, higher surface roughness leads to more significant changes in the friction coefficient. Therefore, the area in which the friction coefficient is most sensitive to surface roughness is in the area in which the surface roughness is relatively high, and the relative deviation between the measured value and the theoretical value does not exceed 8.43%. However, the analytical model is only validated against general tests. The tests do not represent the actual bolted contact. Since the friction coefficient of the contact surface can not be measured in real time when the bolt is fully tightened. The model still needs to be verified by more experimental tests.

Comparison of measured and theoretical values.
Numerical analysis of friction coefficient on bolted structure
To study the influence of different friction coefficients on the bolted structure at the joint surface, the above-mentioned bolted structure was taken as the object of study. The four different friction coefficients obtained from the friction mathematical model were used in the finite element model of the bolted connection, a simulation of the tightening process was performed, and the results were analyzed.
Establishment of finite element model
A three-dimensional finite element model of the bolted connection was established using computer-aided design software, Creo. The model consisted of four distinct parts: the upper and lower connectors, screws, and nuts. Bolts used for testing were 8.8 grade hex bolts with M16 × 80 nuts. To avoid unnecessary calculations, the model was simplified. The area of contact was simplified as two rectangular blocks with dimensions of 80 mm × 60 mm × 16 mm. The area of the contact surface was assumed to be equal to the contact surface of the original connector. The hexagonal shape of the bolt head and nut were simplified to circles, and the pressure sensor was removed.
Finite element preprocessing of the model included defining the attributes, meshing, and establishing the contact surfaces and contact pairs. The material properties of the bolt and upper and lower connectors are shown in Table 3.
Material properties of bolts and upper and lower connectors.

Simulation of the bolt tightening process was divided into three separate steps: initial analysis step; loading step, achieved by applying the angular torque; and unloadeding step. The run time of each loading step was 1 s. There are four contacts during bolt tightening, namely contact between the bolt and nut threads, contact between the nut and connected piece, contact between the upper and lower connected piece, and contact between screw head and connecting piece. When the upper and lower connectors are in contact, a friction coefficient is generated. In addition to the change in contact between the upper connector and the lower connector, the contact properties of the other three pairs of contact surfaces are fixed. Therefore, only the contact surface of upper and lower connectors influenced the structural performance of the bolted connection throughout the analysis.
The coefficient of friction between the upper and lower connected parts for the four contact conditions were 0.178, 0.211, 0.282, and 0.302, and the bolted joint model was calculated four times totally. To apply the same pre-tightening force to the bolted joints with different friction coefficients, torque was applied using the angular method, that is, applying the same rotational angle (60°) to the bolt models with different friction coefficients.
The mesh module provided by ABAQUS has a powerful meshing function. The bolt and nut model was meshed with the C3D10M element and the upper and lower connection plates are swept with C3D8R element. Before meshing, accurate conversion of the model is required to fix any inaccuracies in the geometries of elements. The analysis model of the bolted joint after meshing is shown in Figure 5.

Three-dimensional finite element mesh model of the bolted joint.
Analysis of simulation results
The size of the bolt during the tightening process is proportional to the elongation of the bolt, and the elongation is proportional to the preload force. Therefore, the tightening angle of the bolt is proportional to the preload of the bolt and the relationship can be expressed as

where
According to Cheng,
37
bolt stiffness

where
The friction coefficient of the connector surface was brought into the finite element model of the bolted joint and the total contact force between the two connectors was derived. As shown in Figure 6, the magnitude of the pre-tightening force shows a linear increase with rotational angle, until finally reaching 20.337 kN.

Curve of clamping force.
According to the material properties of the respective components of the bolted structure, presented in Table 3,
Four contact properties with different friction coefficients were set between the connectors in the bolted joint. In general, many changes occur inside the bolted joint during the bolt tightening process. Stress is one of the most important components used to study the performance of bolted joints when the joints are under tension. As shown in Figure 7, the larger the friction coefficient, the greater the residual contact stress. It can be seen in Figure 8 that the larger the friction coefficient, the smaller the vertical displacement of the same node on the screw. Figures 9 and 10 show that as the coefficient of friction increases, the energy dissipation due to friction and the total strain energy of the bolted joint model also increase.

Variation of contact stress at the same node.

Variation of vertical displacement at the same node.

Variation of energy dissipation of the bolted joint.

Variation of total strain energy of the bolted joint.
Conclusion
In this article, a mathematical model of the friction coefficient of a bolted connection based on the Florida contact theory was established and the accuracy of the proposed model was verified by general experiments. The effects of the friction coefficient on stress, node axial displacement, frictional energy consumption, and total strain energy of the bolted joint were studied. Based on the results of this study, the following conclusions can be drawn:
A pressure distribution function of the bolted contact surface can be introduced into the mathematical model and a modified exponential distribution function can be established based on the height distribution of surface asperities.
Accuracy of the proposed model was verified by experiment using the CETR UMT-5 friction and wear tester and the relative deviation between the proposed theoretical model and experimental results was less than 8.43%, which suggests the model is in good agreement with the experimental values. However, the analytical model is only validated against general tests. Since the friction coefficient of the contact surface cannot be measured in real time when the bolt is fully tightened. The model still needs to be verified by more experimental tests.
The screw process of bolted joints with different friction coefficients was simulated in ABAQUS. Numerical analysis has shown that when the friction coefficient is 0.302, the highest residual contact stress can be attributed to the contact surface and the smallest associated with vertical displacement. In the bolted joint model, energy dissipation due to friction is largest, and the most significant changes are observed in the total strain energy.
Footnotes
Handling Editor: James Baldwin
Declaration of conflicting interests
The author(s) declared no potential conflicts of interest with respect to the research, authorship, and/or publication of this article.
Funding
The author(s) disclosed receipt of the following financial support for the research, authorship, and/or publication of this article: This research is supported by the National Natural Science Foundation of China (nos 51575008, 51575009) and National Science and Technology Major Project (nos 2018ZX04033001).