
Abstract
First, the lifting mechanism of neutron spectrometer sample table was designed. Then, every single part flexible multibody models and all parts flexible multibody model were built using ANSYS and ADAMS. Finally, the single part flexible multibody models and all parts flexible multibody model were analyzed when lifting mechanism reached the highest position and sliding table was moving along the X- or Y-axis with 1 ton load. The results indicate that the average deformation along Z direction is maximum among all directions of sliding table center, which is 30.1 μm. Outer cylinder takes up the largest proportion of the deformation in X direction, which is 75.8%, middle cylinder takes up the largest proportion of the deformation in Y direction, which is 91.32%, and inner cylinder takes up the largest proportion of the deformation in Z direction, which is 89.36%. Among the eight guide rails of lifting mechanism, four guide rails between the inner and middle cylinders are under uniform load, and the other four guide rails between middle and outer cylinder are under non-uniform load. The findings of the research could guide the optimal design of the neutron spectrometer sample table.
Keywords
Neutron diffraction can detect the deep stress field of components without destructing the structure, and it has many advantages in measuring depth and measuring efficiency compared to other methods. 1 Thus, the manufacture of a high-performance neutron spectrometer is very important to materials preparation and equipment manufacturing. A sample table is the key part of the neutron spectrometer; it needs to meet multi-dimensional movement and accurate positioning of the large components. 2 The lifting mechanism of sample table is required to meet large bearing capacity and long displacement, but the fixed neutron beam height limits the measurement space, so the design of lifting mechanism is extremely rigorous. Thus, it is very important to study the dynamic performance of lifting mechanism.
In recent years, many countries around the world have attached much importance to construction of neutron spectrometer, and neutron spectrometer sample table of each country has its own characteristics. The lifting mechanism of sample table of KOWARI 3 in Australia adopts unique telescopic structure, whose lifting function is realized using parallelogram mechanism and linear guide rail. The neutron spectrometer sample table of SALSA 4 in France adopts 6-degree-of-freedom (DOF) parallel robot mechanism and revolving platform, and it can realize translation in X/Y/Z direction, incline and rotation, which has a good advantage to measure the complex shaped samples. The X/Y-axis of neutron spectrometer sample table of FRM II Stress Spec 5 in Germany adopts cross feed units, under which lies the lifting and rotation mechanism, it can realize translation in X/Y/Z direction and rotation around Z-axis. The major devices of neutron spectrometer sample table of ENGIN-X 6 in England are under the ground, its lifting mechanism adopting parallelogram mechanism. The major devices of neutron spectrometer sample table of VULCAN 7 in America are under the ground, it can realize translation in X/Y/Z direction and rotation around Z-axis.
The structure of sample table is similar to that of machine tool, and the dynamic characteristics of machine tool directly determines the safety and reliability of the equipment; thus, it is necessary to research on dynamics of sample table during the sample table design process. Many scholars applied the virtual simulation technology to dynamic analysis of mechanical systems and achieved good results.8–14 Song 15 built the key component flexible model of horizontal machining center to analyze the influence degree to the machining accuracy of the key components. Yang 16 built the rigid-flexible coupling dynamic model of MCH63 machining center using RecurDyn to analyze the influence of the dynamic performance of machining center as a result of driving force and gravity distance. Pan 17 built the rigid-flexible coupling dynamic model of multi-axis machining system using ADAMS and ANSYS and modified the dynamic model according to experiment. G Bianchi et al. 18 built the dynamic model of the 3-DOF machine tool, which took the motor control and guide rail friction into account, and the dynamic analysis provided a reference for optimal design of the machine tool. A Ertürk et al. 19 built the dynamic model of machine tool and frequency response function model of working point of a tool and obtained the influence rule on machine stability of the key parts. Huang and Lee 20 built the finite element model of the machine tool using mixed modeling method and compared mixed modeling method model with single modeling method model. The result shows that the mixed modeling method is better than the single modeling method in precision and efficiency.
The structure deformation of neutron spectrometer sample table would take place under the operating condition of heavy loading and multi-DOF motion, and the deformation would influence the measuring precision of neutron spectrometer; thus, it is very necessary to study on dynamics of neutron spectrometer sample table. Because the dynamics performance of neutron spectrometer sample table is very complex, and such complex dynamics performance could not be described by the rigid body dynamic model exactly, thus, the flexible multibody dynamics analysis is required when big range movement and unit deformation of the sample table are taken into account. In this article, the single part flexible multibody models and all parts’ flexible multibody model of lifting mechanism of neutron spectrometer sample table were built using ANSYS and ADAMS, and the deformation and stress distribution of lifting mechanism were analyzed. The analysis would provide a reference for further structure optimization and performance improvement of the sample table before the product manufacturing.
Lifting mechanism of neutron spectrometer sample table design
Sample table design
According to the technical parameters of sample table (as shown in Table 1), and the general structure of neutron spectrometer sample tables from all countries, the overall structure of the sample table was designed (as shown in Figure 1).
Technical parameters of sample table.


Structures of sample table.
Sample table is divided into three parts. At the top of the sample table is X/Y-axis translation mechanism, and it is used to place the workpiece and realize translation in X/Y direction. In the middle of the sample table is Z-axis lifting mechanism, the unique multi-stage telescopic structure is adopted in this mechanism to ensure the long stroke and large bearing capacity. At the bottom of the sample table is Z-axis rotate mechanism, and it could achieve 360° of rotation around the Z direction.
Lifting mechanism design
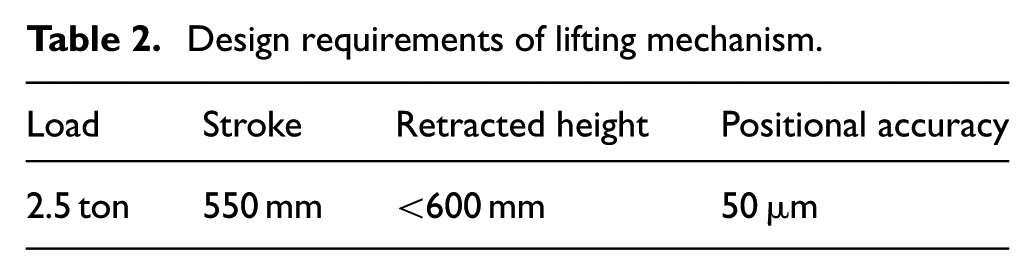
As shown in Table 2, the design requirement of lifting mechanism is proposed according to the general design requirement of sample table.
Design requirements of lifting mechanism.
Due to the height limits of the incident position for neutron source, the unique multi-stage telescopic structure is adopted to ensure that the height of the entire table meets the requirement of measuring position. The multi-stage telescopic structure includes three-stage cylinder structure and two-stage guide rail structure, and each four guide rails are uniformly distributed on surface of removable cylinders, which plays the role of guiding and overturning resistance. Due to the limited linear motion, the electrical and mechanical position limiter was installed at the end of stroke to ensure the product safety. The structures of lifting mechanism are shown in Figure 2.

Structures of lifting mechanism.
The guide rails are installed on the outer face of the inner and middle cylinder, and the sliders are installed on the inner face of the middle and outer cylinder. When the mechanism rises, multi-stage electric cylinder pushes the cross-feed units and inner cylinder moves up to 275 mm, then the inner cylinder contacts with the middle cylinder and drives the middle cylinder to move up until to 550 mm. When the mechanism descends, the middle cylinder moves down first and then the inner cylinder moves down.
Modeling of flexible multibody system of lifting mechanism
Theoretical basis
Flexible multibody model is built on the basis of Lagrange function, which plays an important role in modeling mechanical system containing constraint. Elastic displacement of flexible body of wide range and nonlinear movement is expressed by mode superposition method, to describe the deformation movement of flexible body, and to simulate finite freedom degree of non-individual body by discretized finite element model of flexible body.
Immediate movement of flexible body’s node could be expressed by summation of three vectors

where x is displacement from body reference frame to inertial reference frame, s is displacement from node before deformation to body reference frame, u is displacement from node before deformation to node after deformation.
Equation (1) is given as

where
Differentiating equation (2) can obtain the instantaneous translational velocity

where I is node inertia tensor, B is local body reference frame,
The node instantaneous angular velocity could be expressed by summation of body angular velocity and deformation angular velocity

where
The dynamic energy of flexible body could be obtained from equations (3) and (4)

where
where
Potential energy of flexible body is composed of gravitational potential energy and elastic potential energy

where

where A is transformational matrix, g is acceleration of gravity, q is modal coordinate system, K is generalized stiffness matrix

where
Thus, the generalized gravity force is as follows

where
Flexible body control equation is built on the basis of Lagrange equation, the expression is as follows

where L is Lagrangian,
The governing differential equation is given as follows

where D is modal damping matrix.
Analysis of mechanism
When the sample table working, the workpiece gravity and the eccentric loading caused by workpiece gravity could create the elastic deformation of the sample table, which could produce positioning error and result in the inaccuracy of measuring result. According to the design experience, the force condition of sample table is the most unstable when lifting mechanism reached the highest position with the maximum load. Thus, in this article, the single part flexible multibody models and all parts flexible multibody model were analyzed when lifting mechanism reached the highest position and sliding table moved along the X/Y-axis with 1 ton load.
Key part flexible modeling
The flexible model of outer cylinder, middle cylinder, inner cylinder, X-table, Y-table, and sliding table was built, and the modeling process is as follows: Transfer three-dimensional models into transfer file and import ANSYS. Define solid 185 units and Mass 21 units. Define model material property: E = 2.06 × 10⁵ MPa, μ = 0.28, and ρ = 7.85 × 10⁻⁶ kg/mm3. Mesh the model. Determine the assembly relations and constraints, determine the location of the rigid area, establish key points, and mesh the key points with Mass 21 units. Generate the nodes, establish rigid region with the generated nodes and the nodes of related surface. Define analysis type in ANSYS, define modal order number and scope of the modal value.
Flexible multibody modeling
First, replace rigid body with flexible body. Next, move the flexible body to the initial position and establish the dummy parts near the rigid node of flexible body. Then, connect the dummy parts to flexible body using rigid node and establish fixed joints or moving pairs between dummy parts. Finally, add the drive and load according to actual working condition, and the flexible multibody modeling is finished.
Simulation of flexible multibody system of lifting mechanism
Simulation results and analysis of single part flexible models
Replace single part rigid body with flexible body to build the single part flexible multibody models of outer cylinder, middle cylinder, inner cylinder, X-table, and Y-table, respectively. The initial position of the model is lifting mechanism reached the highest position and sliding table located in the center of the X/Y-table. Add the maximum allowable load and driving function of X/Y-table, this displacement drive function curve is shown in Figure 3.

X/Y-axis displacement drive function curve.
The center of sliding table has been chosen as the measurement point. At this point, the deformation in different directions has been measured under the different single part flexible multibody models. The center point deformation values of different single part flexible multibody models are shown in Figure 4.

Simulation results of single part flexible multibody models: (a) outer cylinder, (b) middle cylinder, (c) inner cylinder, (d) X-table, and (e) Y-table.
The average and maximum values of deformation of sliding table center along X, Y, and Z directions are shown in Table 3.
Average and maximum values of deformation of sliding table center along X, Y, and Z directions.
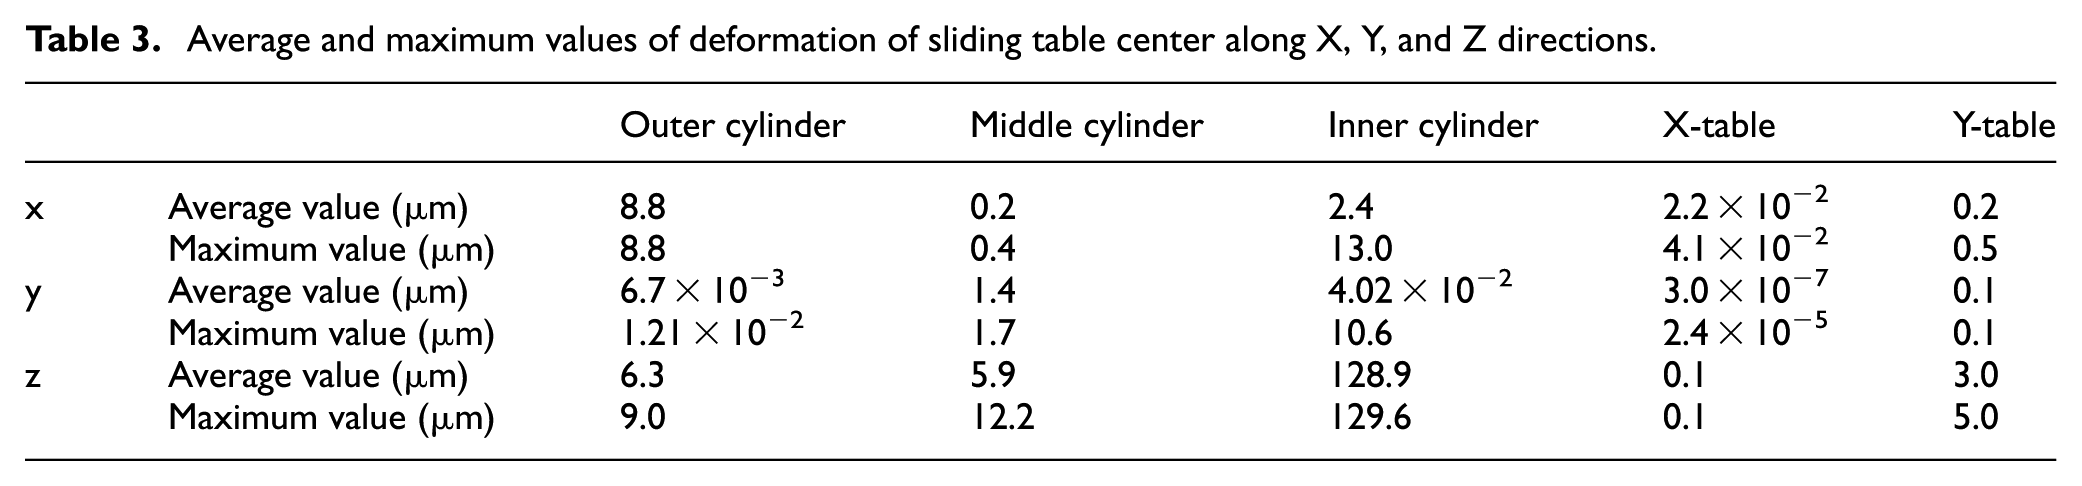
As can be seen in Figure 4 and Table 3, the deformations of sample table in different directions change with the sliding table’s position. At t = 25 and 75 s, the sliding table reached the maximum stroke, and the sample table was under the maximum eccentric load; thus, the deformations reached the maximum value. Among the X, Y, and Z direction deformations, the maximum deformations of different part flexible models are all occurred in Z direction. In X direction, outer cylinder takes up the largest proportion of the deformation, which is 75.8%. In Y direction, middle cylinder takes up the largest proportion of the deformation, which is 91.32%. In Z direction, inner cylinder takes up the largest proportion of the deformation, which is 89.36%.
Simulation results and analysis of all parts flexible multibody model
Deformation analysis of lifting mechanism
Replace all of the rigid bodies with flexible bodies to build the all parts flexible multibody model. The simulation parameters are the same as that of the single part flexible models, and the simulation results are shown in Figure 5.
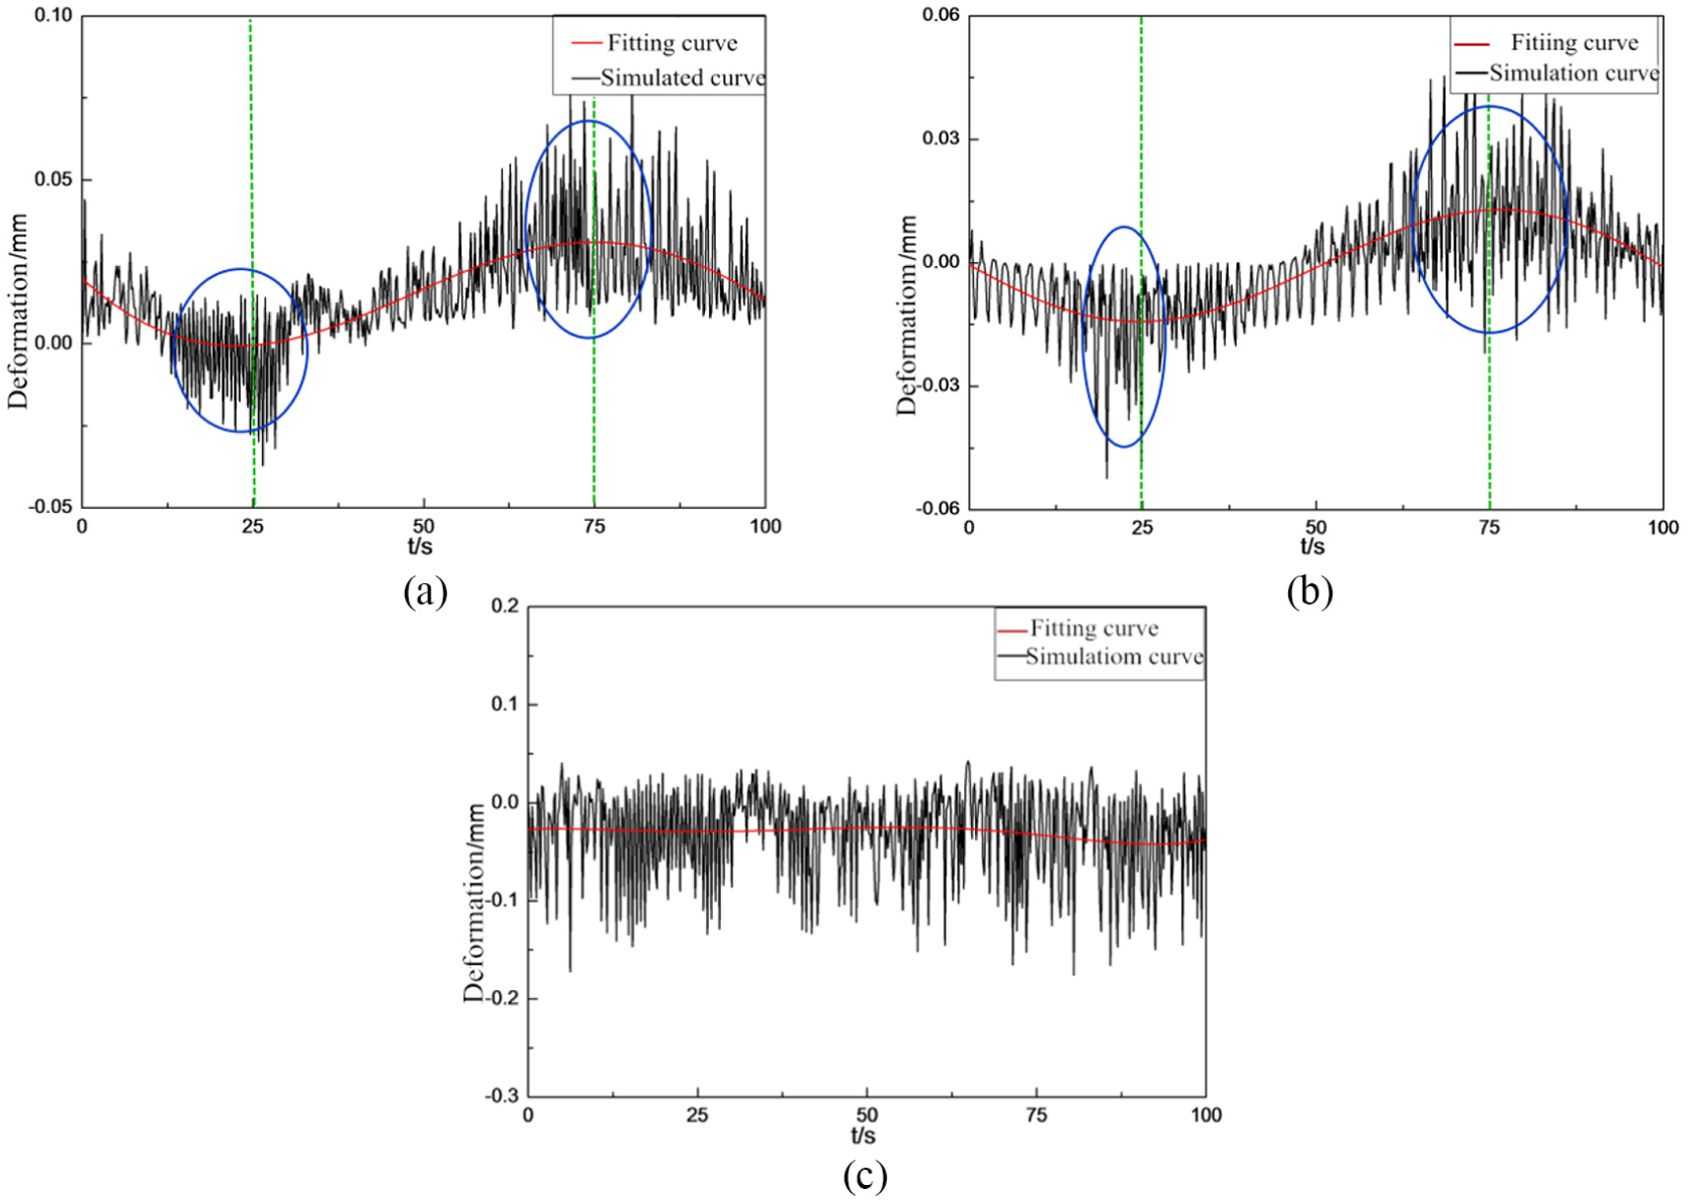
Simulation results of all parts flexible model: (a) deformation in X direction, (b) deformation in Y direction, and (c) deformation in Z direction.
The average, maximum, and variance value of deformation of sliding table center along X, Y, and Z directions are shown in Table 4.
Average, maximum, and variance value of deformation of sliding table center along X, Y, Z directions.
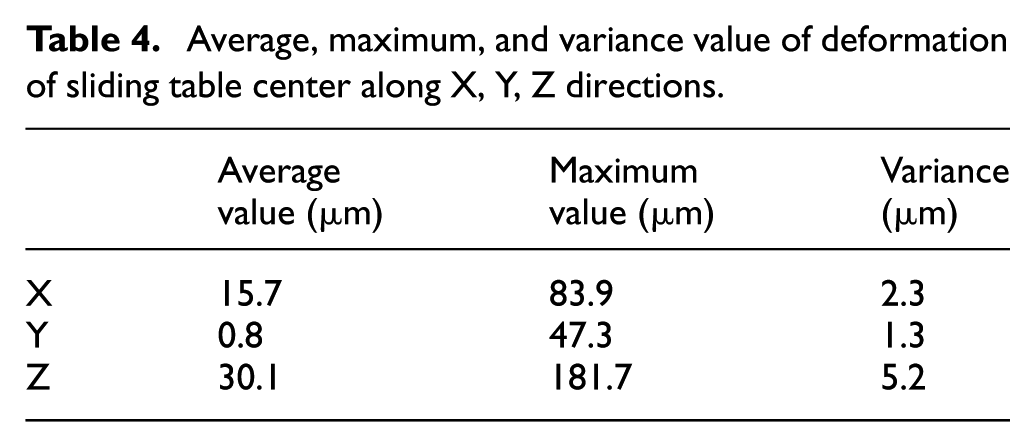
As can be seen in Figure 5 and Table 4, the deformations of sample table in different directions change with the sliding table’s position. At t = 25 and 75 s, the sliding table reached the maximum stroke, and the sample table was under the maximum eccentric load. In either case, the X and Y direction deformations reached the maximum value. Among the X, Y, and Z direction deformations, the average, maximum, and variance values of Z direction deformation are the maximum, which are 30.1, 181.7 and 5.2 μm, respectively. Figure 5 also shows that deformation curve in X and Y directions around the t = 25 and 75 s vibrated sharply, but the deformation curve in Z direction vibrated evenly all the time, which indicate that extreme positions have obviously influence on X and Y direction deformations but almost no influence on Z direction deformations.
Force analysis of guide rail
The guide rail is the main supporting part of the lifting mechanism; thus, the force analysis of guide rail is very important when designing the lifting mechanism. As can be seen in Figure 6, there are eight guide rails in lifting mechanism, which are numbered according to its different positions. Between outer and middle cylinder are No.1 to No.4, between middle and inner cylinder are No.5 to No.8. Every guide rail has two sliding blocks, one fixed on the upper surface of cylinder is represented by letter “up” and another fixed on the middle surface of cylinder is represented by letter “bottom.” Thus, there are altogether 16 sliding blocks. The force condition of sliding blocks has been analyzed when the lifting mechanism reached the highest position and sliding table moved along X/Y direction with 1 ton load.

Sample table guide rail serial number.
Every force of sliding block could be decomposed into five parts, and they are vertical load, lateral load, pitching moment, deflecting torque, and running torque, respectively, represented by FX, FY, TX, TY, and TZ. Because the guide rails of lifting mechanism are symmetrically distributed, and the force conditions are similar when sliding table moves along X/Y direction, thus, this article only analyzes the force condition of the sliding block when sliding table moves along X direction. The result is shown in Figure 7.

Force curve of upper and lower sliding block of No.1 to No.8 guide rail: (a) vertical load of sliding block of No.1 to No.4, (b) lateral load of sliding block of No.1 to No.4, (c) pitching moment of sliding block of No.1 to No.4, (d) deflecting torque of sliding block of No.1 to No.4, (e) running torque of sliding block of No.1 to No.4, (f) vertical load of sliding block of No.5 to No.8, (g) lateral torque of sliding block of No.5 to No.8, (h) pitching moment of sliding block of No.5 to No.8, (i) deflecting torque of sliding block of No.5 to No.8, and (j) running torque of sliding block of No.5 to No.8.
The maximum value comparison list of vertical load, lateral load, pitching moment, deflecting torque, and running torque is shown in Table 5.
Maximum value comparison of five kinds of load of every guide rail.

As can be seen in Figure 7 and Table 5, when sliding table moves along the X-axis, the deformations of sample table in different directions change with the sliding table’s position. At t = 25 and 75 s, the sliding table reached the maximum stroke, and the sample table was under the maximum eccentric load. At this two instants, load and torque values of each guide rail were suddenly increased and reached the maximum value. The sudden increase of the values was mainly generated by the maximum eccentric load and reverse acceleration, which makes the load conditions of sample table unstable. Load and torque values of No.1 and No.3 guide rails are almost same, load and torque values of No.2 and No.4 guide rails are almost same, load and torque values of No.5 to No.8 guide rails are almost same; this rule is in accordance with the symmetry of the model. But asymmetries about No.1 to No.4 in Figure 7 indicate that when the two-stage structure is fully extended, the force condition of the superstructure is better and more uniform compared to the substructure. Further analysis found that load and torque values of No.1 and No.3 guide rails are minimum; thus, load conditions of both No.1 and No.3 guide rails are good. Vertical load, deflecting torque, and running torque values of No.2 and No.4 guide rails are maximum, the maximum value are 7766 N, 4.71 × 10⁵ N mm, and 1.66 × 10⁵ N mm, respectively. Lateral load and pitching moment values of No.5 to No.8 guide rails are maximum; the maximum values are 2572 N and 1.15 × 10⁵ N mm, respectively. When sliding table moves along the Y-axis, form the symmetry of the model, we could know that load conditions of No.2 and No.4 guide rails are the best. Vertical load, deflecting torque, and running torque values of No.1 and No.3 guide rails are maximum. Lateral load and pitching moment values of No.5 to No.8 guide rails are maximum.
Conclusion
In this article, a new lifting mechanism of neutron spectrometer sample table was designed. The three-stage cylinder structure was used as guide rail base, and each four guide rails were uniformly distributed on surface of cylinders. The two-stage electric cylinder was used as dive mechanism. This unique multi-stage telescopic structure of lifting mechanism could meet the requirement of measuring.
The deformations of sample table along X, Y, and Z directions were analyzed when lifting mechanism reached the highest position and sliding table moved along the X/Y-axis with 1 ton load. Analysis results indicate that average value of deformations in different directions from big to small is in Z, X, and Y directions, which are 30.1, 15.7, and 0.8 μm. The main part affecting deformation in different directions is different; in X direction, outer cylinder takes up the largest proportion of the deformation, which is 75.8%. In Y direction, middle cylinder takes up the largest proportion of the deformation, which is 91.32%. In Z direction, inner cylinder takes up the largest proportion of the deformation, which is 89.36%. Thus, improving the deformation in Z direction is the key factor of improving the motion precision of the sample table, and the deformation in Z direction could be improved by optimizing the structure of the inner cylinder.
The force condition of sliding blocks has been analyzed when lifting mechanism reached the highest position and sliding table moved along X/Y direction with 1 ton load. When the sliding table reached the maximum stroke, load and torque values of each guide rail reached the maximum value. In terms of load and torque values, No.1 and No.3 are almost same, No.2 and No.4 are almost same, and No.5 to No.8 are almost same. When sliding table moves along the X-axis, the load and torque values of No.2 and No.4 guide rails are bigger than the load and torque values of No.1 and No.3. When sliding table moves along the Y-axis, the load and torque values of No.1 and No.3 guide rails are bigger than the load and torque values of No.2 and No.4. This analysis results is in accordance with the symmetry of the mechanism. But asymmetries about No.1 to No.4 in Figure 7 indicate that when the two-stage structure is fully extended, the force condition of the superstructure is better and more uniform compared to the substructure, predictably, that the more layers of the hierarchical structure is, the worse the performance is. The dynamic modeling method on multibody systems could also be used to analyze force condition of the mechanism which has a similar structure to this lifting mechanism, in order to evaluate and optimize the mechanism design.
Footnotes
Handling Editor: Chuanzeng Zhang
Declaration of conflicting interests
The author(s) declared no potential conflicts of interest with respect to the research, authorship, and/or publication of this article.
Funding
The author(s) disclosed receipt of the following financial support for the research, authorship, and/or publication of this article: This study is supported by the National Natural Science Foundation of China (grant no. 51327902), the Autonomous Research Topic Fund of State Key Laboratory of High Performance Complex Manufacturing (grant no. 2014bcxjj06), and the Wuhan Rail Transit Line 7 South Extension (Zhifang Line) Project (grant no. WHL7S-TC-G-009).