
Abstract
In this work, interactions between cold spray and swirl airflow are characterized experimentally and numerically for various air swirler geometries. The number of vanes, vane angle, vane curvature, and air velocity are varied for the swirling airflow. Spray visualization and phase Doppler interferometry techniques have been employed to obtain important parameters such as spray cone angle and mean drop size. In the numerical work, the Realizable
Introduction
Gas turbine engines are widely used in aircraft, liquid rocket engines, and so on for continuous power generation. Air swirler is mounted on the dome of gas turbine combustor for swirl generation and flame stabilization. The existence of swirl in a flow process creates a low-pressure zone near the axis, which, in turn, gives rise to the formation of a recirculation zone known as the Central Toroidal Recirculation Zone (CTRZ). Gas recirculation within a combustor increases the residence time of spray droplets and it also promotes mixing between the combustion products and spray droplets. The resultant increase in the rate of evaporation and heat availability improve the flame stability.
1
The intensity of swirl flow can be characterized by a swirl momentum based non-dimensional number known as Swirl Number (

However, based on a geometric parameter of the annular swirler, for a constant vane angle
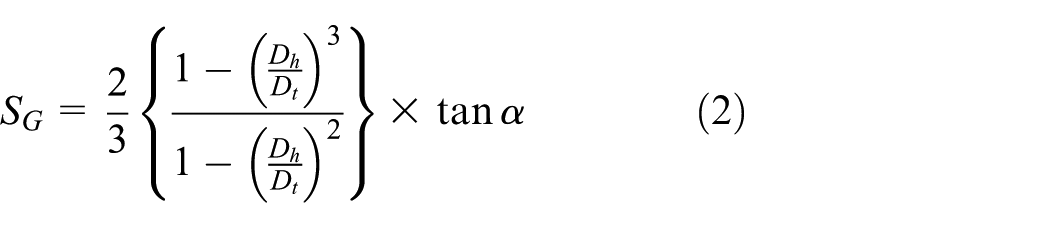
where
Swirling flows have been classified into weak swirling flows (
Reddy et al. 6 experimentally investigated the flow field characteristics of a swirler in a combustion chamber. Apart from the CTRZ, the CRZ (Corner Recirculation Zone) and the PVC (Precessing Vortex Core) were also analyzed at a location far downstream of the swirler. Velocity fluctuations of high magnitude were observed in several planes, which indicated the high degree of turbulence generated by swirl. Raj and Ganesan 7 experimentally analyzed the flow through a 30° vane swirler and the CTRZ and CRZ were identified using a five-hole pitot probe. It was found that the length and width of recirculation zone depend on the amount of turbulence created by the swirler. Dang et al. 8 studied the influence of swirl number on isothermal and reacting flow fields. The length of CTRZ of reacting flows was found shorter than that of the non-reacting flows. However, the recirculation velocity, fluctuating velocity, and Reynolds shear stress components of reacting flows were observed to be larger. Kilik 9 experimentally investigated the effects of the vane outlet angle and the blockage ratio on the aerodynamic characteristics of the downstream recirculation region and the pressure drop through the swirlers by the use of four swirlers (two flat and two curved vanes). In general, curved vanes were found to operate much more efficiently than flat vanes. Larger and stronger recirculation region and higher pressure drop were observed with increase in blockage ratio. It was concluded that swirl number is not an all-inclusive parameter that can only be used to classify the effects of inlet swirl on flow field. The type, method of generation, and the distribution of inlet swirl profile also significantly contribute to the development of the flow field. Muthuselvan et al. 10 carried out a computational analysis of flow through an axial swirler for various swirl angles from 20° to 70° in steps of 10°. It was found that the length of CTRZ increases with swirl angle initially, but after 50°, it remains nearly constant. Khandelwal et al. 11 computationally examined the effects of the geometric parameters of swirler on the flow characteristics and the effect of mass flow on pressure drop coefficient. It was found that the axial reverse flow velocity, turbulence intensity, and the pressure drop increase with an increase in the vane angle. Yilmaz 12 numerically investigated the effect of swirl number on combustion characteristics such as temperature, velocity, and gas concentrations in a natural gas diffusion flame using computational fluid dynamics (CFD) fluent. The results indicated that the degree of swirl significantly affects the size of CTRZ and fluid dynamics behavior of natural gas diffusion flame.
Pressure-swirl atomizer (simplex atomizer) is widely used for spray generation in gas turbine engines, marine combustors, and industrial furnaces. In this atomizer, liquid is introduced through tangential ports to a central swirl chamber. The swirling liquid pushes against the wall of swirl chamber and develops a hollow air core. At the exit of the injector, a thin conical sheet is produced due to the swirl velocity of liquid. The interaction between thin liquid sheet and surrounding gas causes hydrodynamic instability of the liquid sheet and results in the formation of ligaments and droplets. 13
Modern combustors adopt lean direct injection (LDI) strategy to achieve enhanced atomization and reduced emissions. LDI features a coaxially fitted swirler-atomizer assembly and direct injection of fuel and air into the combustor without any premixing. Since the fuel and air are not premixed, the performance of LDI heavily depends upon the design of the air swirler. 14
Dunand et al.
15
experimentally investigated the influence of a swirling annular gas jet, momentum flux ratio, and surrounding pressure on the breakup and atomization of liquid jet. The results illustrated that low swirl causes slight enhancement in the atomization with no major changes, but the topology of flow changes significantly when a critical amount of rotational momentum is imparted to the gas stream. This transition leads to a significant decrease in liquid jet breakup length and an inversion of droplet distribution. Sanadi et al.
16
experimentally investigated the spray characteristics of a hollow cone spray in an unconfined, low-speed co-annular isothermal swirling air jet environment. A guided vane swirler with a vane angle of 45° (corresponding to
It is evident from the literature survey presented above that significant amount of work has been carried out on the structure of airflow from a swirler and its interactions with the liquid spray, in a combustor. Still, there is a need to characterize the effects of air swirler geometry on swirl airflow development and the resulting axial and radial drop size distributions within spray chamber, in detail. This will be helpful to identify the optimal swirler geometry which will aid in obtaining fine spray atomization as well as desired droplet size distribution.
This study deeply examines the structure of recirculating flow and spray–airflow interactions for different air swirler geometries. The airflow Reynolds number (
Methodology
Experimental methodology
An experimental study is conducted to investigate the performance of swirler shape (flat and curved vanes) on the spray characteristics in a coaxially fitted swirler-atomizer assembly. Figure 1(a) represents the schematic of the experimental setup with all the pipeline connections, Figure 1(b) represents the detailed dimensions of the test setup, and Figure 1(c) represents the elaborated swirler configuration. The swirlers consist of eight vanes with hub diameter of 41 mm, tip diameter of 75 mm, and vane thickness of 2 mm. The vane angles (

Schematic of experimental setup and swirler: (a) schematic of experimental setup, (b) enlarged view of test section, and (c) schematic of swirler.
Important dimensions of atomizer.

Experiments are carried out at isothermal conditions using air and water as working fluids. Water flow rate is kept constant (0.949 L/m) by maintaining the injection pressure of 3 bar throughout the experiment, whereas the airflow rate is varied from 0 to 2000 L/m in steps of 500 L/m. A honeycomb is used upstream of the swirler to straighten the incoming airflow. Water is supplied at the required rate from a pressurized tank. Calibrated rotameters are used to measure air and water flow rates within an estimated accuracy of
High-speed shadowgraphy is employed to capture spray images, using the high-speed camera and lamp arrangement shown in Figure 1. A PCO Dimax high-speed camera is employed to capture spray images using a LED source and diffuser plate at the rate of 7000 fps. The window size chosen is 60 × 60 mm. The images are processed by ImageJ software to get the variation of spray cone angle (
A PDI (Artium PDI) is used to analyze the effect of swirling air on spray droplet size. Figure 2 shows the arrangement of PDI and experimental setup. The coherent laser beams emitted from the transmitter intersect and form a measurement probe volume. The transmitter is placed at an angle of 30° off the axis from the laser intersection point. The transmitter and receiver are placed at 500 mm distance from the probe volume. Particles passing through the probe volume scatter light that is collected by the receiver lens. A single aperture is used in the receiver to allow only light scattered by particles crossing a small region of the beam intersection zone to reach the photodetectors. The fringe pattern is monitored regularly to avoid any error in the measurement, and channel validation of 90%–99% is achieved in every set of readings. Droplet behavior is captured at various axial and radial locations with the help of a traverse attached to the experimental setup.
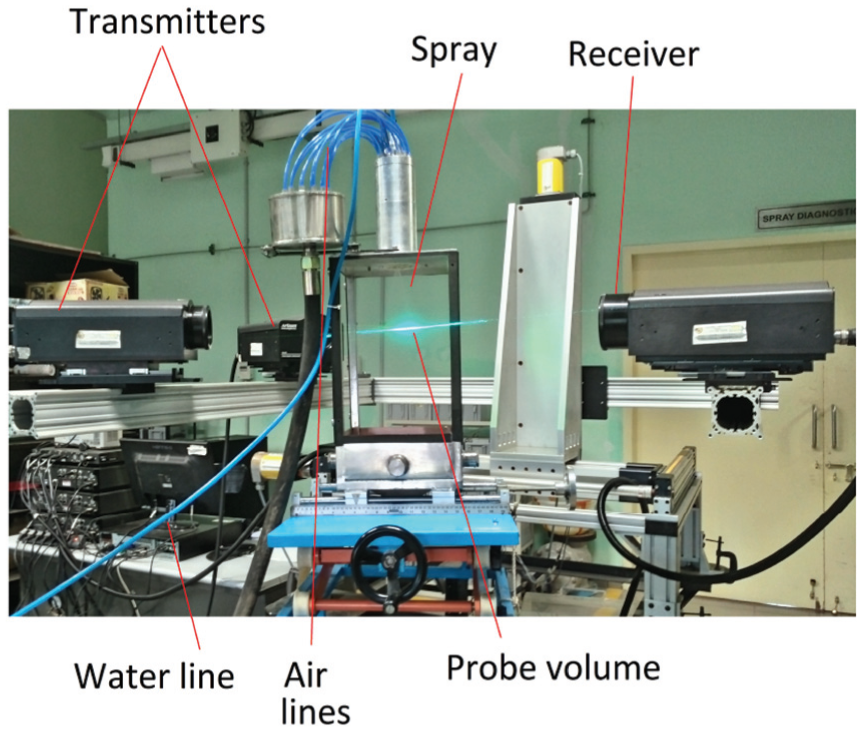
Phase Doppler Interferometry arrangement with experimental setup.
Numerical methodology
Numerical simulations have been carried to analyze the effect of swirler geometry on the airflow field and spray structure. For validating the airflow field results, the geometry employed in the work of Raj and Ganesan 7 has been considered for the numerical simulation study, and the schematic of computational domain (D1) is shown in Figure 3(a). Another computational domain (D2) shown in Figure 3(b) is also used for simulating the spray–swirl air interaction, and this domain is similar to the spray geometry used in the present experimental study. The swirler geometry, with varying vane angle (30°, 45°, 60°), varying vane number (4, 6, 8, 10, 12), and different swirler profiles (flat and curved), is created in SolidWorks and exported to the CFD solver (Fluent 14.5) for meshing and post-processing. Three-dimensional tetrahedral meshing is adopted to take care of the shape complexities and also to reduce the mesh skewness. Cells are refined in critical regions like the swirler inlet and exit, in anticipation of high velocity and pressure gradients at these zones.

Schematic of computational domains: (a) schematic of computational domain (D1) for airflow field validation and (b) schematic of computational domain (D2) for spray–swirl air interaction study.
For simulating the airflow field, a pressure-based solver with velocity inlet boundary condition and first-order implicit transient formulation are used to solve the Navier–Stokes equations with source terms due to the presence of spray droplets. The SIMPLEC (Semi-Implicit Method for Pressure-Linked Equations-Consistent) scheme is used for pressure/velocity coupling for the airflow field simulation. Turbulence is modeled using the Realizable
The Eulerian–Lagrangian approach is employed for modeling the two-phase flow. Isothermal, non-evaporative situation corresponding to a water spray interacting with swirl air at ambient conditions is modeled here, and hence, the energy equation is not considered. Based on the LISA (Linearized Instability Sheet Atomization) model of Schmidt et al., 21 a pressure swirl atomizer is modeled to inject droplets in terms of 200 particle streams. It was found that 200 particle streams are adequate to represent the initial distribution of droplets well. The LISA model is divided into two stages, involving initial film formation and subsequent sheet breakup and atomization, to model the primary breakup of the liquid jet. Droplets formed as per the LISA model are injected from the orifice, along with the swirling component of velocity. The TAB (Taylor Analogy Breakup) model which is based on Taylor’s analogy 22 is used to simulate secondary breakup. This model employs the analogy between a distorting droplet and a spring mass-damper system. The restoring force on the mass is similar to the surface tension force, the external force on the mass is analogous to the superposition of the hydrodynamic impact and aerodynamic forces, and the damping force is due to liquid viscosity. The TAB model is recommended for low-Weber-number injections and is well suited for low-speed sprays at atmospheric pressure. The trajectory of a discrete phase liquid particle (or droplet) is predicted by integrating the force balance on the particle, which is written in a Lagrangian reference frame. This force balance equates the particle inertia with the forces acting on the particle, and can be written (for the x direction in Cartesian coordinates) as

where

In the above expression
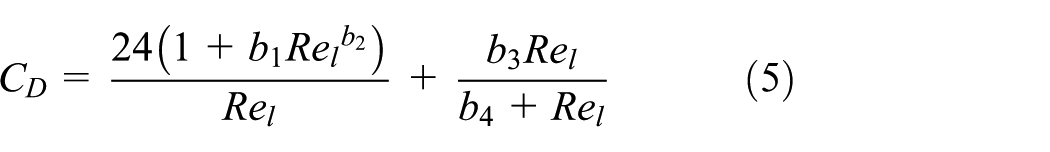
where
The above relations are adopted from the work of Haider and Levenspiel.
23
The particle shape factor,
Since the model needs the specification of the cone angle, a value of 30° has been specified which lies in the range of cone angle (27.5°–35°) measured in the present experiments. The physical and transport quantities are taken corresponding to isothermal water droplets injected into air at 1 bar and 298 K. The property values considered for the air and water media are as follows: air density (
Transient simulations are first carried out using the SIMPLEC scheme, until a steady flow is obtained. The DPM model is then enabled to inject the droplets at the required velocity (including swirl component) and initiate interactions between the discrete (spray droplets) and continuous (swirling air) phases. Unsteady particle tracking with a time step of 0.001 s is chosen to model droplet motion. For every discrete particle motion (DPM) updating, the continuous phase data are updated for 10 iterations. The boundary conditions imposed on the airflow field and spray droplets at the orifice (Figure 3(a)) are summarized in Table 2. Conditions studied are tabulated in Table 3.
Input data for the simulation.

Conditions studied in experiment and theory.

Grid independence test and validation of airflow field predictions
For ensuring grid independence of numerical results, the predicted maximum reverse velocity values for different grids are compared. The values are extrapolated to zero grid size (h → 0) by fitting fourth-order polynomial functions. These zero grid size extrapolations for the maximum reverse velocity are denoted as
Grid independence data.

In order to validate the numerical prediction for airflow without spray, the geometry (domain D1) adopted from the work of Raj and Ganesan
7
is considered. Measurements of axial and tangential components of velocities for this geometry are available for every 10 mm radial distance at various

Validation of computational predictions with available experimental data
7
for airflow simulation in domain D1 (
Results and discussions
Imparting swirl to the air stream generates a large CTRZ wherein spray droplets are entrained, thereby providing an adequate residence time for liquid fuel evaporation and combustion. The presence of swirl in the airflow also increases the radial spread of the fuel spray because of centrifugal force. Furthermore, air swirl also contributes to higher velocity gradients, which promote the generation of turbulence and greater mixing between the reactants and products. Modification of air swirler geometry is expected to cause significant changes in the recirculation zone size, air velocity field, droplet breakup and dispersal, and the mixing between the reactant species and products. In this section, the effects of swirler geometry on the airflow field are discussed first, followed by the interactions between swirling air and fuel spray droplets for a spray not undergoing evaporation or combustion (water spray in air).
Numerical predictions for the effects of swirler geometry on airflow field (D1)
Air flow structure and validation
Numerical simulations of airflow have been carried out for different flat vane swirler geometries, with number of vanes and swirl angle varied in a systematic way. Before presenting the effects of swirler geometry, some basic predictions concerning the airflow field structure are presented.
Initially, flow through a 30° swirler with eight vanes is analyzed, corresponding to a swirl number (

Air flow field in the combustor for a swirler with eight vanes and 30° vane angle (
Characterization of swirling airflow field
The effects of air swirler geometry on the essential flow parameters are presented in Table 5. It is evident that the non-dimensional length and width of the recirculation zone, turbulent intensity, maximum reversal velocity magnitude, and pressure loss gradually increase with the number of vanes. Such increases can be attributed to the higher blockage caused by increase in the number of vanes. The high sensitivity of all the flow parameters with respect to variation in vane angle is clearly seen in Table 5. In particular, the size of recirculation zone, turbulence intensity, and pressure loss increase sharply with an increase in the vane angle. The pressure loss factor, which is a measure of the flow resistance offered to the air stream when it passes through the swirler, is defined in terms of the total pressure loss

where
Effects of vane number and vane angle of swirler on airflow field parameters.

Table 6 presents the variation in the length of CTRZ and the maximum turbulent kinetic energy (
Effects of air Reynolds number (

For a fixed swirler geometry, when the inlet air velocity is changed, all velocity components change in the same proportion, resulting in the same recirculation zone size. The recirculation zone dimensions are strong functions of the swirl angle (or swirl number). Turbulent kinetic energy (
Results of spray visualization (in-house experimental)
Variation of spray cone angle (
)
The initial angle of conical sheet formed at the nozzle exit is known as spray cone angle (

Spray images (
The steps followed for accurate measurement of spray cone angle are (1) averaging of 100 images, (2) background subtraction, and (3) edge detection. The processed image is shown in Figure 7(a). Figure 7(b) represents the spray cone angle variation with airflow rate for different swirlers.

Spray cone angle (
The cone angle is measured at 20 mm downstream of the swirler exit and threshold value of 10% of maximum intensity is used to identify the spray edge. It is observed that the spray cone angle increases with airflow rate, and a wider dispersion is obtained for curved vane swirler as compared to that of flat vane swirler. The spray cone angle increases with increase in vane angle because higher swirl intensity is imparted to the flow. The radial dispersion of spray increases due to higher centrifugal force associated with higher swirl. The use of curved vanes provides smooth guidance to the flow which reduces the tendency for flow separation; whereas in the case of flat vane swirler, the chances of flow separation are high. The use of curved vane swirler results in less pressure losses, and therefore, enhancement in spray cone angle is obtained. Moreover, faster sheet breakup with smaller breakup length, larger spray dispersion, and enhanced secondary breakup are observed when curved vane swirler is used.
Droplet behavior in swirling air
Radial variation of SMD at different axial planes (D1)
The SMD (or
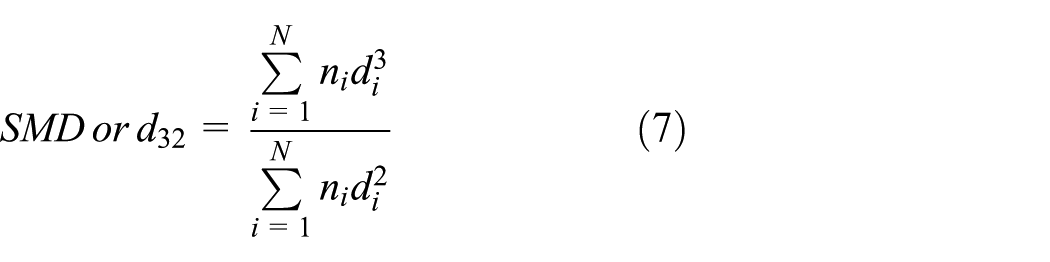
where
Also, since droplet breakup depends on the Weber number of the flow situation, a modified Weber number (

where
Figure 8(a) and (b) represents the evolution of the radial SMD variation along the axial direction (z/

Effect of recirculation on radial variation of SMD at different axial distance (
Entrainment of smaller droplets by the reverse flow near the axis is also evident, especially at larger axial distances. Only for the axial plane (
Figure 9 represents the radial variation of SMD for all swirlers at

Radial variation of SMD for all swirlers (
Droplet size distribution across the recirculation zone (D1)
Droplet size distribution at different axial and radial locations are represented in this section. Figure 10 depicts a schematic of the spray and the axial locations at which droplet distributions are calculated. To understand the droplet breakup process, two points are considered, one on the axis and another at the periphery of conical spray, for two axial positions (A,A′ and B,B′). Figure 11 shows the volume percentage of droplets in various droplet diameter ranges at the mentioned locations. It is observed that due to the presence of recirculation zone, a significant volume fraction of fine droplets is carried along the center line of the spray, especially at the farther axial position (B). Distribution at point A, which is closer to the orifice exit along the center line, shows the presence of large size droplets on the axis as well as at the jet periphery, originating from the initial breakup of ligaments.

Schematic of spray.
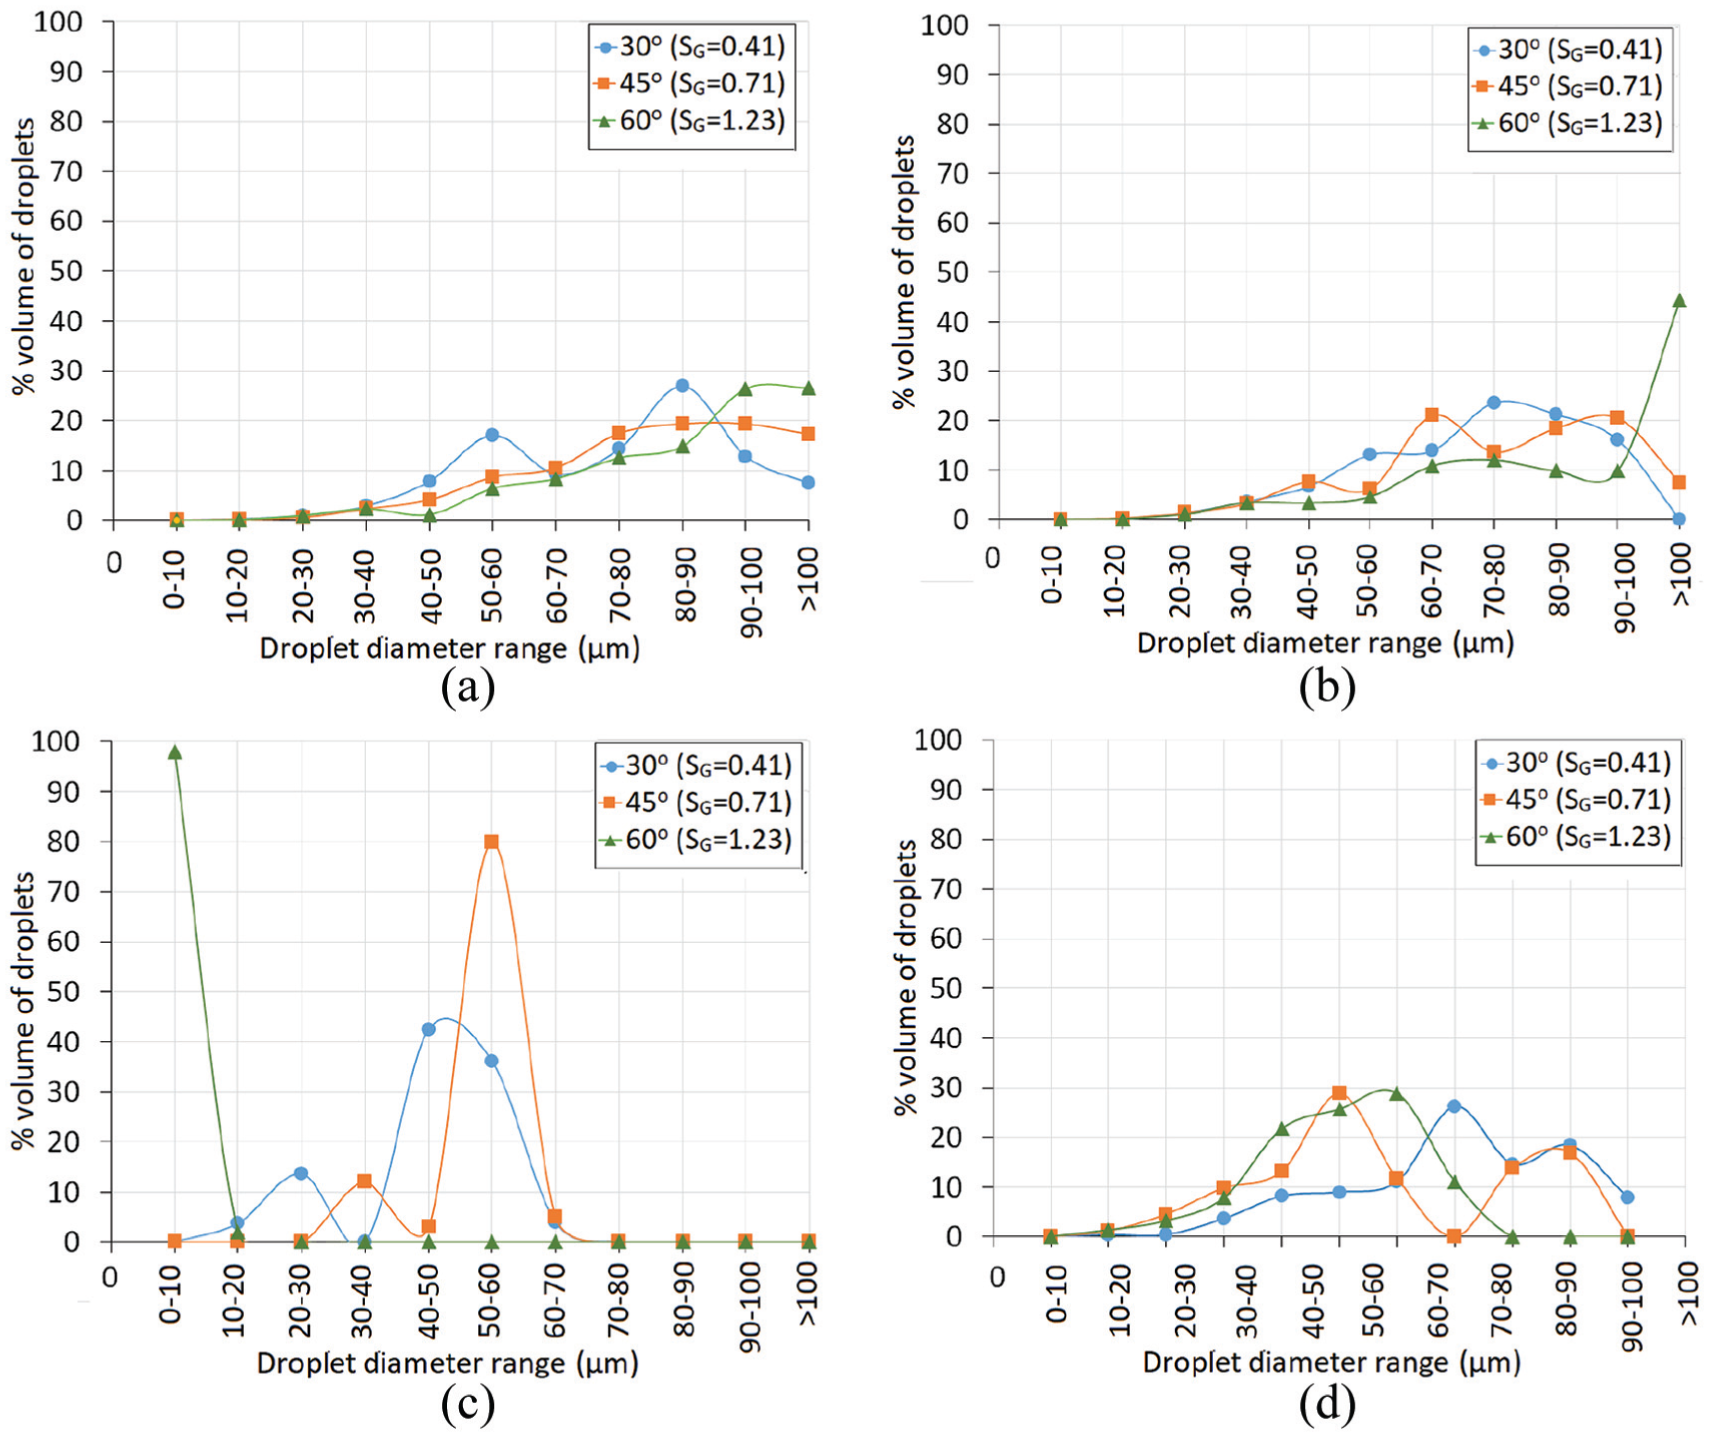
Distribution of spray droplets (
Distribution at point B, further downstream of the point A, shows the presence of coarse as well as fine droplets: the coarse droplets originating from the primary breakup and the fine droplets being carried over by the recirculating airflow, after secondary breakup. The contribution of the smaller droplets in the distribution increases significantly along the axis, as seen from the table for location B, in comparison with that for the corresponding peripheral point B′. The peripheral point B′ has a wider distribution of coarse and fine droplets. Along the periphery, at A′ and B′, the size distribution tends to shift toward fine droplets as we move away from the orifice, confirming the secondary breakup of coarse droplets into fine droplets. Away from the injector (B and B′), the droplet distribution becomes multi-modal with multiple peaks over different size ranges, in general. This can be attributed to concurrent processes such as secondary breakup and the effect of recirculatory flow which entrains fine droplets toward the injector.
Drop size measurement (in-house experimental) and comparison with numerical prediction (D2)
Figure 12(a)–(c) represents the radial variation of SMD for 30°, 45°, 60° curved and flat vane swirlers at 40 mm downstream swirler exit.
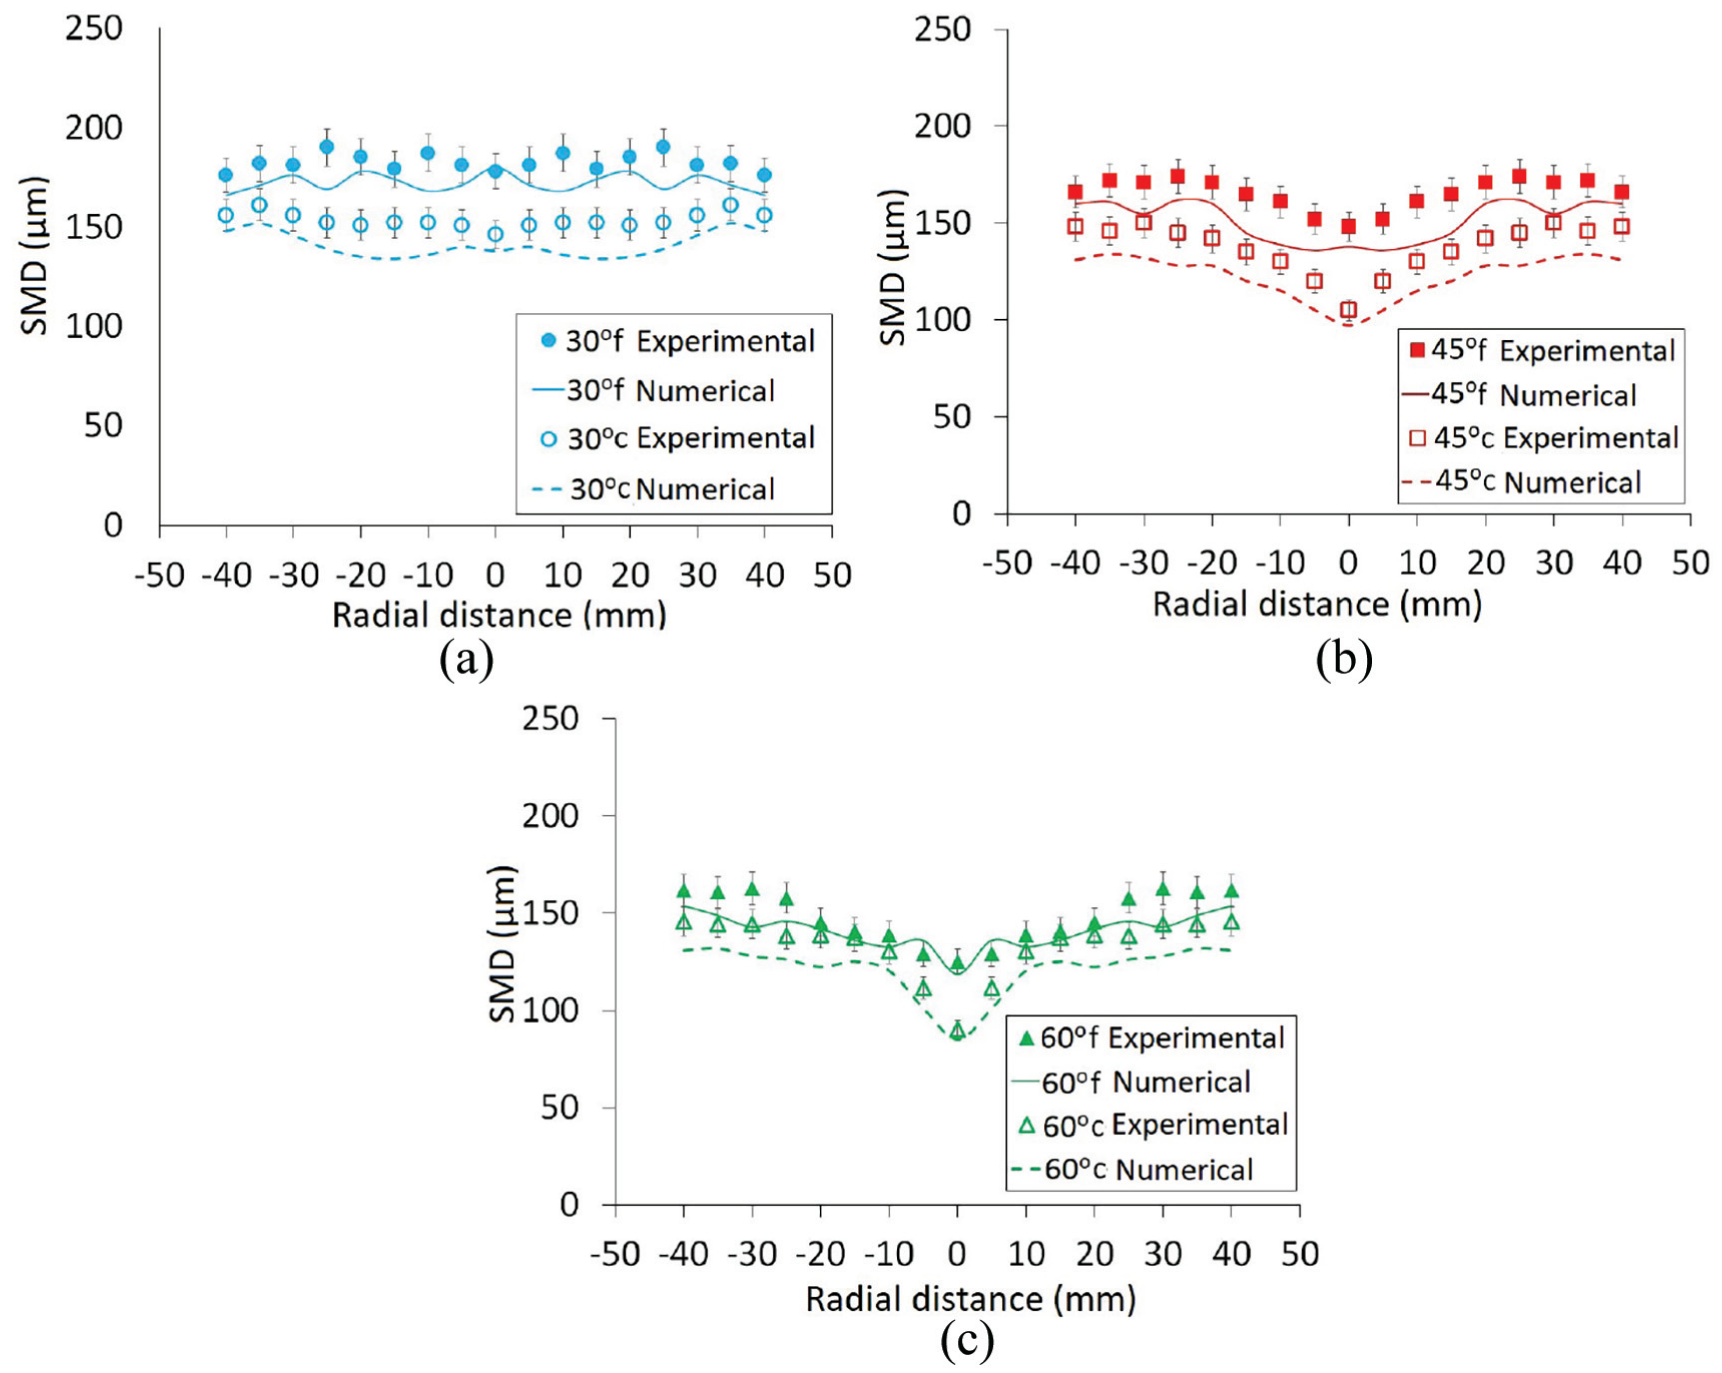
Comparison of predictions for the radial variation of SMD with experimental data (
The discrete symbols represent experimental values and solid or dash lines represent numerical results. Each set of experiment is repeated for five times; the scatter in the data (
Comparison between flat and curved vane swirlers.

The numerical values closely follow the experimental values, thus validating the spray models used in the present work. The spray cone angle (30°) for the DPM simulation is provided from the average experimental value obtained from high-speed images, since flow inside the injector has not been modeled in this study. The minor differences seen between the numerical and experimental data in Figure 12 could be due some of the simplifying assumptions made for the spray model.
Figure 13 represents the impact of three different swirler configurations on the radial variation of SMD at 40 mm downstream swirler exit. SMD values decrease with increase in vane angle of the swirler, and the use of curved vane swirler results in lower SMD as compared to the flat vane swirler. Increase of vane angle increases the swirl number as given by equation (2) and a higher swirl momentum gives rise to better atomization (i.e. smaller SMD). As regards flat and curved vanes with the same exit vane angle value, a curved vane provides smooth guidance for the airflow from the inlet to the exit of the air swirler. Therefore, pressure drop across the swirler is less for the curved vane swirler, and with less losses, momentum interaction between the airflow and the droplets is enhanced (Table 7). This results in better atomization of the spray in the case of the curved vane swirler.
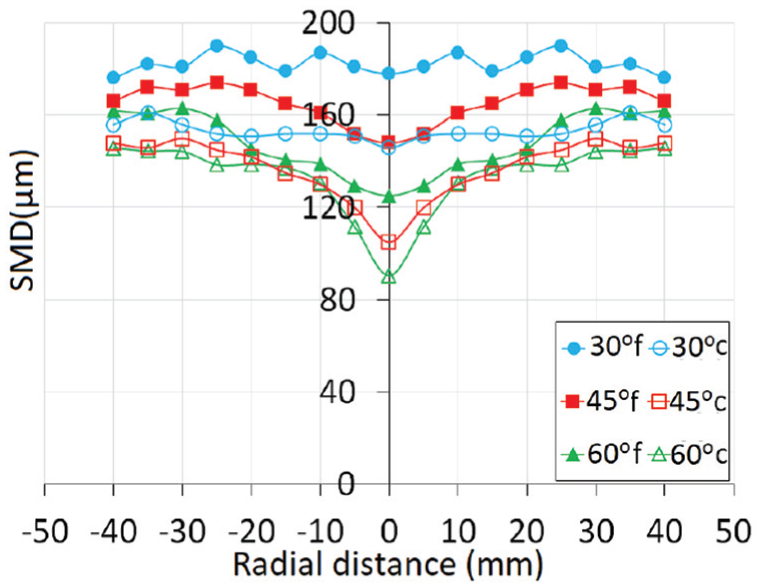
Radial variation of SMD for all swirlers (
Figure 14(a)–(c) represents the variation of percentage (%) volume of droplets with droplet size at 40 mm axial location for different swirlers. It is observed that as the vane angle increases, the percentage of droplets lying in the smaller droplet diameter range increases. The peak shifts toward left (finer droplets) by the use of curved vane swirler and the range becomes narrower which shows the uniformity of the droplets.
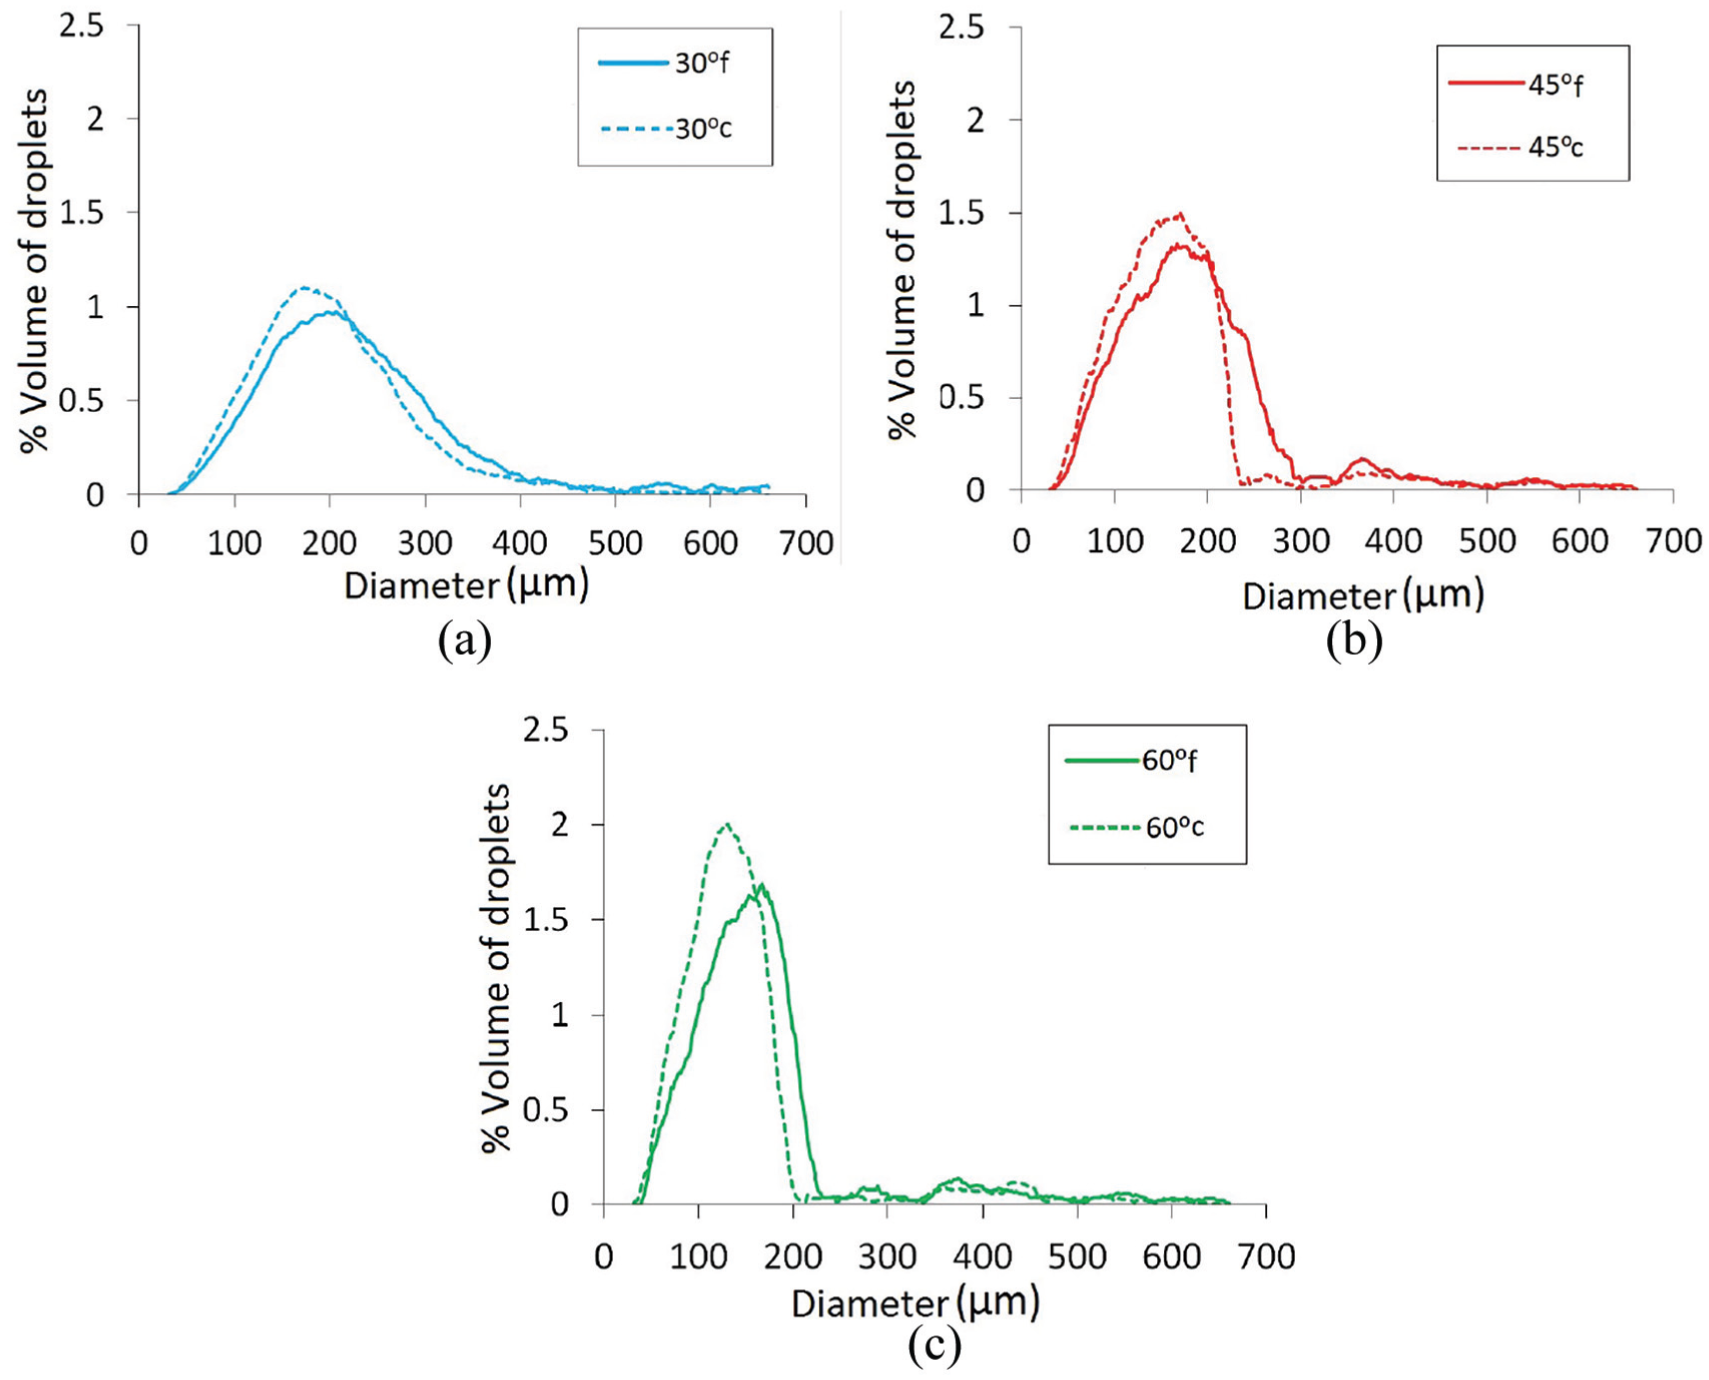
Percentage volume of droplets versus diameter range (
Conclusion
The interaction between swirl air and spray droplets in a pressure swirl atomizer (simplex atomizer) has been analyzed computationally and experimentally. The numerical predictions for the airflow field, recirculation zone size, and spatial distribution of SMD have been validated with available experimental data. Increase in the swirl angle from 30° to 60° introduces large changes in the magnitude of swirl velocity, recirculation zone (CTRZ) dimensions, turbulence intensity, and the reverse flow velocity magnitude in the recirculation zone. Increase in the number of vanes or variation in airflow rate do not alter the recirculation zone size significantly. However, secondary droplet breakup increases with inlet velocity of the swirl air. The droplet size distribution in the radial direction is significantly modified by the presence of reverse flow in the recirculation zone. Larger drop sizes are observed near the periphery of the spray due to liquid swirl and entrainment of spray droplets by the swirl air in the forward direction. Smaller droplets are observed near the axis due to entrainment by the reverse flow of air. Beyond the recirculation zone, maximum drop size occurs on the axis. Multi-modal droplet size distributions are observed due to the interplay between swirl airflow and liquid spray, especially at higher axial distances and locations close to the axis. A curved vane geometry results in smaller droplet sizes, as compared to those of a flat vane swirler. This can be attributed to the smoother guidance of swirl airflow by the curved vanes. Good agreement is observed between the present experimental data and numerical predictions, for the average droplet size as well as the droplet size distribution. The experimental and numerical results presented in this work can provide a good understanding of the interactions between spray droplet and swirl air in a gas turbine combustor and pave the way for the design of optimal air swirler.
Footnotes
Acknowledgements
Authors are thankful to National Centre for Combustion Research and Development (NCCRD) for providing high-speed camera and Phase Doppler Interferometry (PDI) to perform the experiments.
Handling Editor: James Baldwin
Declaration of conflicting interests
The author(s) declared no potential conflicts of interest with respect to the research, authorship, and/or publication of this article.
Funding
The author(s) received no financial support for the research, authorship, and/or publication of this article.