
Abstract
In order to improve the working performance of the solid–liquid two-phase flow in centrifugal pump, the current study attempted to probe into the influence of the solid-phase particle concentration on the characteristics of centrifugal pump and the drag reduction characteristics of impeller on non-smooth surface. Based on the principle of bionics and with MP80-160 single-stage single-suction centrifugal pump as a model, the current study adopted Eulerian model to carry out numerical simulation by building the pit-type non-smooth surface on the impeller blades. The results show that the higher concentration of solid-phase particles leads to the more centrifugal pump hydraulic head and decreasing efficiency. The pit type in the layout of the non-smooth surface area shows a better drag reduction effect. Shear stress of wall inside the pit is much less than that on the smooth surface, which can effectively improve the working performance of the solid–liquid two-phase flow in centrifugal pump.
Introduction
During the actual operation of centrifugal pump, the transmitted medium often contains solid particles and other impurities, such as slurry, mortar, slag, and gravel. The solid particles in the medium will aggravate the wear and energy loss of the flow parts of the centrifugal pump and reduce the operation reliability of the equipment and the service life, thereby causing the great damage to the equipment and waste of the energy. The wear of material caused by solid particles can be attributed to the direct impact of solid particles, disorderly impact, and sliding friction through the wall. Part or all of energy such as surface deformation energy transferred to the wall surface material by the impact of solid particles, thereby resulting in the wear of materials.1,2 In fact, the degree of wear particles on solid walls is not only related to the properties of solid materials3,4 but also depend on the geometry of the solid surface. Different surface geometry will change the form of interaction between particles and solid surface, which will have a strong effect on wear, such as the angle and the velocity of particles impact, the distribution and dynamic change 5 of impact area, and the influence of flow field on particles motion. A large number of studies on flow characteristics of solid–liquid two-phase flow centrifugal pump have been carried out by both domestic and foreign researchers,6,7 in which they explored the wear regularity of the flow components.8–10 The scholars have attempted to conduct quantitative analysis on the degree of wear on the basis of qualitative analysis.11–13 At the same time, it has been one of the key problems for researchers to study the drag reduction and antifraying characteristics of centrifugal pump in recent years and the way to find the geometric form of the wear resistant surface becomes a key scientific issue.14–16
Obtained from the long-term evolution, biology has formed biological structures that reduce resistance and wear, 17 such as the scale structures of riblet shape distributed on the shark skins. 18 These groove structures can change the structure and the velocity distribution of the turbulent boundary layer on the skin surface during swimming. 19 For earthworms, the milky white liquid secreted from their back has wetting function, which is capable to decrease the soil adhesion to animal body, thereby achieving reduction of viscosity and drag. 20 The special function entitled by nature greatly inspires the researchers. For example, Ren et al. 21 applied the bionic non-smooth surface drag reduction technology to agricultural machinery-bionic plow. Barthlott and Neinhuis 22 studied the self-cleaning effect of lotus leaf. Meanwhile, some scholars also conducted studies on solid–liquid two-phase flow. Kitzhofer et al. 23 applied particle image velocimetry test technology to analyze the internal flow field of centrifugal pump. After comparing the numerical results with experimental results, Li et al. 24 have revealed the influence of the solid–liquid two-phase turbulent flow characteristics on the wear of the centrifugal pump. Zhang 25 investigated the hydraulic performance, hydraulic design, and wear of solid–liquid two-phase double-suction centrifugal pump. Many scholars have done a lot of research on the drag reduction of non-smooth surface, especially on the characteristics of pit-type non-smooth surface. Yang et al. 26 take aerodynamic drag characteristics of the pit non-smooth surface rear vehicle body as the research object. The results show that the maximum drag coefficient of the rectangular pit arrangement of the vehicle rear end is 7.9%, which greatly improves its aerodynamic performance. Wu et al. 27 established a port plate with non-smooth surface, which is characterized by the alternate distribution of smooth area with semi-sphere pits and non-smooth area. The research result shows that the existence of the pit, which produces the dynamic effect, is the main reason for the improvement of the lubrication. Liang and Gao 28 arranged different pits on the swash plate surface of high pressure seawater axial piston pump. The results show that the load-carrying capacity produced by total pressure mainly comes from the contribution of dynamic pressure, and the sequence of load-carrying capacity of four different pits is Fspherical > Fcylindrical > Fcylinder–conical > Fconical.
To investigate the high-quality drag reduction and antifraying characteristics of biological non-smooth surface, 29 non-smooth surface drag reduction technology was combined with solid–liquid two-phase flow of centrifugal pump. 30 Based on the theory of non-smooth surface drag reduction, the pit-type non-smooth surface of blade was built and numerical simulation was adopted to analyze the influence of the solid-phase volume fraction under the condition of solid–fluid two-phase flow on the performance of centrifugal pump. In addition, the solid-phase volume distribution regularity of particles with different diameters and flow drag reduction characteristics in the internal flow field of centrifugal pump under the conditions of solid–fluid two-phase flow were also explored.
Model building and calculation method
Calculation model
In the process of the study, MP80-160 single-stage single-suction centrifugal pump as a model pump was selected. Its design parameters are as follows: flow rate, Q = 50 m 3 /h; hydraulic head, H = 32 m; and rotating speed, n = 2900 r/min. Table 1 shows the main geometric parameters of the model. The pit-type non-smooth surface unit is selected to be arranged on the working surface of the impeller blades. The pit diameter of the non-smooth unit in centrifugal pump impeller is d = 1 mm, axial spacing is m = 2 mm, and radial spacing is l = 3 mm. The calculation models of the smooth surface impeller and the pit-type non-smooth surface impeller are shown in Figure 1.
Main geometry parameters of model.


Calculation model of blade: (a) blade of smooth surface, (b) blade of non-smooth surface, and (c) distribution of pit on the blade.
Mathematical model of the solid–liquid two-phase flow of centrifugal pump
Compared with mixture model, the Eulerian model can calculate the flow field more completely, fully, and accurately by taking into account the factor of inter-phase momentum exchange during processing of multiphase flow. 31 In the process of calculation, the Eulerian model is selected, and solid–liquid two-phase flow of centrifugal pump internal flow field of mixed sand is numerically simulated, where q-phase mass conservation equation and momentum conservation equation are

where
By the mass conservation equation,

where

where
Grid generation and grid independence verification
The quality and quantity of grid are crucial to the accuracy of numerical simulation results. The more the grid, the better the grid quality and the more accurate the calculation results. However, too many grids will consume more computing resources. Therefore, in order to ensure that the calculation results are not affected by the number of grids, and considering the computer resources, the grid independence of the remodeled pump is verified.
In this article, a single part of the remodeled pump was meshed by ANSYS ICEM CFD, and local mesh densification was carried out near the pits on the smooth surface of the remodeled pump, and then the grid was assembled to form the final computing domain grid with the grid quality above 0.37. The computational grid is shown in Figure 2. Figure 3 shows the results of head and efficiency under different grid numbers under standard working conditions, Q = 50 m 3 /h. As can be seen from Figure 3, when the total number of grids reaches 2 million, even if the number of grids increases, the variation of head and efficiency under design conditions is less than 1%. Therefore, the number of remodeled pump grid control is about 2 million.
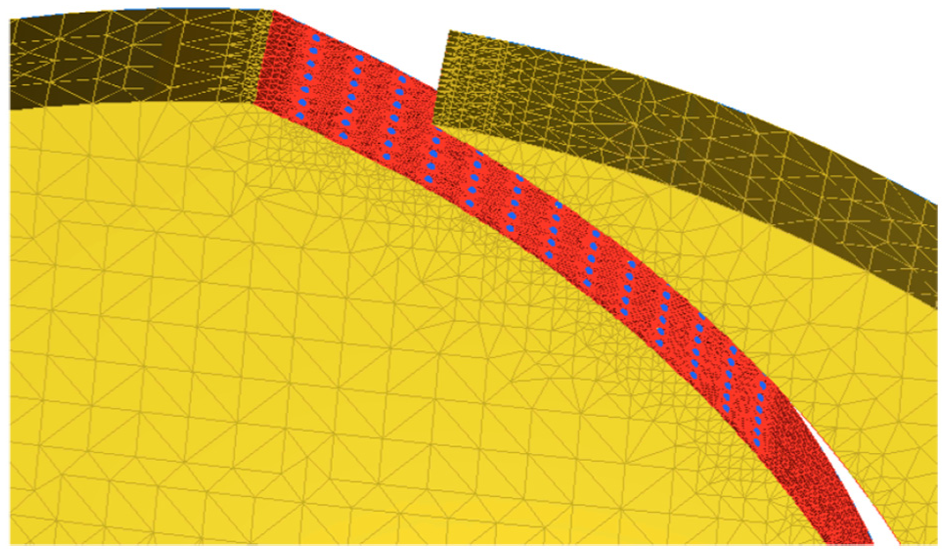
Fluid domain local grid.
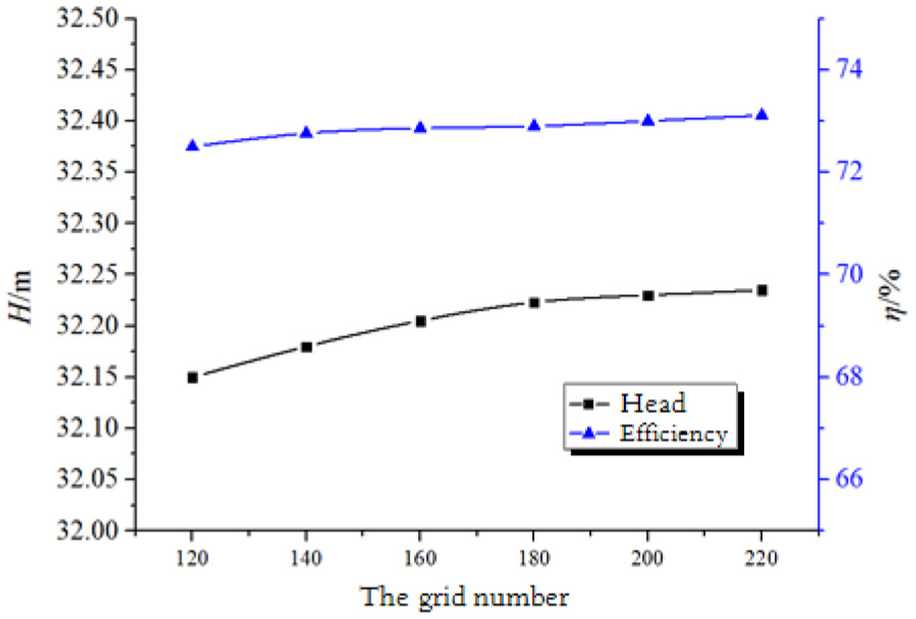
Head and efficiency on different numbers of grid.
Setting of the boundary condition
In the process of calculating solid–liquid two-phase flow, solid–liquid exchange coefficient model is Gidaspow model. The centrifugal pump solid–liquid two-phase turbulent flow model is the renormalization group k – ε turbulence model. Given that the inlet particle concentration Cv is evenly distributed, and the inlet velocity condition is adopted to set flow velocity
The influence of solid–liquid two-phase flow on the performance of centrifugal pump
Due to the different density of solid-phase particles and water, the density of the pumped medium by centrifugal pump changes after adding solid-phase particles of different volume concentrations, which is calculated as

where
Under different volume concentrations of solid-phase particles, the density of internal fluid in centrifugal pump is calculated in Table 2.
The density of fluid under different Cv.

The centrifugal pump head of the solid–liquid two-phase flow is

where P1 and P2 are the average total pressure of the inlet and outlet unit areas, respectively;
The influence of the solid-phase particle concentration on the characteristics of centrifugal pump
The head and torque change curves of the centrifugal pump under different volume concentrations of solid-phase particles are shown in Figure 4. It can be seen from Figure 4 that the variation trend of centrifugal pump head under different volume concentrations of solid-phase particles is consistent with that under clear water medium with Cv = 0. With the increase of the flow, the head decreases gradually and the decreasing trend is faster and faster. When the flow rate of the centrifugal pump is identical, as the augment of Cv, the viscosity of solid–liquid two-phase fluid increases and the friction between the internal fluid and the friction loss between the fluid and the wall surface increases, resulting in the reduction of the head. And with the increase of Cv, the downward trend gradually tends to be slow. With the augment of Cv under the condition of small flow rate, the drop amplitude of head is obviously larger than that under the condition of large flow rate. Under the design condition, Q = 50 m 3 /h, the head of clear water is about 32.7 m. When Cv = 0.1, the head of centrifugal pump decreases to 30.2 m. When Cv increases to 0.2, the head of centrifugal pump decreases to 29 m, which was about 11.3% lower than that of the clear water. At the same time, with the advance of the volume concentration of solid-phase particles, the friction loss between the solid–liquid mixture and impeller are on the rise. Under the condition of the same flow rate, the internal friction loss of the impeller also increases gradually with the enlargement of Cv. The increase of friction loss in the condition of large flow rate is obviously higher than that of the condition of small flow rate, which is mainly manifested in the torque of the centrifugal pump impeller. The increase of the centrifugal pump impeller torque will lead to larger motor power consumption and decline in the efficiency of the centrifugal pump, which reflect that the increase of solid-phase volume concentration has tremendous impact on the performance of the pump.

The performance curves of centrifugal pump under different volume concentrations of solid-phase particles: (a) change curves of head and (b) change curves of torque.
The influence of solid-phase volume concentration on the distribution of particles
The wear degree of the particles to the wall rests with the volume fraction of solid-phase particles on the wall of the impeller. Solid-phase particles wore more on the wall in the area with larger volume fraction. Figure 5 shows the particle concentration distribution in the cross-section of the centrifugal pump with different solid-phase concentration under the condition of design flow, Q = 50 m 3 /h. From Figure 5, it can be found that the volume concentration of solid phase has a certain effect on the distribution of particles, and the distribution regularity under different volume concentrations is basically unanimous. When the volume concentration is relatively low, such as Cv = 0.05, solid-phase particles of centrifugal pump flow are uniformly distributed. Solid-phase particles can flow together with the fluid without accumulating in the pump. However, with the increase of the volume concentration, the concentration of solid-phase particles changes.
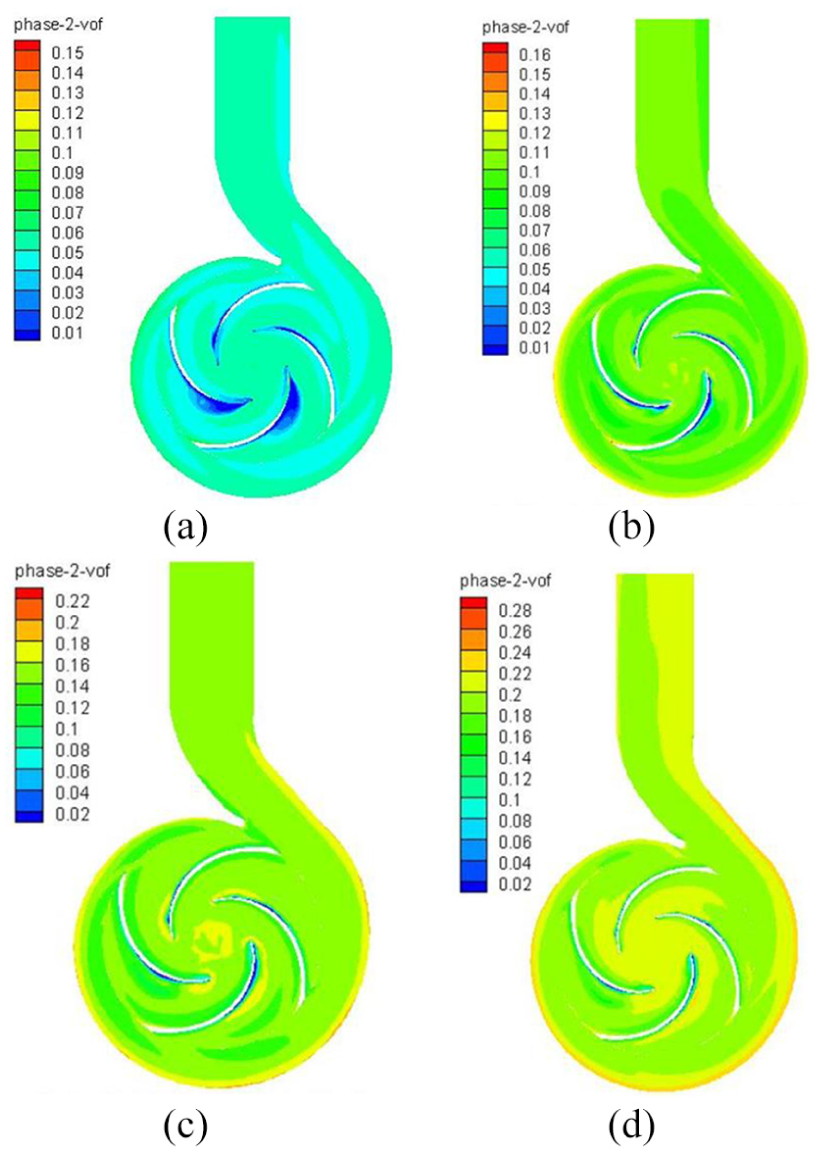
The distribution regularity of solid-phase particles: (a) Cv = 0.05, (b) Cv = 0.1, (c) Cv = 0.15, and (d) Cv = 0.2.
With the increase of the solid-phase volume concentration, the particles gradually accumulate in the flow and show a tendency to move toward the working surface. Moreover, due to the rotor–stator interaction effect of the impeller tongue, the particles are not uniformly distributed gradually. At the impeller inlet, the solid-phase volume concentration distribution is relatively uniform, but the particle concentration is higher than that of the impeller runner. With the deepening of the flow, the mechanical energy of the centrifugal pump is converted into the kinetic energy of the fluid by the impeller. The distribution of solid-phase particles inclines to the working surface of the blade under the action of centrifugal force and inertia force due to the high density of the solid-phase particles. Figure 6 shows the particle concentration distribution of solid-phase particles on the volute under the standard working conditions, Cv = 0.15. As the high-speed water flow from the impeller dashes the inner wall of the volute, the fluid kinetic energy is gradually transformed into pressure energy as the flow area gradually increases and the fluid speed gradually slows down. After impacting the volute wall, solid-phase particles with high speed accumulate on the inner wall of the volute. The maximum volume concentration of solid-phase particles in the volute is about 0.22, which is 46.6% higher than that of the inlet.

The distribution of solid-phase particles on the volute.
The drag reduction characteristics of solid–liquid two-phase flow of non-smooth surface blades
Analysis on the shear stress of the back wall of non-smooth surface blades
In the analysis of the influence of non-smooth surface on solid–liquid two-phase flow of centrifugal pump, the back of the impeller blades with smooth surface and the back of the impeller blades with non-smooth surface are selected as the control surface. The average wall shear stress is calculated, respectively, to carry out comparative analysis. The blade models with smooth surface and non-smooth surface are shown in Figure 7. During the process of studying, the influence of the non-smooth surface blades on the wall shear stress, Cv = 0.1, and particle diameter, 0.05 mm, remains unchanged.

Calculation model of the blade of solid–fluid two-phase flow: (a) smooth surface and (b) non-smooth surface.
The average wall shear stress curve of the smooth surface blade with different solid-phase volume concentration is presented in Figure 8. The shear stress generated by the primary phase (clear water) is shown in Figure 8(a), and the shear stress generated by the secondary phase (particles) is shown in Figure 8(b). It can be seen from Figure 8 that when the volume concentration of solid-phase Cv is at the range of 0.05 to 0.2, the wall shear stress generated by solid-phase particles is far less than that of clear water in corresponding flow. As the volume concentration of solid-phase particles increases, the wall shear stress of solid-phase particles enhances gradually, and the wall shear stress generated by the primary phase shows a gradually decreasing tendency. Under the design conditions, Q = 50 m 3 /h, when Cv = 0.05, 0.1, 0.15, and 0.2, the wall shear stresses generated by the primary phase on the back of the blade are 183.4, 148, 122.1, and 100.1 Pa, and the wall shear stresses generated by solid-phase particles are 14.4, 18.6, 36.9, and 50.7 Pa, respectively.

Average shear stress on the wall of blade with smooth surface: (a) average shear stress of principal phase and (b) average shear stress of deputy phase.
The average wall shear stress curves generated by solid-phase particles in different flow rates of the back of the blade with smooth surface and the back of the blade with non-smooth surface are shown in Figure 9. From Figure 9, it can be found that the shear stress generated by the solid-phase particles on the non-smooth surface is less than that on the smooth surface as a whole, which is attributed to decreasing the velocity gradient of the boundary layer. Due to the thickening of the viscous sublayer of blade with the increase of non-smooth surface, non-smooth surface has an obvious delay effect on the transition of an active laminar boundary layer to turbulence. That changes turbulent characteristics of the near-wall region. Thereby, the velocity gradient of the boundary layer is decreased, which in turn reduces the effect on the solid wall shear stress. Under the condition of small flow rate, there is hardly any difference between the two blades. The reduced value of average shear stress on the back of the blade with non-smooth surface is relatively low, and the non-smooth surface gradually shows a better effect of reducing the shear stress with the increase of the flow. Under the design conditions, the average shear stress on the back of the smooth blade is 25.8 Pa, while that on the back of the non-smooth blade is 23.2 Pa, which is about 10% lower. At the point of large flow of 80 m 3 /h, the average shear stress on the back of the smooth blade is 46.3 Pa, while that on the back of the non-smooth blade is 36.8 Pa, which is about 20.5% lower.

Average shear stress on the wall of blade.
Figure 10 shows the head curves of two calculation models with smooth surface and non-smooth surface blade back in centrifugal pump under different flow rates. It can be seen from Figure 10 that the influence of non-smooth surface on the head of centrifugal pump in solid–liquid two-phase flow state is different from the calculation result in single phase (clear water). In the flow range of 30 m 3 /h ≤ Q ≤ 60 m 3 /h, there is almost no difference in the head. However, with the increase of the flow, the head calculation result of non-smooth surface model shows enhancing tendency. When Q = 80 m 3 /h, the head of centrifugal pump with smooth surface is 17.6 m and that with non-smooth surface is 18.2 m, increasing by 3.4%. To sum up, the non-smooth surface of the centrifugal pump in the process of solid–liquid two-phase flow shows a better effect on reducing the wall shear stress of the blade under large flow.

Head of centrifugal pump with non-smooth surface.
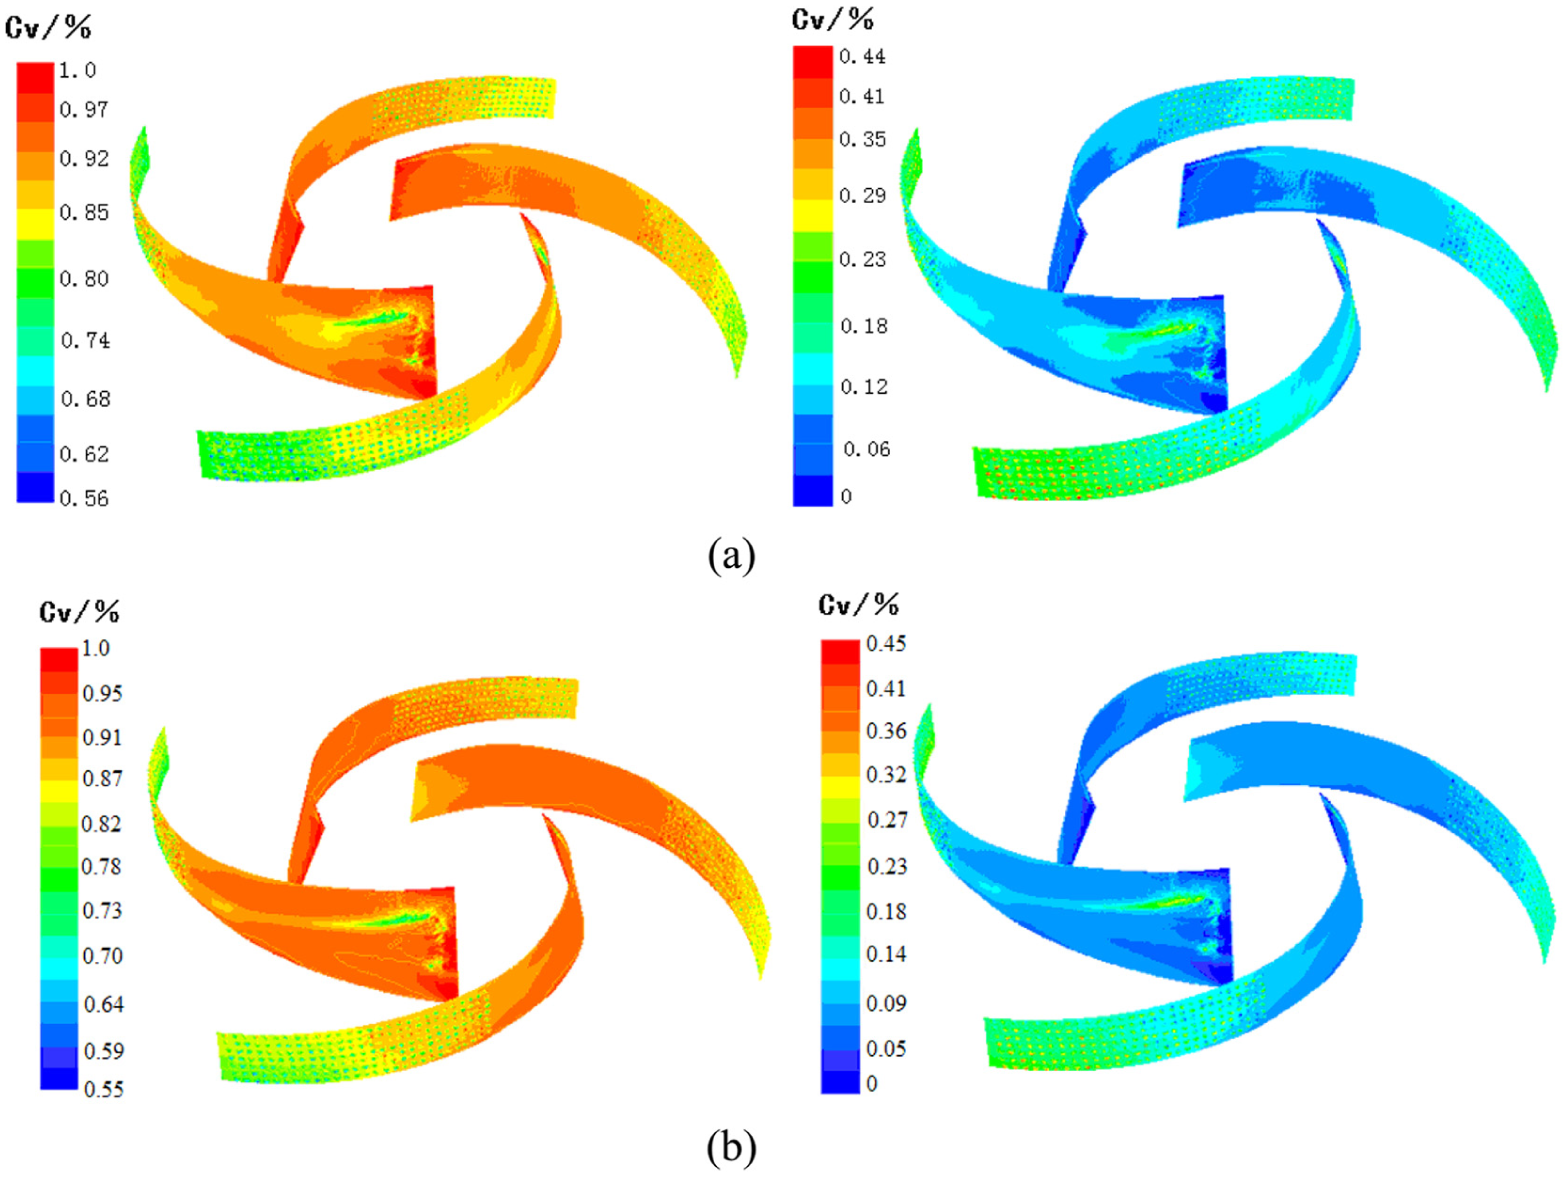
Figure 11 shows the wall shear stress generated by solid-phase particles of the back of the smooth blades and non-smooth blades under the standard working conditions. It is clear in Figure 11 that, in the beginning, the speed of the solid-phase particles into the pump impeller runner is lower and the shear stress on the wall of blade is smaller. Then, after the impeller drive fluid is rotated, the speed of the particles from the impeller inlet to the outlet increases as the impeller radius increases. The wall shear stress generated by solid-phase particles gradually increases from the inlet to outlet. When entering the impeller runner, solid-phase particles collide with the impeller back shroud, which reduces the speed, and concentrate on the back shroud the rear cover plate. The volume concentration of solid-phase particles increases, which leads to greater wall shear stress near the back shroud of the blade than that near the front shroud. In the area with pit-type non-smooth surface, the wall shear stress inside the pit is much smaller than that on the smooth surface, mainly due to the formation of the secondary vortex inside the pits. Under the interaction with the streamwise vortex and the secondary vortexes, the streamwise vortex associated with the low-speed stripes is weakened and the spanwise aggregation of low-speed stripes is controlled. Compared with the smooth surface, the transition of the stripes on the pit surface is relatively flat and transition of low-speed stripes shows good linearity. The pits curb the lateral flow and strengthen the stability of the fluid flow. Although the maximum shear stress of the non-smooth surface blade is larger than that of the smooth blade, and the average wall shear stress is relatively small, the effect of drag reduction can be reflected.

The wall shear stress generated by solid-phase particles: (a) blades with smooth surface and (b) blades with non-smooth surface.
The distribution of particles on the back of non-smooth surface blade
Under the conditions of Q = 50 and 60 m 3 /h, the distribution of volume concentration of the principal phase and the particle phase on the back of the non-smooth surface blade is shown in Figure 12. From Figure 12, it can be found that in the middle part of the blade inlet, a region of high-volume concentration of solid-phase particles can be observed, which will aggravate blade wear. This might be related to the type of blade profile. When the solid–liquid two-phase fluid flows in the impeller runner, solid-phase particles of the flow layer near the blade wall are deposited in the pits, the volume concentration of the principal phase is relatively low while the concentration of particle phase is relatively high in the interior of the pit-type non-smooth unit.
The velocity vector of solid-phase particles flowing in the pits is presented in Figure 13. It can be observed from Figure 13 that the solid-phase particles in the pits along with the principal phase form reverse flow vortex. When the fluid flows downstream along the wall and flows through the wall surface from the upper pits but not along the interior wall surface in the pit region, the rotation fluid inside the pit might generate double effects. First, the rotation fluid inside the pits causes the liquid–liquid contact between the fluid inside and outside the pit thereby producing vortex cushion effect, which may influence the non-pit area in the pit downstream. The generation of vortex cushion effect can be attributed to the rotation fluid inside the pit, which plays a role to the “rolling bearing” similarly. It makes the incoming flow on the vortex and rules out the possibility of direct contact with the wall of the pit; therefore, the friction resistance and energy loss between the fluid and the wall are reduced. Second, the frictional resistance at the bottom of the pit generated by the reverse fluid inside the pit is opposite to the direction of incoming flow, and the friction resistance generates promotion effect as a kind of additional power at the bottom of the pit. Moreover, the formation of vortex hinders the sweep movement of the upper high-speed fluid and maintains a low velocity layer on the pit surface of blade, in which lower momentum exchange and velocity fluctuations reduce the resistance effect on the solid wall. The development of vortex restrains the intensity of the streamwise vortex near the wall of the impeller blade, reduces the energy of the high-speed streamwise vortex, weakens the ability of the streamwise vortex to lift the low-speed fluid at the bottom, weakens the intensity of sudden turbulence at the source and the momentum exchange between the extension and the normal direction, and then realizes the purpose of reducing the friction resistance of the turbulent flow near the wall of the blade.

The velocity vector chart of the flow of particle phase inside the pit: (a) the flow of particle phase inside the pit and (b) locally enlarged drawing.
Experimental study
The impeller in this article is rapidly shaped by three-dimensional (3D) printing technology, and the impeller model after multiple treatments has a certain strength, which can meet the experimental strength requirements. The 3D printing forming impeller is shown in Figure 14.

3D printing forming impeller: (a) impeller and (b) remodeled blade.
The experimental data of the model pump, the experimental data of the non-smooth surface centrifugal pump, and the numerical simulation results are compared and analyzed. As shown in Figure 15, the experimental values of the original model and the impeller experimental values of the centrifugal pump with non-smooth surface were basically consistent with the variation trend of the numerical simulation values of the non-smooth surface centrifugal pump. The head difference varied within the range of 0.5–1 m and the error was about 3%. Figure 16 shows the torque monitoring results of centrifugal pump impeller at different flow rates. As can be seen from Figure 16, under different flow rates, the monitored values of non-smooth surface centrifugal pump impeller torque are all lower than the monitored values of the original model torque, and under the design flow rate, the monitored values of the non-smooth surface centrifugal pump impeller torque are about 3.5% lower than the monitored values of the original model torque. Figure 17 curves for the centrifugal pump efficiency under different flow rates experiment result. The Figure 17 shows that when the flow is less than the design flow, the efficiency of centrifugal pump basic did not change. However, with the increase in flow rate, the smooth surface to exert better drag reduction, resistance to wear, and improving the efficiency of centrifugal pump under the design discharge efficiency increases by about 1.5%, and the centrifugal pump efficiency increased by about 1.8%. This also verifies the conclusion of the numerical simulation that the non-smooth surface can only show good drag reduction effect at large flow rate.

Head contrast curves.

Comparison curves of impeller torque.

Centrifugal pump efficiency comparison curve.
Conclusion
Under different volume concentrations of solid-phase particles, the head of centrifugal pump shows a downward trend with the increase of the flow. When the flow rate of the centrifugal pump is the same, the higher the volume concentration of solid-phase particles is, the lower the head and efficiency of centrifugal pump are.
With the increase of the volume concentration of solid-phase particles, the non-uniformly distributed solid-phase particles tend to accumulate on the working surface of the blade and the inner wall of the volute. When the non-smooth blade is adopted, the solid-phase particles deposited inside the pit form the vortex opposite to the main flow, which can effectively reduce the friction resistance and the energy loss between the fluid and the wall surface.
Under the same volume concentration of solid-phase particles, the shear stress on non-smooth surface generated by solid-phase particles is generally less than that on smooth surface. With the increase of the flow, the non-smooth surface shows better effect of reducing shear stress, which can effectively improve the head and efficiency of the centrifugal pump.
The experimental data of the model pump, the experimental data of the non-smooth surface centrifugal pump, and the numerical simulation results were compared. Although there was a certain degree of deviation between the simulation results and the experimental results, they were all within the acceptable range, which also verified the accuracy and reference value of the numerical simulation.
Footnotes
Appendix 1
Handling Editor: Xiaoxiao Han
Declaration of conflicting interest
The author(s) declared no potential conflicts of interest with respect to the research, authorship, and/or publication of this article.
Funding
The author(s) disclosed receipt of the following financial support for the research, authorship, and/or publication of this article: The research work described in this paper was supported by the Zhejiang Provincial Natural Science Foundation of China (LY19E050003), the National Natural Science Foundation of China (51779226), and the Public Welfare Technology Application Projects of Zhejiang Province (2017C31025).