
Abstract
An innovative cable laying vessel for the grid connecting project of Zhoushan Island was designed and has been constructed. The stability of the vessel under the complex sea conditions is extremely important to the cable laying operations. Experimental and numerical studies are carried out in this study to investigate the stability performance of the mooring system designed for maintaining the position of the vessel. The experiments were conducted in a wave tank under the scale ratio of 1:49, and the motions in 6 degrees of freedom of the vessel model were measured together with the tension forces of the mooring lines, which can be utilized for the numerical model validation. More environmental hydrodynamic conditions were employed for further study numerically to justify the stability of the vessel under the complex operating conditions.
Keywords
Introduction
Zhoushan Archipelago is the largest archipelago of China which occupies over 20% of islands in China. The population of Zhoushan City is over 1.1 million. Zhoushan Archipelago is also one of the most rapid economic development areas in China, which proposes the huge demands for the electricity supply. Since there are no power plants on the islands, all the electricity has to be transmitted from the mainland. According to the power planning, three new 500-kV submarine photoelectric cables need to be deployed in the future. A cable laying vessel (CLV) was designed and built for deploying 500-kV cable, which is under construction now. The vessel stability under the operating sea conditions is extremely important for the cable laying execution to ensure that the cable loading fits the design routing.
The dynamic behaviors of the vessel or offshore platform and the effects of the mooring system on the stability under different wave conditions have been analytically investigated first. Responses of an articulated loading platform in irregular waves were studied both in frequency and time domains. 1 The energy absorption of a mooring system from an offshore platform as a result of its motion was studied parametrically based on a nonlinear mooring dynamics simulation. 2 The experimental and theoretical investigations on the dynamic behaviors of pontoon-type floating breakwaters were carried out, where the stiffness coefficients of the slacking mooring lines were idealized as the linear ones. 3 The rolling damping of a long floating structure such as ships and barges was computed by the linear diffraction/radiation theory. 4 Differences in numerical estimations introduced by various levels of approximations in the formulation of sea loads on ships were evaluated. 5 The trust capacity of an anchor handling vessel during the anchor deployment was studied in a deep water situation when high external forces are expected. In addition, the dynamic behavior and stability of anchor handling vessels during anchor deployment were investigated numerically.6–8
Experimental studies in the wave tank/flume can provide reliable and valuable data for the further numerical studies and were carried out less because of its high costs. Nonlinear effects on the statistics of vertical motions and loads of a containership in irregular waves were studied experimentally. 9 Wave-induced load effects of open ships in oblique seas were tested in the towing tank and ocean basin, and the results can be used as a benchmark for the numerical validations. 10 The hydrodynamic performance of a quay-moored jackup was investigated using a set of wave basin model tests to test the safety of the offshore platforms under construction moored along the quayside. 11 At present, the computational fluid dynamics (CFD) and related codes or software are more popular. The linear ship response of a ship subjected to synchronous beam waves was evaluated numerically using strip theory. 12 The dynamic stability of a typical offshore service vessel operating under stability critical operating conditions was investigated. 13 Nonlinear dynamic analysis of a spar platform configured as a single fully coupled integrated model in ABAQUS AQUA was performed numerically in time domain. 14 The campaign response of the small oil tanker and the offshore platform in the real sea conditions was analyzed using AQWA software.15,16 The characteristics of a combination mooring system composed of chain, clump, and elastic cables on the floating body were studied using AQWA. 17 Effects of wind and current loads to the fatigue damage of FDPSO mooring system were investigated in simulations of AQWA. 18 A coupled numerical analysis has been carried out for the structural responses and motion behavior of a classical spar structure subjected to irregular waves represented by JONSWAP spectrum. 19 It can be seen that the commercial software ANSYS AQWA has dominated in the application of the dynamic response of the mooring system for the ships and platforms.
In this study, experimental and three-dimensional (3D) numerical studies based on the commercial software ANSYS AQWA on the dynamic response performance of the mooring system to the CLV are carried out. The regular and irregular wave conditions are employed for the wave basin tests. Furthermore, the wind, current, and wave conditions are considered in the numerical studies. The brief introduction of the vessel is described in section “Qifan No. 9 CLV,” followed, in section “Experimental study” by the introduction of experimental setup and testing results with detailed analysis. Numerical models are introduced in section “Numerical study” with the simulated predictions. Conclusions are drawn and the future works are proposed in section “Conclusion.”
Qifan No. 9 CLV
The new-designed CLV “Qifan No. 9,” as shown in Figure 1, has been under construction since September 2017. The vessel is owned by Zhejiang Qiming Electric Power Group Co., Ltd. Qifan No. 9 is the first vessel which can carry and lay 5000 t submarine cables for large distances in China.

Qifan No. 9 cable laying vessel.
The length, molded breadth, and depth of the vessel are 99, 32, and 6.5 m, respectively. The maximum draft is 4.8 m. The vessel is installed with the dynamic positioning assistant system, modeled as the DP-1, with winches locating around the deck for precise positioning during the cable laying operation. The anchoring function is mainly realized by the mooring system with the slack lines. The laying, connecting, and untwisting operations of the cable can all be finished with high level of automation on this vessel.
For the laying operation, the cables are sent out on the deck horizontally. The cabling system includes the cable reel, cable bridge, rollers, cable laying machine, cable entry gutter, and assistant winches. The cable connecting is carried out at the stern. The purified room, cable guideway, cable pulling device, and leading truck are utilized for this operation. The connecting operation proposes an extremely high demand for the dynamic stability of the vessel. In addition, the rolling angle along and against the vessel hull should not exceed 15°.
Experimental study
Experimental apparatus
A simplified model of CLV is investigated in this study, and the schematic of the model is shown in Figure 2. The Cartesian coordinate over the CLV model is defined in Figure 2(a). The model is made of wood and pained with the water-proof coatings, as shown in Figure 2(b). All the experiments are carried out in the wave basin at Shandong Provincial Key Laboratory of Ocean Engineering, Ocean University of China (OUC). The inner compartments of the model are filled with sand, and the cement clumps are used to adjust the center of gravity and the draft. According to the size of the CLV, the equipment capability of the basin, and the testing environmental conditions, the model scale is set to 1:49, and the primary parameters of the CLV and its model are listed in Table 1.

Experimental model of CLV: (a) Cartesian coordinate and (b) physical model.
Primary parameters of the prototype and model for the CLV.

CLV: cable laying vessel.
The dynamic response performance of the CLV can be represented as the motions in 6 degrees of freedom (DOFs) of the vessel and the tension forces of the mooring lines. The model motions in 6 DOFs are measured by the Optotrak® Certus™/3D Investigator produced by NDI Ltd, as shown in Figure 3. The investigator is non-contact type, and it uses the infrared measuring technology. The identification points can be attached to the proper positions on the CLV model, which emit infrared signals. The positioning sensors in the investigator can capture the signals to identify the precise space information of the above points. Consequently, the 3D coordinate values and the motion data of the CLV model in 6 DOFs could be derived. The size of the observation window is 4.2 m × 3.0 m as the investigator is 7.0 m away from the model. The accuracy of the investigator is 0.1 mm with a highest sampling frequency of 4600 Hz.

3D Investigator for the measurement of the motions in 6 DOFs.
The tension forces of the mooring lines are measured by the micro-tension sensor (model: ZNLBM-1, produced by Bengbu Zhongnuo Sensor Co. Ltd), as illustrated in Figure 4. The metal foil strain wafer is attached to the alloy steel elastomer to measure the force variation. The sensors are all water-proof and are connected to the steel wire ropes through the springs. The full scale (FS) of the tension sensor is 100 N, and its accuracy is ±0.1% of FS.

Tension sensor.
Experimental setup and procedures
The deployment of the CLV model in the wave basin is shown in Figure 5. The positive direction of the x-axis for the model is parallel to that of the propagating waves from the wave maker at one end of the basin. The model is 35 m away from the wave maker to ensure the full development of incident waves. The 3D Investigator is put on one side of the model. The mooring system contains eight steel wire ropes with even distribution style. Two angles of α and β for two pairs of ropes at one corner are defined as in Figure 5. The other three pairs follow this distribution style symmetrically. The floating physical model in the wave basin is illustrated in Figure 6, and the instrument chain is shown in Figure 7.

Deployment of the CLV model and the measuring instrument in the wave basin.

Physical model of CLV in the wave basin.

Instrument chain for data measurement and processing.
Experimental results and discussion
In the experimental tests, both the regular and irregular waves are employed. The water depth is fixed as 1.0 m. For the regular wave conditions, the wave height is Hmr = 5 cm and the wave period Tmr varies from 1.5, 1.75 to 2.0 s. For the irregular wave condition, the significant wave height Hmi = 4.2 cm and the wave period is Tmi = 1.43 s. As the model is deployed as shown in Figure 6, its settle angle is defined as γ = 0°. When the model hull line is normal to the incident wave direction, the settle angle is γ = 90°. The mooring lines, as illustrated in Figure 5, have two distribution plans: mooring plan (MP)-A for α = 10° and β = 40°; MP-B for α = 16.6° and β = 36.7°.
The amplitudes of translation and rotation motions in 6 DOFs under regular wave conditions for γ of 0° and 90° are shown in Figures 8 and 9, respectively. Various regular wave periods are represented by the dimensionless parameter of λ/L, where λ is the wave length and L is the molded length of CLV. It can be seen that the tested regular-wave periods have limited effects on the motion amplitudes for both two values of the model settle angle. For the translation motion, the heaving amplitude has a little change for different settle angles, which is approximately around 2 cm. For γ = 0°, the surging amplitude is larger than that of the swaying motion. On the contrary, the swaying amplitude is larger than that of the surging for γ = 90°. Under this condition, the CLV suffers a smaller wave force because of a smaller surface area on the direction of the propagation waves. Subsequently, the CLV generates smaller amplitudes of the motions. Obviously, the motion is higher on the direction perpendicular to the incoming waves. The amplitudes of the rotation motions for most cases are smaller than 3° expect for the yawing motion whose value is approximately 5°. Generally, the amplitudes of translation and rotation motions of the CLV model are very limited under the operational wave conditions.

Motion amplitudes in 6 DOFs under regular wave conditions for γ = 0°: (a) translation motion and (b) rotation motion.
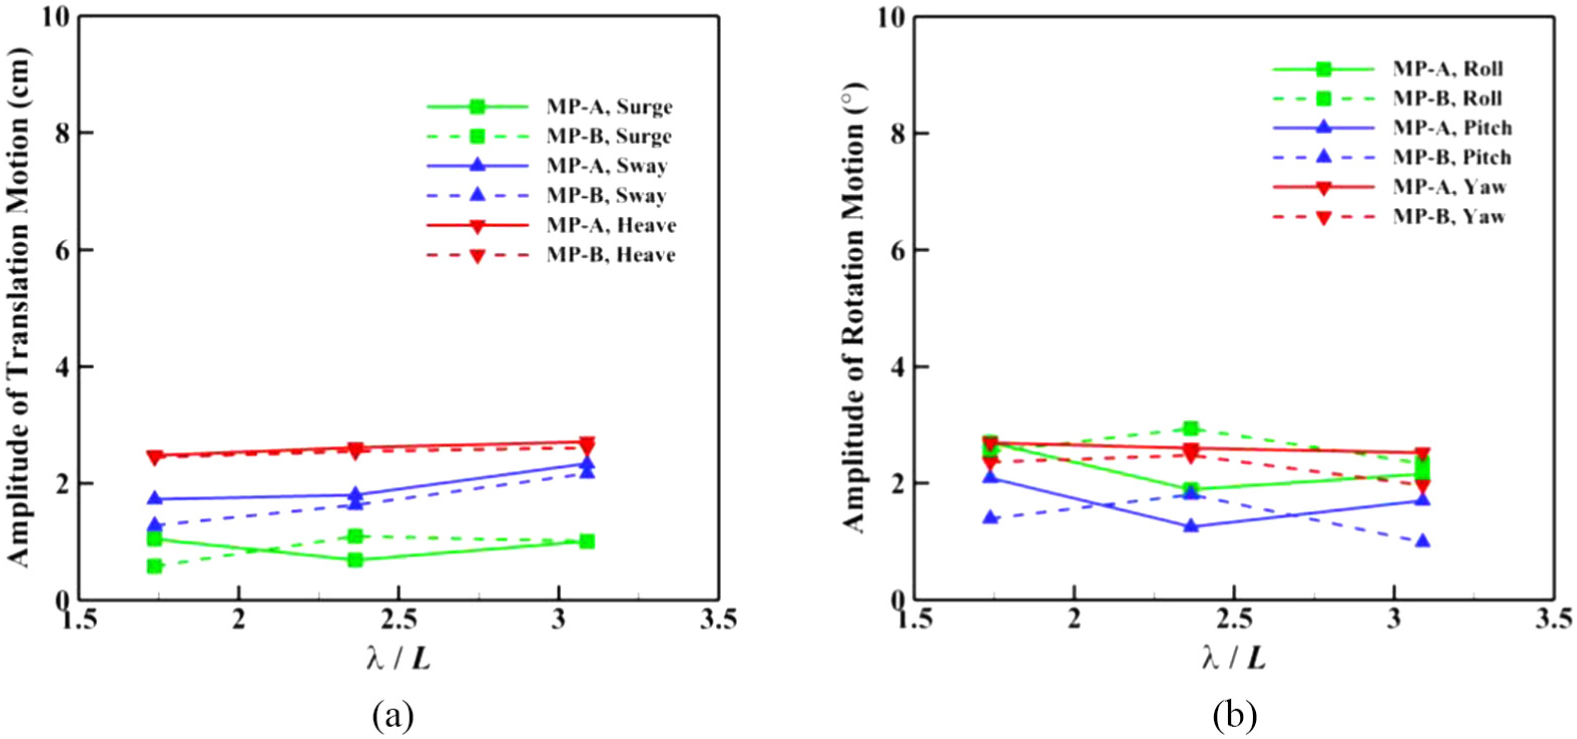
Motion amplitudes in 6 DOFs under regular wave conditions for γ = 90°: (a) translation motion and (b) rotation motion.
Tension force amplitudes on eight mooring lines under the regular wave condition for two settle angles are shown in Figures 10 and 11. All the tension forces on various mooring lines for both the mooring plans are all less than 5 N. Furthermore, the tension forces for four mooring lines facing the incoming waves are larger than those for the other four lines, where Lines 3, 4, 5, and 6 are for γ = 0° and Lines 1, 2, 3, and 4 are for γ = 90°, which is also caused by a smaller surface area of the CLV for γ = 0° on the direction of the incident waves. Anyway, the differences are not so great. The prototype values of the tensions derived from the model test also satisfy corresponding Chinese standards.

Tension force amplitudes on mooring lines under regular wave condition for γ = 0°: (a) Tmr = 1.5 s, (b) Tmr = 1.75 s, and (c) Tmr = 2.0 s.

Tension force amplitudes on mooring lines under regular wave condition for γ = 90°: (a) Tmr = 1.5 s, (b) Tmr = 1.75 s, and (c) Tmr = 2.0 s.
Figure 12 presents the averaged and maximum amplitude of the motions in 6 DOFs under the irregular wave condition, respectively. For the averaged amplitudes of the motions in Figure 12(a), the combination of MP-A and the settle angle of γ = 90° results in the largest values in 4 DOFs, whereas the combination of MP-A and γ = 0° generates the largest translational motion. In addition, in Figure 12(b), the maximum values of the motions are also found to be generated in the combination of MP-A and γ = 90°, and the settle angle of γ = 0° shows a better performance for both mooring plans.

Motions in 6 DOFs under the irregular wave condition: (a) averaged and (b) maximum.
The tension forces for two mooring plans and two settle angles under the irregular wave condition are illustrated in Figure 13. The averaged tension forces for both settle angles, in Figure 13(a) and (c), are similar where the largest averaged tensions are found to act on Line 1, which is on the far end to the incident wave direction. The maximum values of the tension force, in Figure 13(b) and (d), are achieved in Line 4 for γ = 0° and in Lines 1 and 3 for γ = 90°, respectively. Generally, the combination of MP-A and γ = 90° shows the worst mooring performance, whereas a better performance can be observed for MP-B and γ = 0°.

Tensions under the irregular wave condition: (a) averaged, γ = 0°; (b) maximum, γ = 0°; (c) averaged, γ = 90°; and (d) maximum, γ = 90°.
Numerical study
Numerical model and validation
The numerical studies were all carried out in the commercial CFD software ANSYS AQWA. The finite element model of the CLV was established in ANSYS MAPDL, where the shell unit Shell63 was applied to the hull as shown in Figure 14. In the validation calculation, the model size is totally same to that of the experimental CLV model tested in the wave tank. In the prototype calculations, the numerical simulation employs a full-size model of CLV. The maximum grid length of the quadrilateral meshes in the computation domain was set to 1.0 m, and the grids were refined where the intense fluid–structure interactions appear. There are approximately 5400 cells. The cable is modeled as the catenary in the numerical model, and the physical properties of the cable has been input as the material details in the model. After the calculations in the frequency domain were finished, the results would be post-processed by the AQWA AGS. In the time-domain calculations, after finishing the setups of environmental parameters and mooring points, the time-step is set to be 0.1 s for further simulations to derive the motions of the CLV model and tension forces acting on the mooring lines.

Numerical model of CLV in ANSYS AQWA.
The numerical model is based on the 3D potential flow theory, and the fluid is assumed to be uniform, incompressible, non-viscous, and irrotational. The velocity potential can be decomposed into incident, diffraction, and radiation parts. All the velocity potentials satisfy the Laplace equations and coupled with free surface, body surface, and sea bottom conditions. As the total wave potentials and surface pressure are solved using the known incident wave potential, the wave loads on the body can be calculated further. The wind and current loads are both calculated based on the API standard. The details of the governing equations can be referred in our previous work.20,21
Since the waves play a dominant role in the hydrodynamics of CLV, the experimental data derived from the wave basin tests are used to compare with the numerical predictions for validation. The comparisons between numerical and experimental results under regular wave conditions are shown in Figure 15. The origin of the numerical CLV model is same as the experimental one shown in Figure 2(a). Measurement points for 6 DOFs of the CLV are the center of mass. The testing conditions include: MP-B, γ = 90°, Hmr = 5 cm, and Tmr = 1.5 s. It can be seen in Figure 15(a)–(c) that the numerical model can predict the sinusoidal variations of both translational and rotational motions. The simulated varying period and amplitudes both agree well with experimental data for the heave and roll motions. There are no obvious phase differences, and the amplitude errors are both less than 5.0%. In addition, comparing to the experimental results, the numerical model underestimates the varying amplitude of yaw motion, and the error is approximately 9.0%. For the tension forces in Figure 15(d), the numerical results are slightly more uniform and the amplitude is approximately 7.0% less than those in the experiments.

Validation of numerical predictions for a regular wave condition: (a) translational motion, (b) rotational motion (roll), (c) rotational motion (yaw), and (d) tension.
Furthermore, the comparison between the numerical and experimental results of the averaged motions and tensions of the CLV model under the irregular wave condition is shown in Figure 16. In Figure 16(a), the errors of the motions for 3 typical DOFs are all less than 9.5%. In addition, in Figure 16(b), the averaged error for the tensions acting on all eight mooring lines is up to 15.7%. It may be caused by the idealized setup in the numerical model, which induces an overestimation of the tension on most mooring lines. Generally, the numerical model has demonstrated its capability on the complicated fluid–structure interaction between the CLV model with mooring lines and incident waves, which can be utilized for further investigations.

Validation of numerical predictions for the irregular wave condition: (a) motions and (b) tensions.
CLV performance on the joint effects of wave, wind, and current
To evaluate the dynamic performance of the CLV in the environmental conditions more close to the actual sea conditions, the joint effects of local wave, wind, and current were numerically studied. The basic vessel deploying scheme is the combination of MP-B and γ = 0°, which achieves the best dynamic response and tension performance in the experimental study. According to the measured data, the maximum month-averaged values of the wind and tidal current speeds are 20.7 and 2.6 m/s, respectively. The angle between the main directions of the incident waves and winds is 45°, and the angle for the tidal current is 23°. A more extreme environmental hydrodynamic condition is considered further to predict a possibly dangerous situation occurring during the cable laying operation, when the incident directions of the wave, wind, and tidal current are assumed to be same. The directions of wave, wind, and current with the head of the CLV for these two layout plans are illustrated in Figure 17. Four averaged periods Tpi were employed for the irregular waves: 7, 8, 9, and 10 s. The significant wave height is Hpi = 2.0 m.

Layout plans with directions of wave, current, wind, and head of the CLV.
The motions of the CLV and tensions acting on the mooring lines under the joint actions of the irregular wave, wind, and tidal current condition are presented in Figures 18 and 19, respectively. For the averaged values of the motion, it can be seen from Figure 18(a) that the surges are the largest translational motion, and its value decreases with the increase in the incident wave period because of the smaller torques generated by the transverse forces derived from the wind and current. It indicates, compared with the waves, that the wind and current have limited effects on the motion of the CLV. The heave motion is significantly larger than the sway motion, and the effects of the wave period are quite minor because the heaving is mainly influenced by the wave height. For the rotational motion, only the pitches can be observed. For the maximum values in Figure 18(b), the surge and the pitch still contribute largest values in the translational and rotational motions, where the largest values for the surge and pitch are achieved at 11.1 cm and 3.2° for Tpi = 7.0 s and Tpi = 9.0 s, respectively. These results indicate that the irregular waves play a dominant role even though the waves, the winds, and the tidal currents are from different directions.

Motion amplitudes in 6 DOFs under joint effects of irregular wave, wind, and current from different directions: (a) averaged and (b) maximum.

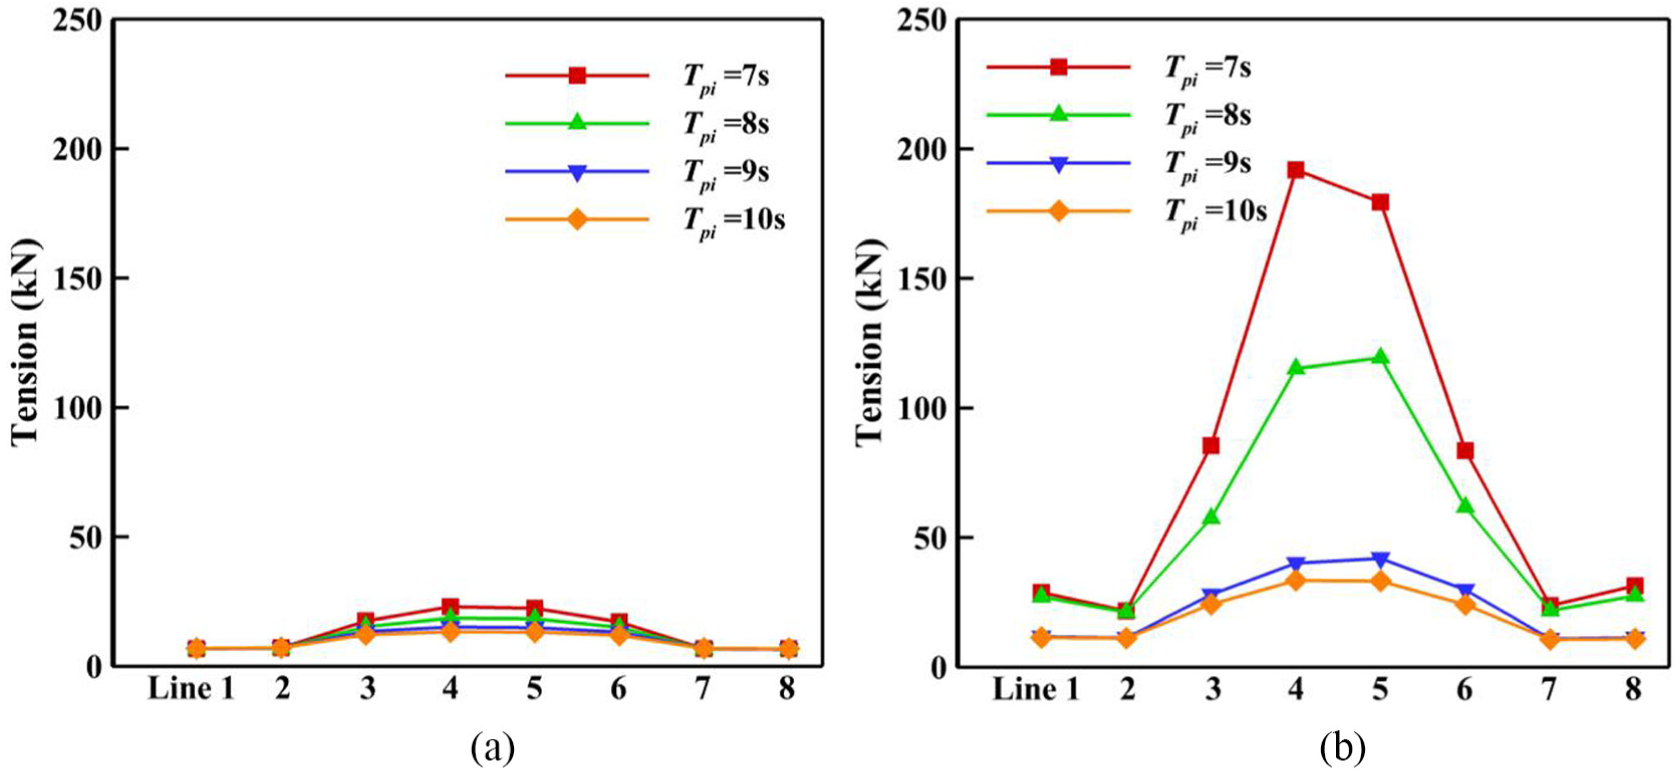
Amplitudes of tensions acting on eight mooring lines under joint effects of irregular wave, wind, and current from different directions: (a) averaged and (b) maximum.
The general distribution pattern of the averaged and maximum tensions is illustrated in Figure 19. The tensions on four lines facing the incident waves are obviously larger than those on the rear sides. It is because that the mooring lines at the incident-wave side mainly suffer the external wave forces, and Lines 4 and 5 suffer more longitudinal tensions, which can be reflected on the averaged and maximum forces among the mooring lines. For the averaged values in Figure 19(a), the tensions have very minor differences for various periods on the rear side, which increase as the period decreases for four mooring lines on the front side. Since the waves with smaller periods make the CLV to generate the motions with larger amplitudes and suffer larger tensions, the increasing for the smaller periods is quite significant in Figure 19(b). The maximum tensions on Lines 4 and 5 for Tpi = 7.0 s are 4.7 and 4.4 times larger than those for Tpi = 10.0 s, respectively.
The motions and tensions under the joint effects of irregular wave, wind, and current from the same direction are shown in Figures 20 and 21, respectively. It can be seen that the current and wind only have an obvious effect on the averaged surge for Tpi = 7.0 s, which has been reduced because of the constant actions from the wind and tidal on this direction. The other results indicate that the wind and tidal current have very limited effects on the vessel dynamic response and tensions on the mooring lines no matter where they incident from because the wind and current forces are significantly smaller than the wave forces.

Motion amplitudes in 6 DOFs under joint effects of irregular wave, wind, and current from the same direction: (a) averaged and (b) maximum.
Amplitudes of tensions acting on eight mooring lines under joint effects of irregular wave, wind, and current from the same direction: (a) averaged and (b) maximum.
Conclusion
A newly built CLV was presented in this study. In order to investigate its dynamic response performance under the operational environmental conditions, both experimental and numerical studies were carried out.
A CLV model was manufactured and tested in the wave basin under regular and irregular wave conditions. Eight mooring lines were used and designed for two mooring plans. It was found that the combination of MP-B and γ = 0° shows the best dynamic response performance in the model scale. A numerical model of the prototype CLV model was established based on the CFD software ANSYS AQWA, which was validated by experimental data. The joint effects of irregular waves, winds, and tidal currents from different directions were also considered. The results indicate that the irregular waves play a dominant role in the vessel motion and tension acting on the mooring lines, which should be paid most attention during the future design and operations.
Footnotes
Handling Editor: James Baldwin
Declaration of conflicting interests
The author(s) declared no potential conflicts of interest with respect to the research, authorship, and/or publication of this article.
Funding
The author(s) disclosed receipt of the following financial support for the research, authorship, and/or publication of this article: The research was financially supported by the Science and Technology Project of State Grid, China (grant no. 52110417000N).