
Abstract
This study improved the roundness error of the side portion of a lead wire produced by rolling operations. In the conventional method, the side portion is cut after rolling. As an improvement, a side roller was designed for use after flat rolling to directly form the side portion of the lead wire to reduce the roundness error. A rolling analysis of lead wires was performed using LS-DYNA, which is a simulation program capable of analyzing the dynamic behavior of the material. Finite element modeling of the lead wire was carried out, and the change of the cross section was observed after the wire rolling process. The shape of the side roller was optimized to reduce the roundness error. The angle of the side roller, the installation position, and the shape radius were selected as the design variables. PIAnO (Process Integration, Automation, and Optimization), a commercial PIDO (Process Integration and Design Optimization) tool, was used for the optimum design of the side roller, and the results confirmed that the roundness error was reduced.
Introduction
The demand for high-quality fibers such as functional fibers and micro-fibers is increasing. As a result, the demand for flat wires with a round shape of the side portion is greatly increasing compared to conventional lead wires. Thus, the curvature of the side portion is important. The conventional method for manufacturing a lead wire with round sides is to cut the side part after flattening the wire. However, this method does not improve the sides of the wire to obtain a round shape. The poor manufacturing environment of lead wires has dust, noise, and smoke due to metal cutting, so a processing method is needed to improve the production process. Therefore, in this study, the cutting process was removed, and a side roller was designed to directly form the side shape of the lead wire. The side roller was designed to make the side portion round during the cold rolling process.1–4
Figure 1 shows the five-step continuous process for obtaining the lead wire. The payoff reel on the left serves to release the lead wire, which passes through the roll. The tension-capstan maintains the tension of the material to prevent warping or twisting. Finally, the winder winds the modified lead wire. In order to minimize the roundness error of the side of the lead wire, a side roller was added, as shown in Figure 2.
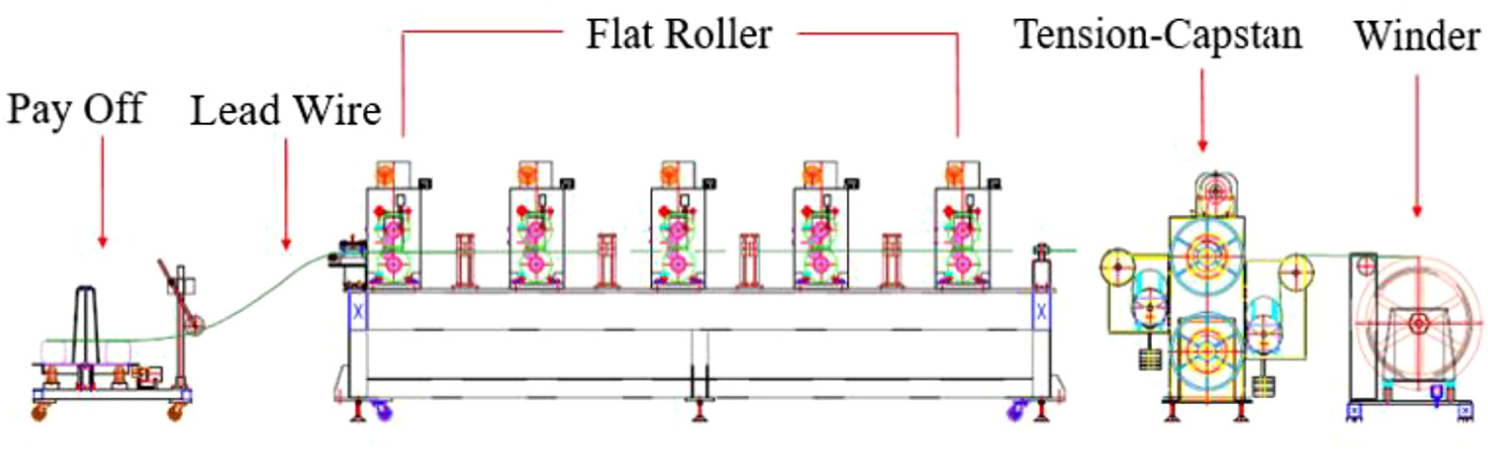
Continuous rolling pre-process line.

The cross section of a side roller.
Figure 3 shows a diagram of flat wire drawing, which shows the lead wires passing between the upper and lower rollers in a straight direction (Z-axis direction).5–8 Figure 4 shows the roller and lead wire from the direction opposite to the straight line of the lead wire. The distance between the upper and lower rollers is defined as the roll gap. The lead wire is subjected to compressive load while passing between the rollers. The deformation of the thickness is reduced, and the shape of the cross section is changed. Figure 5 shows a diagram of the side roller and auxiliary roller. The auxiliary roller is designed to maintain the direction when the lead wire is rolled in the straight direction (Z). When the lead wire passes through the side roller at a fixed position, the side roller rotates about the center in the Y-axis direction to form the side portion of the wire.

The direction of straightness of the wire and the rolling components.

Definition of the roll gap.

Side roller and auxiliary roller.
Rolling was simulated using LS-DYNA, which is a program capable of analyzing the dynamic material behavior.9–12 Optimum design was carried out to minimize the roundness error of the lead wire using PIAnO (Process Integration, Automation, and Optimization), which is a common tool for PIDO (Process Integration and Design Optimization). For the optimum design, the distance from the center of the lead wire to the side roller was selected as a design variable, and the roundness error of the side of the lead wire after the rolling simulation was selected as the objective function.
Design target
Finite element model selection and boundary condition
The size and number of grids should be selected for the model. The results of the simulation depend on the size and number of grids. In order to improve the accuracy of the simulation results, the size of the mesh is reduced, the number of meshes is increased, and the user must select the appropriate values. The rolling process was carried out using a one-quarter model and applying symmetric conditions. The analysis was performed using a quadratic element because the deformation that occurs during rolling of the lead wire is nonlinear.
Figure 6 shows the method of modeling a whole lead wire under symmetric conditions. The size of the object was reduced by applying symmetry in the directions of the Y- and X-axis in the order of the green part in the figure. Figure 7 shows the symmetric division into three equal parts vertically and horizontally based on the center of the finite element model of the lead wire. The size of the grid was reduced, and the number of grids was increased by dividing it into four parts vertically and five parts horizontally. As shown by the red dotted line of Figure 5, half of the upper and left side rollers were modelled by removing the lower roller on the X-axis and removing half of the upper roller about the Y-axis. The side roller is removed to the right about the Y-axis and the lower roller is removed around the X-axis. Finally, the modeling was performed as shown in Figure 8. In the rolling process, it was assumed that the deformation of the roller is not large, and the analysis time was shortened by treating it as a rigid body.
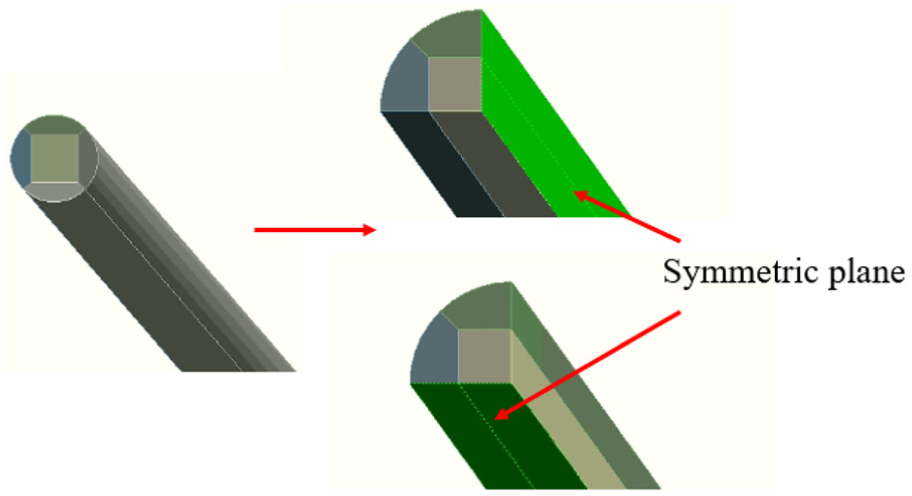
Symmetric conditions of the wire.

Lead wire with symmetry.

Rollers and lead wire with symmetrical conditions.
The lead wire used in the analysis had an initial diameter of 1.05 mm, and 430 stainless steel material was used in the actual rolling process. The material properties are shown in Table 1. The length of the lead wire in the Z-axis direction is several kilometers in the real world. However, modeling this length significantly increases the mesh count and the simulation analysis time. Therefore, the length was limited to 300 mm to shorten the analysis time. Even if the length of the model is limited, the inlet and outlet portions of the lead wire that deform heterogeneously are excluded from the analysis, so the analysis results are not affected.
Material properties.

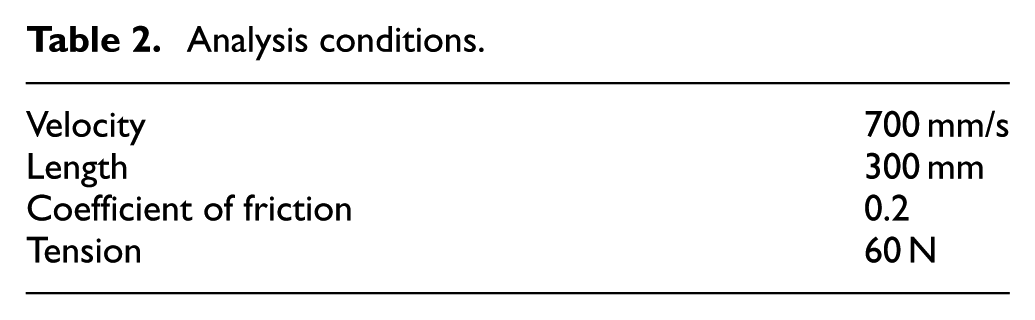
The moving speed of the wire was set to 700 mm/s. The coefficient of friction was selected to be 0.2 to produce the same process and conditions as the actual rolling. When the lead wire passes between the rollers, a tension of 60 N is applied to its surface to hold it so that it does not warp or twist during deformation (Table 2).
Analysis conditions.
Selection of the pass schedule
The pass schedule shows the order of the installed rollers through which the wire passes when it passes the roll.13–15 If the thickness reduction rate is large when the wire is straightened between the rollers, unbalanced plastic deformation may occur because the load acting on the wire is greatly affected. In order to solve this problem, several rolling processes are carried out. Table 3 shows the roll gaps, the distance between rollers, and the reduction rate of the thickness in the pass schedule. Six consecutive rolling operations were performed. As shown in Figure 9, the rolling simulation was performed through five flat rolling and side rolling processes. Table 3 shows the roll gap and the thickness reduction rate for the auxiliary roller and the sixth rolling.
Pass schedule.


Rolling process of the lead wire and roller modelled at the 1/4 size.
Roundness error measurement of the side part
Roundness error is the measure of how closely the shape of an object approaches that of a mathematically perfect circle.16–18 As shown in the last image of Figure 10, the roundness error of the semicircular shape of the side portion was measured when the lead wire was completely rolled. A radial method was used to determine the shape of the circular part theoretically by measuring the roundness error. This method was considered to be applicable to the section of the lead wire derived from the rolling simulation. As shown in Figure 11, the least-squares circle (LSC) method was used to obtain the roundness error. It is a circle which separates the roundness profile of an object by separating the sum of total areas of the inside and outside it in equal amounts. The roundness error can then be estimated as the difference between the maximum and minimum distances from this reference circle. Therefore, if
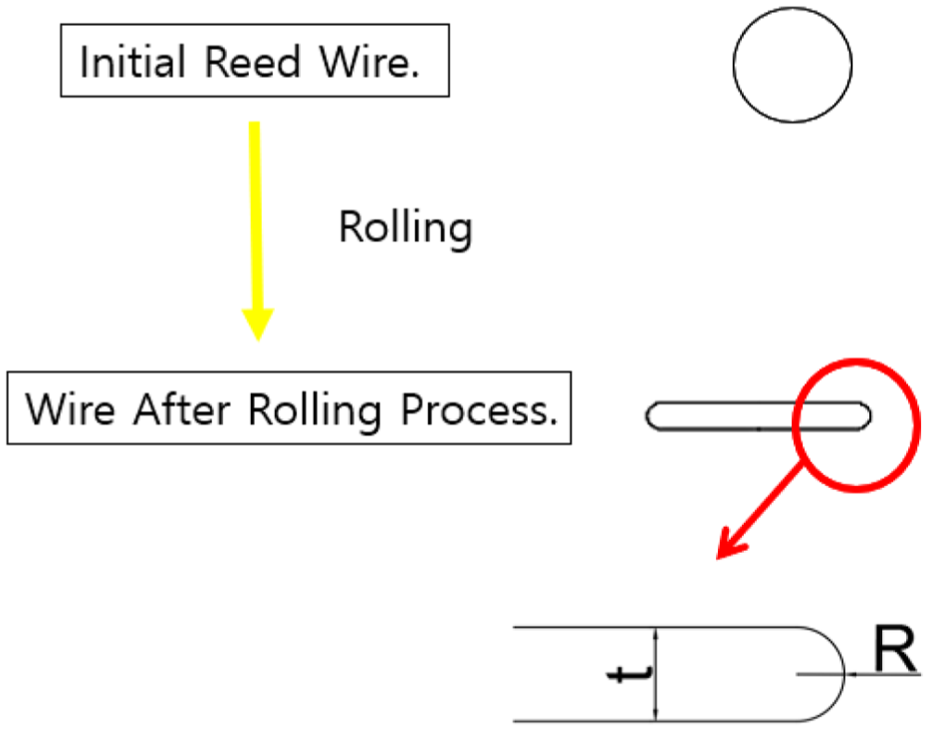
Initial shape of the lead wire and expected shape after rolling.

Least-squares circle.
Figure 12 shows the cross section of the lead wire after finishing the rolling simulation. The thickness t/2 of the lead wire was measured and the center of the mean circle at a point t/2 away from node1 was found. The wire section of Figure 12 is symmetrical in the horizontal and vertical directions. When the LSC is obtained from the measurement points (node1 to node5), the difference between the maximum distance and the minimum distance was selected as the roundness error.

The 1/4 size lead wire after rolling.
Formulation of the design problem
Design variables and objective function selection
In order to reduce the roundness error of the lead wire, a side roller was designed, and the side portion of the wire was directly molded. This changes the shape of the side portion depending on the shape of the side roller. The design variables were the distance from the center of the lead wire (Figure 13) to the side roller and the radius and angle of the side roller (Figure 14). As the side roller becomes closer to the center at the distance (the position of the side roller, X) from the center of the lead wire to the side roller, much deformation occurs at the side portion of the lead wire. However, there is not enough space for deformation, which causes distortion or cracking. Therefore, it is necessary to adjust the position of the side roller by measuring the width of the shape of the lead wire after the fifth round rolling.
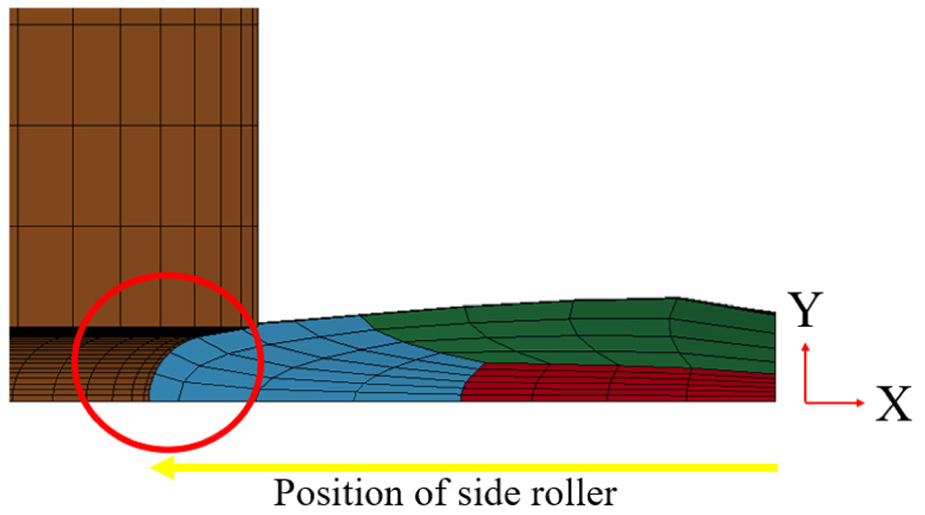
Definition of the position of the side rolling.
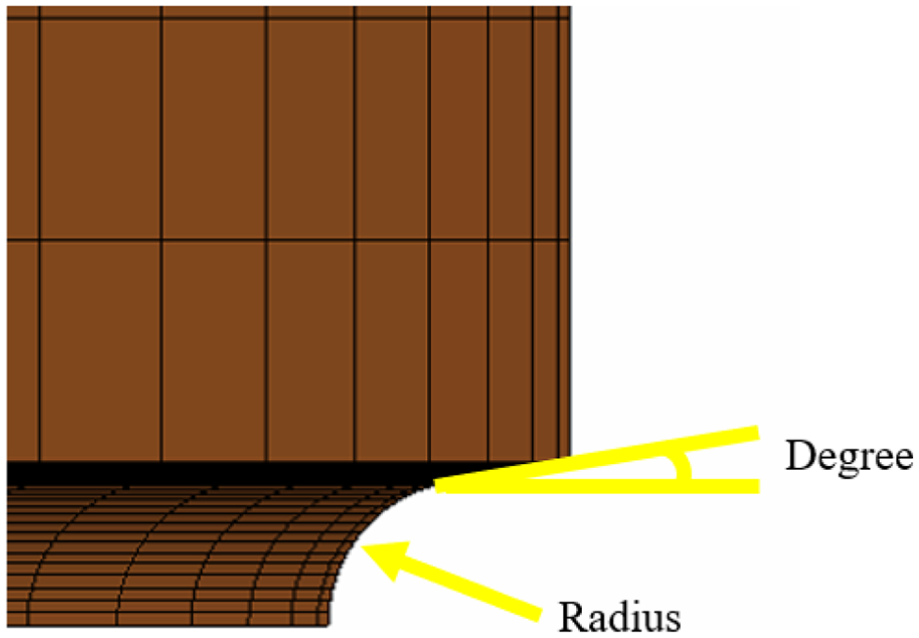
Radius and angle of the side roller selected as the design variables.
The radius and angle of the shape roller also influence the portion of the lead wire in contact with the roller. If the radius is too small, the side portion of the wire will be engaged with the side wire, and there will be insufficient space for the deformation. If it is too large, the wire will not be engaged with the deformation. Thus, the angle was selected as a variable because the side portion of the lead wire is deformed according to the shape of the side roller. The roundness error was selected as the objective function. As the roundness error becomes lower, the side portion becomes round, and thus a lead wire with excellent performance can be produced. Therefore, optimal design was performed to derive the result that minimizes the roundness error


Equations (1)–(3) show the design variables, objective function, and constraints, respectively. The design variables are X, R, and Degree, which represent the position of the side roller, the radius of the side roller, and the angle of the side roller shape, respectively. Constraints were designated for each design variable. The minimum and maximum values of the variables were selected by analyzing the shapes of the lead wires passing through the fifth flat rolling. The reason for this selection is that if the value of the variable is small, there will not be enough space for deformation to occur. If the value is too large, the side roller and the lead wire do not contact each other, so deformation does not occur.
The upper and lower boundary values and the initial values of the design parameters were selected as the constraints. Using the optimum design, we analyzed a case with the optimum value of each design variable. We started from an initial value that was obtained as the average of the maximum value and the minimum value (Table 4).
Lower limit, initial value, and upper limit of design variables.

Design of experiments
It is important to effectively distribute the test points in order to obtain more accurate results when conducting optimum design. We used an experimental design that can easily determine the impact of each variable in a design method to obtain optimal results within a short period of time. We selected an orthogonal array provided by PIAnO to achieve accurate results through an effective point distribution. We used the orthogonal array to obtain 18 experimental points by applying
Experimental points of design variables.

The approximation technique
The difference between maximum inscribed circle (MIC) and minimum circumscribed circle (MCC) is assumed to be roundness error. Positions of MIC and MCC are changed according to each experimental point. Accordingly, it is not predicted what kind of change will occur in the optimum design process if only the roundness error value is utilized in the approximate model of the optimization process. As a result, the probability of convergence to the local optimal point increases. To reduce the possibility of convergence to the local optimum, we performed the optimal design as follows. As shown in Figure 15, L1–L12 of optimum points and N1–N12 of measurement points are created, respectively. Since the measurement points are changed according to every analysis, the x and y coordinates of the measurement points are calculated in real time as an approximate model. Then, the distance between the measurement point and the optimum point is found. Then, the distances between L and N are calculated. After calculating the total of 12 distances, the roundness error was analyzed and the optimal design was performed to minimize the largest value among them. That is, the formulation of the objective function is called Minimize Max[D1, D2, D3, …, D12]. In this way, we predict the change of points and maintain consistency in obtaining MIC and MCC. In this study, an approximate model is created using five nodes as shown in Figure 13.

Measurement point and optimum point.
An approximate model was created using the Kriging method, which is among the various techniques supported by PIAnO. The Kriging technique consists of the sum of the global models and the regional deviations based on the information obtained from a computerized experimental design. 19 The advantage of the Kriging technique is that a nonlinear system is approximated, and there is no parameter that the user has to input. The deformation due to rolling of the lead wire has nonlinear characteristics due to elastic recovery.
The optimization techniques
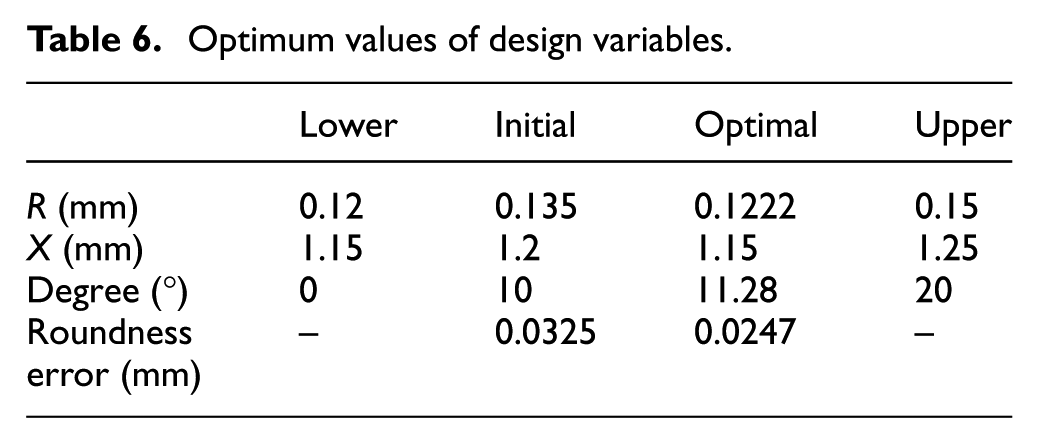
Optimal design was performed using an evolutionary algorithm by a generated approximate method. 20 An evolutionary algorithm is one of the optimization methods. This method generates the next population by generating a random variable within a certain range from a parent population derived through the approximation method. The process of determining whether the next population group generated converges closely to the objective function is repeated to determine the optimum design variable closest to the objective function. Figure 16 shows a flowchart of the evolutionary algorithm. The optimal values of the design variables obtained using the algorithm are shown in Table 6.

Flowchart of an evolutionary algorithm.
Optimum values of design variables.
The optimum design result
Figure 17 shows the result of the optimal design using the approximate model. The initial roundness error decreased by 31.57% from 0.0325 mm. In order to compare the optimum design result with the actual analysis result, we analyzed the behavior of the material using LS-DYNA. The lead wire analysis was performed with the values obtained using the optimum design. As a result of the analysis, the roundness error was 0.0223 mm and the result obtained by the optimum design had a 9.7% error.
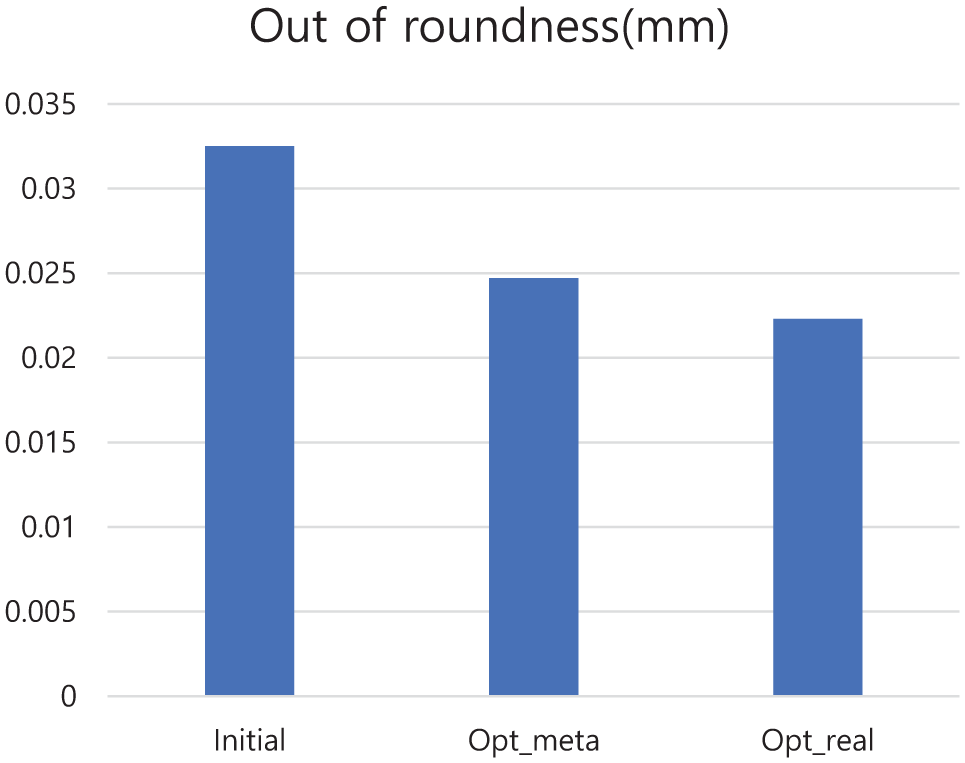
Comparison of roundness error values.
Conclusion
In this study, we carried out optimal design to minimize the roundness error of the side portion when rolling the lead wire. Finite element analysis was performed using LS-DYNA. The optimal design was accomplished through PIAnO. The experimental design method was completed by distributing 18 experimental points using an orthogonal array table, and a Kriging model was created by an approximation method. Next, we used an evolutionary algorithm as an optimization technique to derive the optimum value that minimizes the roundness error of the side of the lead wire.
The initial roundness error value was 0.0325 mm. The optimal roundness error value was 0.0247 mm, which is 31.576% lower than the initial value. In order to compare the optimum design results with the actual analysis results, the behavior of the material was analyzed by applying optimal design variables. As a result of the analysis, the roundness error was 0.0223 mm and the optimum design result had an error of 9.7%.
In order to produce the round lead wire, the side part was directly formed using a side roller, and the optimum design was used to design the side rolling to minimize the roundness error. As a result, the roundness error was improved.
Footnotes
Handling Editor: Yunn-Lin Hwang
Declaration of conflicting interests
The author(s) declared no potential conflicts of interest with respect to the research, authorship, and/or publication of this article.
Funding
The author(s) disclosed receipt of the following financial support for the research, authorship, and/or publication of this article: This research was supported by a Yeungnam University Research Grant in 2018.