
Abstract
The high temperature deformation behaviors of low-carbon steel QD08 were investigated by hot compression tests over temperatures from 1000°C to 1200°C and strain rates from 0.1 to 10 s−1. In order to describe the flow characteristics, a constitutive equation was developed and the relation between the flow stress and Zener–Hollomon parameter was successfully analyzed via the hyperbolic sine function under the whole range of deformation condition. It can be found that the critical strain
Keywords
Introduction
During hot forming processes, materials undergo a high-temperature, dynamic and transient process, and metal flow behaviors are very complex. The hardening and softening mechanisms are both significantly affected by the thermo-mechanical parameters, such as deformation degree, forming temperature and strain rate. 1 Generally, there are several types of microstructure evolution during hot deformation, such as dynamic recovery (DRV), dynamic recrystallization (DRX), static recovery (SRV), static recrystallization (SRX), metadynamic recrystallization (MDRX), grain growth, and phase transformation.2,3 In order to obtain the optimum hot working process, a good understanding of hot deformation behaviors, kinetics of metallurgical transformation and processing maps are very important for the designers of metal forming processes.
Low-carbon steels have been widely applied in automotive body parts, structural components of construction machinery and other aspects due to their relatively low cost and easy processing. Many industrial applications require the components that have proper microstructure, good mechanical properties and good dimensional stability. Knowing the deformation behavior of the materials is helpful to control the shape and the property of the products during and after hot working process. The hot deformation behavior is generally described by the relationship between the flow stress and the processing parameters (deformation temperature, strain rate and strain). Therefore, it is very necessary to investigate this relationship. In recent years, the processing maps based on dynamic materials model, which is developed by Prasad et al. 4 are being used to design hot working schedules and control microstructure for some typical low-carbon steels. Processing maps not only present the domains in which a decisive deformation mechanism of specific microstructure takes place, but also describe the instability regimes which should be avoided during hot working. Furthermore, optimal hot workability temperatures and strain rates are available through processing maps. Mutry et al. 5 optimized the hot working parameters for a low-carbon steel (0. 15 wt.% C) by the dynamic materials model. Also, Yang et al. 6 studied the processing parameters of a low-carbon bainitic steel based on the high-temperature flow behavior and microstructural evolution, and the optimum window for the hot deformation were identified as 930–980°C and 0.001–0.014 s−1 with peak efficiency of 41% and activation energy of 393.5 kJ/mol. Rajput et al.7,8 characterized the hot deformation behaviors of AISI1010 and low-carbon Ti-Nb microalloyed steel using constitutive equations and processing maps. Xiang et al.9,10 developed the processing map of Nb-V-Ti and Q690 low-carbon microalloyed steel by the dynamic materials model (DMM), and the relationship between microstructure and hot workability were investigated through microstructural observations. Yang et al. 11 studied the hot workability of a low-carbon steel containing 0.20 pct C by the hot isothermal compression testing, and solved the problems of residual stress, distortion and flow instability of components using the processing map combined with the finite element method (FEM) model. Kang et al. 12 and Dong et al. 13 discussed the optimum hot working parameters for the micro carbon steel and Cr microalloyed low-carbon steel by processing maps and micrographs, and determined the apparent activation energy for hot deformation and the hot deformation equation in ferrite based on the experimental data.
QD08 steel is generally used for producing claw poles which are key parts of automotive alternators: its shapes and micro-grain sizes directly influence the waveforms of induced AC electromotive forces and electricity-generating capacity and noise of alternators. 14 Claw poles, as typically highly reinforced and branched parts, show complex shapes and impose high demands for quality and need hot forging. However, in the study of hot deformation behavior of low-carbon steels, the deformation temperature is generally in the critical austenite region or ferrite region below 1000°C, while the hot forging of claw poles is rarely studied in the high temperature austenite region (1100°C–1200°C). The high temperature rheological data and constitutive relationship governing the behavior of this material are not found in many major commercial simulation software suites (such as DEFORM). In this study, the high temperature deformation behaviors of low-carbon steel QD08 are investigated by isothermal compression tests under wide ranges of forming temperature (1000°C–1200°C) and strain rate (0.1–10 s−1). The effects of forming temperature, strain rate and strain on the flow behavior are discussed. Based on the dynamic material modeling, the processing maps of the studied low-carbon steel are constructed to optimize the hot working domains. In addition, the microstructural evolution is analyzed to validate the established processing maps of the studied QD08 steel.
Materials and experiments
Low-carbon steel QD08 was used in the experiment and its chemical composition (mass fraction (%)) is shown in Table 1. The bar materials were processed as cylindrical samples measuring Φ8 mm × 12 mm, and the two ends were planished and grease was smeared onto the surfaces to reduce the influence of fractional composition on the stress state. A uniaxial compression test of the low-carbon steel QD08 was conducted using a Gleeble 3500 thermal simulation test machine. The rate of temperature increase, holding time and total compressive strain were 10°C/s, 5 min, and 70%, respectively. Moreover, the steel was subjected to hot compression deformation at 1000°C, 1100°C, 1150°C, and 1200°C at strain rates of 0.1 s−1, 1 s−1, 5 s−1, and 10 s−1, respectively. An argon shield was used in the compression process to prevent the oxidation of sample surfaces. The samples were water quenched immediately after deformation structures, so as to conveniently observe microstructural characteristics after thermal deformation.
Chemical compositions of the studied low-carbon steel (wt %).

In order to analyze the effects of the forming processing parameters on the microstructures, the grain structures of the deformed specimens were observed by optical microscope (OM). First, the deformed specimens were sliced parallel to the axial section, and then the exposed surface was polished and etched in a solution consisting of supersaturated picric acids and dodecyl sulfonate sodium to observe the austenitic grain structure. In addition, alcohol solutions containing 3% nitric acid (volume fraction) were used as a corrosion-agent to allow observation of the ferrite structures. Figure 1 shows the microstructure of the studied QD08 steel before the hot compression. It is found that the microstructure is composed of fine equiaxed grains with a mean grain size of 14 μm. The foils for TEM examination were prepared by hand grinding to a thickness of 70 μm and then thinned using twin-jet electropolishing with a solution of 10% perchloric acid in ethanol.

Original metallographic of low-carbon steel QD08.
Results and discussions
Flow stress behavior
The true stress-true strain curves of the low-carbon steel QD08 in the isothermal compression tests are shown in Figure 2 where the flow stress curves of the QD08 steel at different strain rates and deformation temperatures are presented. The flow stress rapidly increased with increasing deformation when the deformation was small. Upon exceeding a certain strain, the flow stresses tended to be constant or slightly decreased. At the same strain rate, the flow stresses at low deformation temperatures (1000°C) were significantly higher than those at other temperatures; however, owing to the test temperature being close to, or greater than 0.7 to 0.8 Tm, dynamic recrystallization might occur in austenite deformation with low stacking fault energies. In addition, it can be seen from the stress–strain curves that the softening at high strain rate (>5 s1) and low deformation temperature (1000°C) was characterized by dynamic recovery, the other stress–strain curves showed special shapes; the stress increases with the increase of deformation at the initial stage of deformation, after reaching the peak value (σp), the yield stress decreases to a constant value (σs) due to dynamic recrystallization. At this time, the balance between work hardening and dynamic softening is reached. Furthermore, with the decrease of deformation temperature and an increase in the strain rate, the peak stress (σp) and strain required for the appearance of peak stress, that is, peak strain (εp) increased.
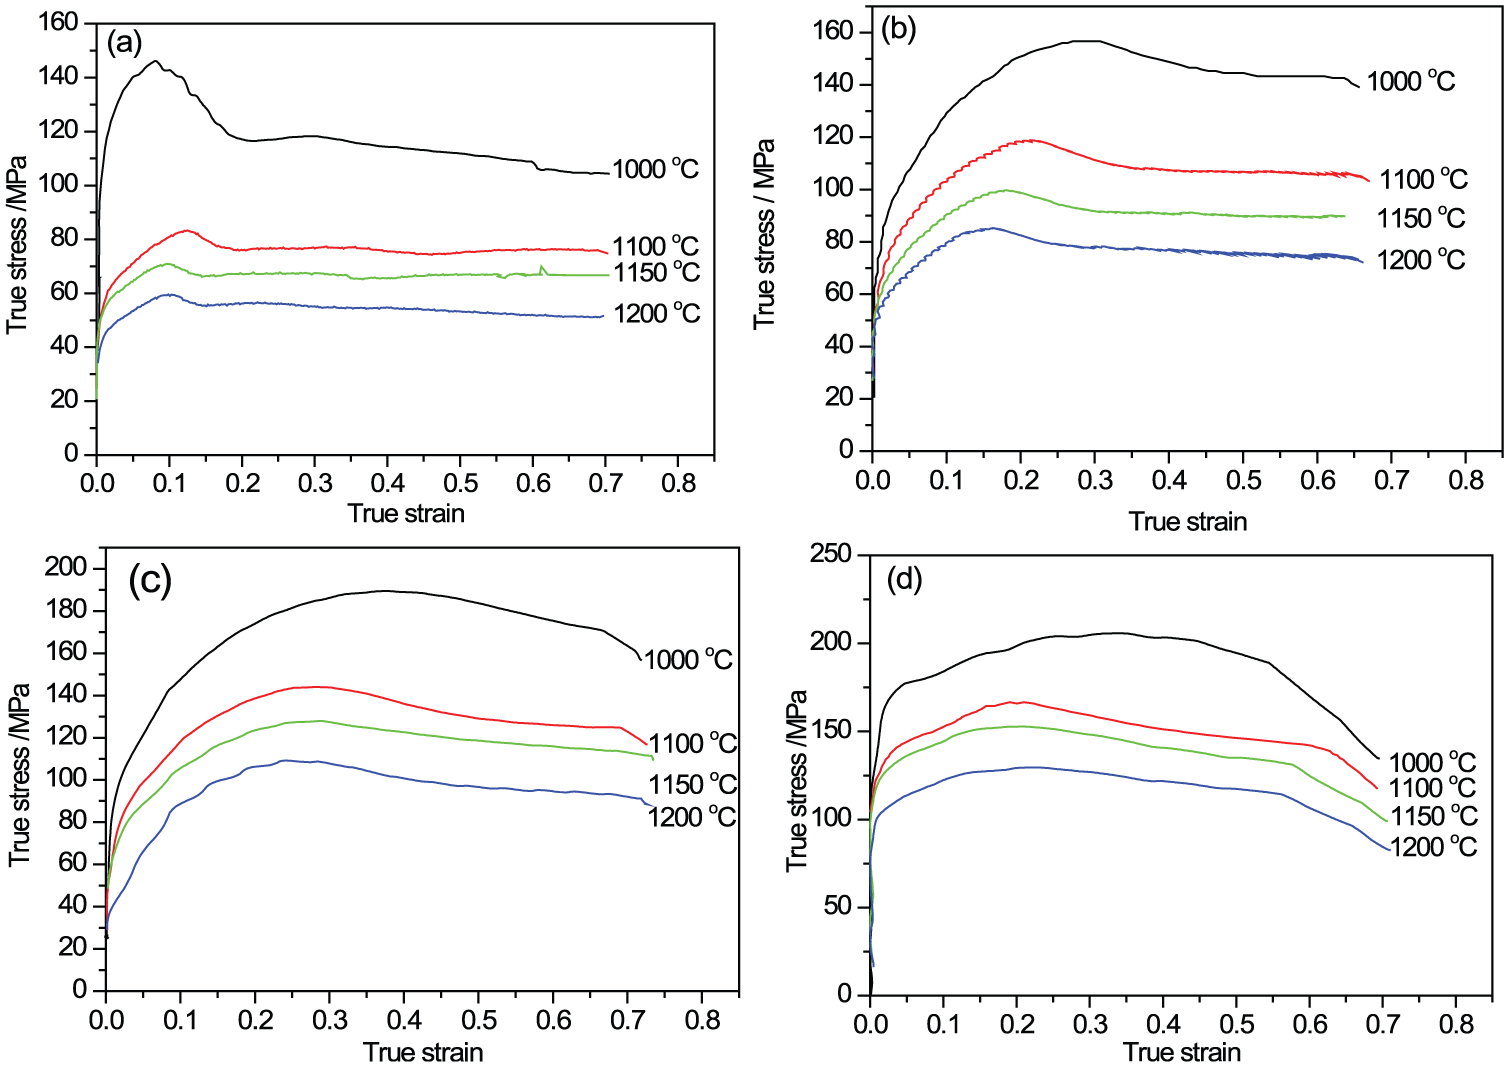
True stress-true strain curves of the QD08 hot compression at different strain rates (a) 0.1 s−1, (b) 1 s−1, (c) 5 s−1, and (d) 10 s−1.
Kinetic analysis
Activation energy and constitutive equations
In general, thermal activation of metal materials occurs with high-temperature deformation and the flow stress is closely related to different deformation temperatures, strain rates, and the extent of the deformation, which can be described using the following three forms 15


Where A1, A2, A, n1, n, α, and β are constants relating to the steel and
After taking logarithms of both sides of (1) and (2), the following formulae are obtained


Relationship of flow stress and strain rate at different temperatures (a)
By using the same method, that is, taking the logarithm of both sides of equation (3)


The relationship between flow stress, strain rate and deformation temperature. (a)
By substituting the average slopes of the curves in Figure 4(a) and 4(b) into equation (7), it was found that Q = 219.7731 kJ/mol. Formula (6) demonstrates that the average slope of the curves in Figure 3(a) was n (n = 5.3527) and the intercept was
The temperature compensated strain rate parameter or the Zener–Holloman is evaluated, and the relationship between Z and peak stress could be represented by following equation

At a constant initial grain size, the dependence of strain corresponding to the peak strain (εp) on the Z could be expressed as power law type of equation

where, the parameters A and n depend on the low-carbon steel composition. The plot of Z and (εp) in logarithm scale is show in Figure 5. It can be seen from Figure 4 that the correlation coefficient R for the linear regression of lnZ and ln(εp) is 0.99247, indicating that this plot exhibits a good linear correlation between flow stress and Z value. Thus, the relationship between Z and (εp) could be represented by the following equation

From equation (11), it can be seen that the peak strain (εp) increases with the increase of Z for the low-carbon steel QD08.

The relationship between peak strain (εp) and Zener–Hollomon parameter (Z).
Critical conditions for DQ08 dynamic recrystallization
The stress–strain curves show the macroscopic changes of microstructures in the material, while the critical strain for dynamic recrystallization is a key criterion used to determine whether dynamic recrystallization occurs during thermal deformation. It is generally acknowledged that the strain corresponding to the stress peak on the true stress–strain curve can be used as the critical strain for dynamic recrystallization. However, as for stress–strain curves without an obvious stress peak, it is difficult to directly determine this effect from the curves. Poliak and Jonas
16
proposed critical dynamic conditions based on thermodynamically irreversible principles and studied the dynamic recrystallization and critical conditions of materials by using a work hardening rate method. The work hardening rate (θ) indicates the rate of change of flow stresses with respect to strain
The stress–strain curves in Figure 2 were non-linearly fitted by using Origin software. Based on the

The stain hardening rate-strain curves of QD08 at 0.1 s−1.
The lowest point of the curves can be used to determine the critical strain values for dynamic recrystallization under different conditions. By employing the same processing method, the critical strain values for dynamic recrystallization under different deformation conditions were obtained. The critical strain, and peak strains, under different deformation conditions are listed in Table 2.
The critical strain and peak strain values of different deformation.

With the increase in deformation temperature and decrease in strain rate, the critical strain (εc) and the peak strain (εp) of dynamic recrystallisation generally decreased, indicating that dynamic recrystallisation occurred readily. This coincided with the characteristics of the stress–strain curves. Furthermore, they showed certain linear correlations. After linear fitting,

From equation (12), the critical strain for dynamic recrystallisation of the low-carbon steel QD08 under certain deformation conditions (
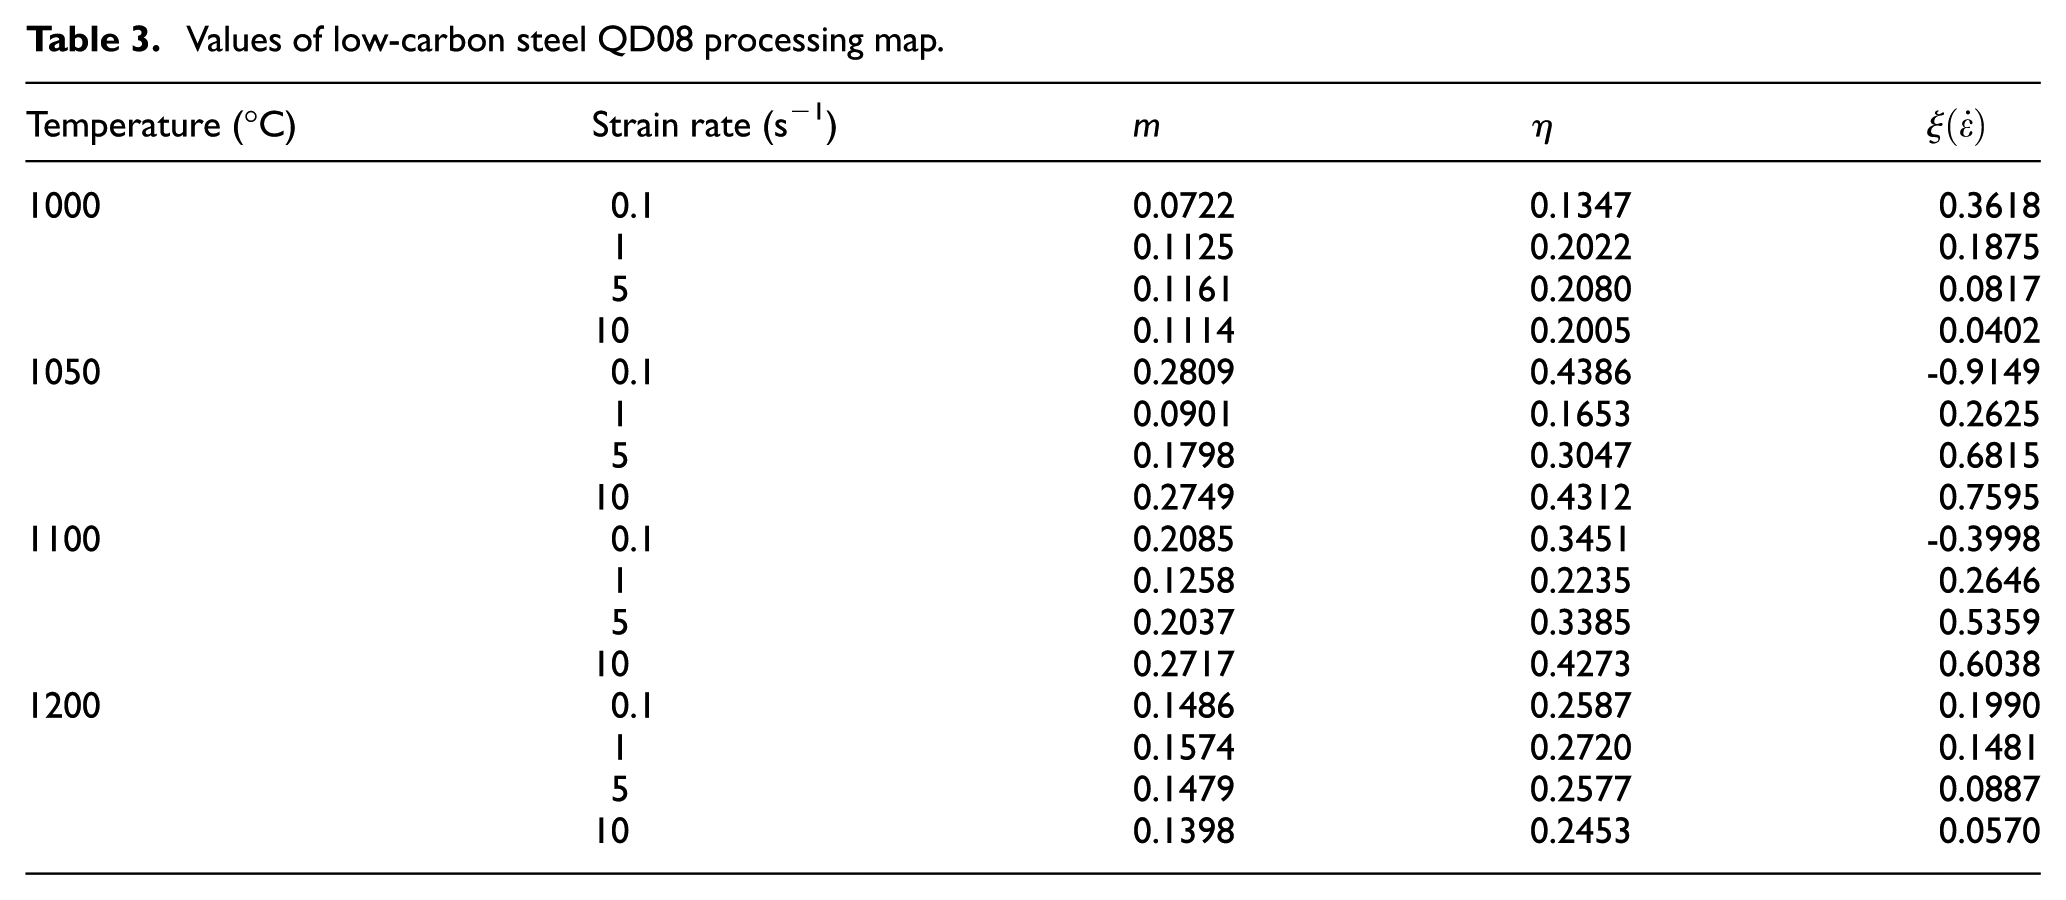
Processing maps
The principles for processing maps
The maps describing the processing characteristics of materials are known as processing maps. A DMM is established based on the basic principles including physical system simulation, continuum mechanics, and irreversible thermal dynamics. The hot processing maps established by this model are widely used to characterize hot processing performances of materials and optimize hot processing parameters. DMM regards the heating process as a system. In hot forming processes, the total external power input is represented as

The proportions of these two energies are determined by strain rate sensitivity m of the material, namely,

The efficiency factor η of power dissipation is introduced to indicate the power dissipation when the microstructure of the material changes, it is defined by
The contour map of power dissipation factors is drawn on the two-dimensional plane formed by strain rate
While establishing processing maps based on DMM, non-dimensional parameter
Processing map of low-carbon steel QD08
As shown in Figure 3(a),
Based on the powerful matrix computing capacity of MATLAB™, the cubic spline function was used to fit
Values of low-carbon steel QD08 processing map.

Power dissipation map (a), instability map, (b) processing map, and (c) for low-carbon steel QD08.
As shown in the power dissipation map (Figure 7(a)), there are two peak areas (the areas of maximum η value): domains A and B. In domain A, the temperature, strain rate, and power dissipation coefficient are 1070°C–1100°C, 5–10 s−1, and about 0.31–0.35, respectively. Moreover, the temperature and strain rate corresponding to the peak are 1100°C and 10 s−1. In domain B, the temperature, strain rate, and power dissipation coefficient are 1050°C–1100°C, 0.1–0.2 s−1, and around 0.31–0.35, respectively. Furthermore, there is a valley area (the area of minimum η value), that is, domain C. The temperature and strain rate are 1045°C–1,075°C and 0.45–0.7 s−1, separately, and the power dissipation coefficient is less than 0.15. The instability maps (Figure 7(b)) reveal that there is an unstable area for the low-carbon steel QD08 tested in this experiment (the temperature and strain rate are 1050°C–1100°C and 0.1–0.25 s−1, respectively).
Power dissipation maps are also known as microstructural trajectory diagrams and represent the microstructural rate of change during hot processing deformation. Areas with higher power dissipation are generally considered as having better processing performances. However, failure mechanisms (wedge cracks) generally occur in areas with higher power dissipation coefficient as well. Therefore, it is necessary to verify the processing performance by further combining the microstructures of samples, so as to obtain the mechanisms underpinning microstructural change in different areas of the processing maps, and validate the reliability thereof. 18 Figure 8 shows the three-dimensional power dissipation efficiency map of the low-carbon steel QD08. It demonstrates the trends in the two peak areas (domains A and B) and one valley area (domain C) of power dissipation efficiency with different processing parameters. In peak domain B, with low strain rates, the power dissipation efficiency of the studied QD08 steel dramatically changed, indicating that the hot processing performances were extremely unstable in this area and flowing deformation instability occurred in local areas.

Three-dimensional representation of power dissipation as functions of strain rate and temperature for low-carbon steel QD08.
Microstructural evolution in different domains of the processing map
The image quality map (IQ) and inverse pole figure (IPF) of the specimen at different deformation conditions are shown in Figure 9. The orientations and colors of each point in grains were represented in standard projected triangle of IPF. It can be seen that under the deformation conditions in the section adjacent to area A (the temperature and strain rate were 1070°C–1100°C and 5–10 s−1), the grains were equiaxial and uniform with small size. Moreover, the grain boundary was flat and there was no annealing twin in the grains (Figure 9(a) and 9(c)). This was typical structures of dynamic recrystallization. Under the deformation condition in the section adjacent to area B (the temperature and strain rate were 1050°C–1100°C and 0.5–0.2 s−1), owing to litter energy was stored in the grains at such low strain rate, the driving forces of recrystallization were low. Furthermore, during the long process of deformation, the dislocations in some areas had enough time to cancel each other out, causing decrease in nucleation sites and providing favorable conditions for further development of grains. This area exhibited obvious grain coarsening, and cracks were produced under large strains. Wedge cracks were observed in trigeminal grain boundaries, as shown in Figure 9(e). In the section adjacent to area C (the temperature and strain rate were 1045°C–1075°C and 0.45–0.7 s−1), the efficiency factor η of power dissipation significantly decreased due to deformation concentration (local deformation concentration is shown in Figure 7(g)). The higher the strain rate was, the narrower the deformation band and the more obvious the deformation concentration. At lower temperature and higher strain rate, the deformation concentration bands might develop into adiabatic shear bands, thus leading to processing instability.

Image quality map and inverse pole figure map obtained from EBSD measurement of QD08 low-carbon steel at different deformation conditions. (a and b)1100°C, 10 s−1; (c and d) 1150°C, 5 s−1 (e and f) 1100°C, 0.1 s−1; and (g and h) 1000 °C, 1 s−1.
The orientations and colors of each point in the grains were shown in standard projected triangle of IPF. Many different colors were found in each grain, indicating certain orientation differences existing in the grains. However, blue areas with larger misorientation in Figure 9(f) accounted for a large proportion and adjacent grains demonstrated highly contrast colors, which probably resulted from split of grains by wedge cracks.
In order to clearly observe the structural characteristics, especially, dislocation configurations and distributions in the deformed grains, TEM was used for observations under different deformation conditions, as shown in Figure 10. In the area close to area A, the grain boundaries were flat and a larger number of dislocations were released through refining grains due to dynamic recrystallization in the deformation process, causing low dislocation density in grains and on grain boundaries (Figure 10(a) and (b)). Meanwhile, a gradient of dislocation density was found in the grains and grain boundaries in area B and a large number of dislocation winding appeared in the grains (Figure 10(c)). This is because of low strain rate and degree of responses. Furthermore, the dislocation density caused by deformation increased and it was difficult to eliminate crack grains through response. Therefore, dynamic recrystallization did not occur and grains are still large. As for area C, owing to local deformation, a larger number of dislocations concentrated adjacent to grain boundaries, forming dislocation walls (Figure 10(d)). With the increase of strain rate, the dislocation winding decreased and thereby substructures became clearer. Obvious sub-grain boundaries were observed when the strain rate was 5 s−1, which indicated apparent recrystallization, as demonstrated in Figure 11.
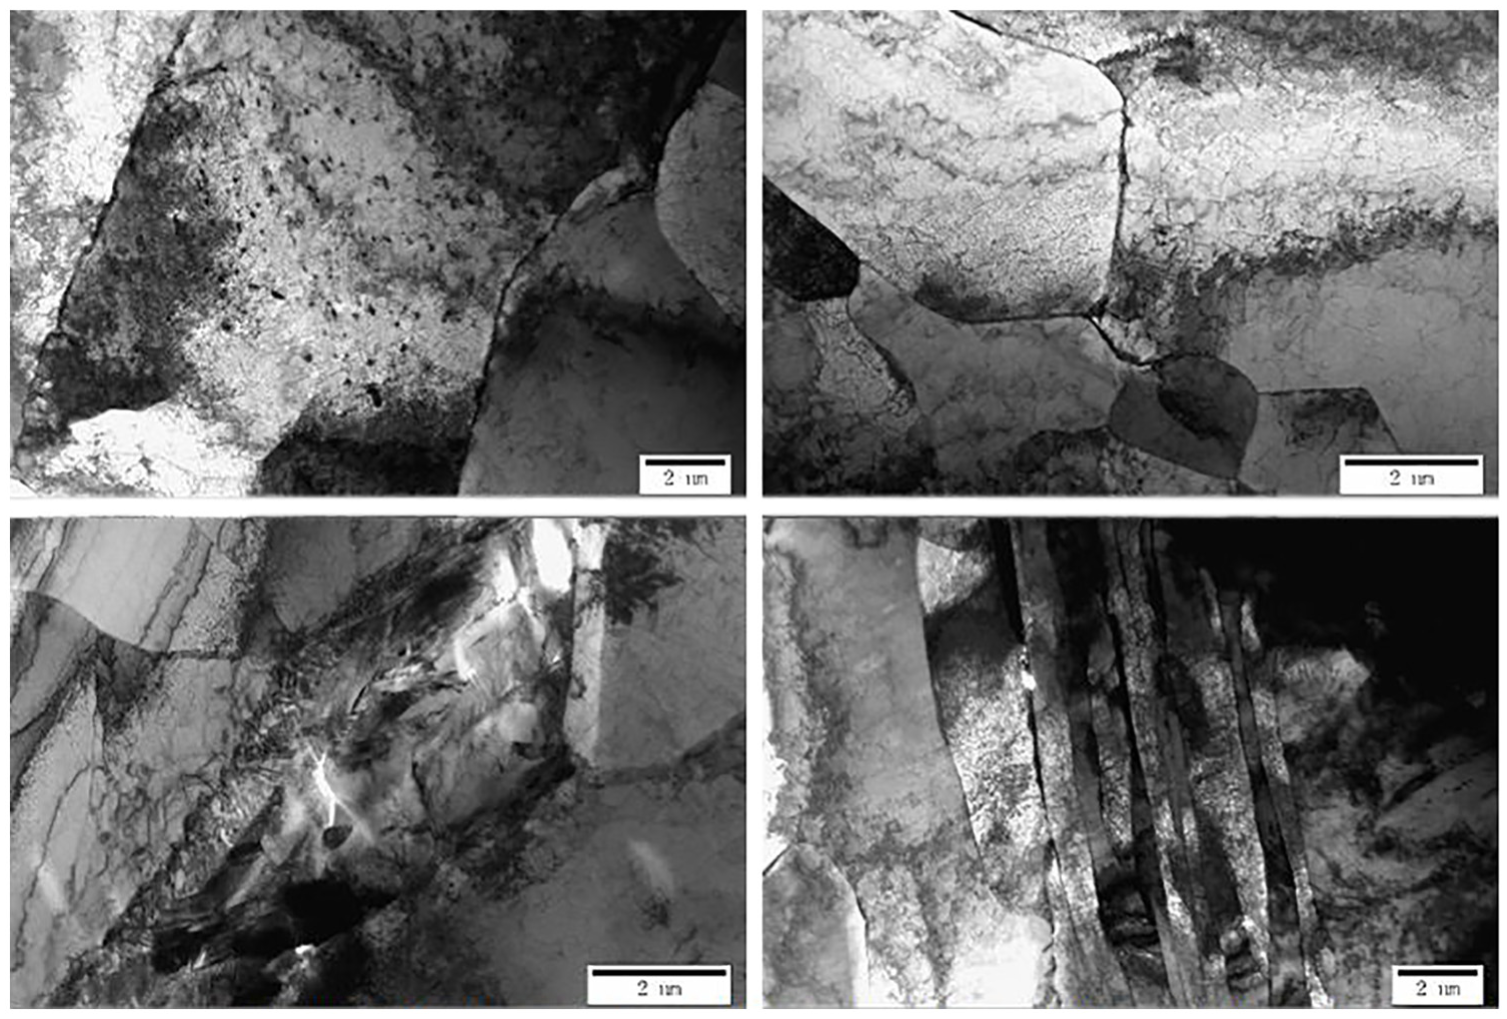
TEM micrographs of 6082 aluminum alloy at different deformation conditions: (a) 1100°C, 10 s−1; (b) 1150°C, 5 s−1; (c) 1100°C, 0.1 s−1; and (d) 1000°C, 1 s−1.

Micrograph of sub-grain.
Hot processing parameters designed according to hot processing maps
Dynamic recrystallisation released a large number of dislocations, produced in the process of material forming through refining grains to maintain a certain dynamic equilibrium. Furthermore, the power dissipation efficiency was high in this area so that the microstructure of the material improved, thus ensuring stable stress states and good processing performances during hot processing. Therefore, when determining processing parameters in accordance with hot processing maps, the dynamic recrystallisation area is suggested to be selected as a matter of priority.19,20
Based on the foregoing analyses of hot processing maps and microstructural observations, the peak areas with higher power dissipation efficiency need to be considered first while selecting the hot processing parameters for a low-carbon steel such as QD08. However, the recrystallized, and original, grains are likely to be coarsened during high-temperature deformation, thus significantly reducing the performance of the material. Therefore, it is better to carry out hot forming processing of low-carbon steel QD08 at 1070°C–1100°C at a strain rate of 5–10 s−1.
Conclusion
The hot deformation behavior of low-carbon steel QD08 has been studied in a wide range of temperatures and strain rates (1070°C–1100°C and 5–10 s−1) using a thermo-mechanical simulator (Gleeble 3500). Experimental data were analyzed and employed for kinetic analysis as well as to develop the processing map. Detailed microstructural investigations were carried out to validate the domains of the processing map. The following conclusions are drawn from this study:
The relationship between Zener–Hollomon parameter (Z) and peak stress could be represented by the equation
The processing maps of low-carbon steel QD08 at different deformation conditions have been developed employing DMM. It has been observed that two peak areas with high power dissipation efficiency in the processing map, and the two peaks correspond to a safe processing region and an unstable region, respectively. However, instability domain (at low temperature) is reduced significantly as strain rates below 1 s−1.
Low-carbon steel QD08 exhibits a wide stable domain of 5–10 s−1 spanning over 1070°C–1100°C, with a peak efficiency of ∼35%. Based on the processing map and subsequent microstructural observation, the optimum hot deformation domain of low-carbon steel QD08 is identified as 1070°C–1100°C and 2.5–10 s−1.
Footnotes
Handling Editor: Hongwei Wu
Declaration of conflicting interests
The author(s) declared no potential conflicts of interest with respect to the research, authorship, and/or publication of this article.
Funding
The author(s) disclosed receipt of the following financial support for the research, authorship, and/or publication of this article: This research was supported by Zhejiang Provincial Natural Science Foundation of China under Grant No. LY18E050005, and the Research Subject of Education Department of Zhejiang Province under Grant No. Y201636389.