
Abstract
In this article, the air quality is maintained in the breathing zone of a human using personalized air curtain. The breathing zone is modeled and simulated with ANSYS-Fluent 18.1 software and predicted the thermo-fluids flow characteristics in the breathing zone. The clean air is supplied from the air curtain device to distribute in the breathing zone of a human. There are 11 nozzles created in the front portion of the air curtain device to supply clean air in front of the face of the human. The air curtain provides a sealed cover between the pollutant and face, which protects the inward flow of pollutants. The flow becomes turbulent even at low Reynolds numbers 136–686 due to the mixing of air jets from multi-nozzles in the air curtain device and entrainment of ambient air into the breathing zone. The thermal balance (comfort) between breathing zone and atmosphere was maintained using isothermal air jets. The standard k-ε model is used for predicting the turbulent characteristics of air flow. The results obtained from the simulation was analyzed for optimum airflow velocity to occupy the breathing zone with clean air completely. The best flow pattern is achieved for the optimum nozzle exit velocity of 3 m/s, height y = 70 mm from the bottom of breathing zone for nozzle width of 2 mm. These conditions ensured the air quality and the comfort velocity (0.5 to 0.8 m/s) and pressure about 1 bar in the breathing zone.
Introduction
In the recent years, humans witnessed a huge revolution in the industrial field: the numbers of factories and automotive are increasing at a high rate. Mainly, the air gets polluted due to the mixing of automobiles exhausts, industrial wastes, medical wastes, toxic gasses, dust, smoke, and so on, with air. Nowadays, automobiles are considered as one of the main source of air pollution. Cars, buses, and trucks are the main elements of Traffic-Related Air Pollution (TRAP). When engines burn fuel, it results in large emissions of Carbon Monoxide (CO), Nitrogen Oxide (NO), Volatile Organic Compounds (VOCs), and fine Particulate Matter (PM). With the presence of the industrial revolution, the outdoor air quality changed and clean air cannot be found anywhere. The pollutant in the atmosphere has affected the human health critically. Researchers have the responsibility to provide help for humans from exposure to air pollutions. When inhaling the air, pollutants present in the air affect human health in serious risks of diseases such as respiratory diseases, lung damage, cardiovascular disease, and even death. Therefore, higher level research on this problem is needed to establish an air curtain, which will protect breathing zone (BZ) of humans from the polluted surrounding environment which saves the life.
Kolluru et al. 1 examined the contribution of different travel modes such as car with and without air conditioner and bus without air conditioner exposure of pollutants for travel for long distance in India on a national highway. The exposure of CO and PM2.5 for the passengers above 200 km vehicle speed were measured with two portable air monitors on a national highway. The PM2.5 personal concentration exposure levels on an average were highest in car without air conditioner (85.41 ± 61.85 μg m−3), followed by bus with air conditioner (75.08 ± 55.39 μg m−3), and very low in car with air conditioner (54.43 ± 34.09 μg m−3). In disparity, in car with air conditioner (1.81± 1.3 ppm), CO personal exposure was highest followed by car without air conditioner (1.34 ± 1.03 ppm) and lowest in bus without air conditioner (0.80 ± 0.61). Halvonova and Melikov 2 examined the displacement ventilation (DV) for the better performance of “ductless” personalized ventilation by providing quality of inhaling air, thermal comfort, and height of the PV from the floor. The results illustrate that intake up to 0.2 m from the floor does not have a significant effect on inhaled thermal comfort and air quality of the person.
Melikov et al. 3 investigated the performance of personal ventilation unit for physical comfort in mankind and identified that the capacity of supplying clean air to inhale depends on size and shape of the opening through which the air flows. The result suggested a great improvement in air quality and decreasing airborne cross-infections.
Shen et al. 4 have been investigated the personal exposure and pollutant transmission characteristics with different types of Personal Ventilation (PV) channels. The investigation shows that the high flow rate in PV may interrupt the features of the ventilation system and increase personal exposure than ventilation alone. Also, interactions between mixed ventilation (MV) and PV is weaker than the PV and DV.
Lipczynska et al. 5 studied the air quality conditions and thermal environment of personalized ventilation (PV) and the chilled ceiling condition. The improved thermal conditions of PV are 10 times more effective in distributing pure air at working place than MV. Al Assaada et al. 6 investigated the performance of an intermittent periodic personalized ventilation (PV) and MV. The particle concentration fields, velocity, and temperature in the space were assessed using computational fluid dynamics (CFD). Experiments were performed in a climatic chamber using a thermal manikin in order to validate the numerical predictions. Good agreement was found between the CFD model and experiments. It was found that an average flow rate of 7.5 L/s, as well as an operating frequency of 0.86 Hz, is acceptable values of intake fractions in the BZ and the surrounding microclimate as well as acceptable values of deposition rates. These conditions provide good thermal comfort levels (0.87: comfortable), good ventilation effectiveness (77.1%), and air quality ventilation effectiveness of 77.1%, IFBZ of (5.43, 5.33, 4.3) × 10−4, IFmax, micro of (3.6, 3.48, 1.35) × 10−3, and DFr (%) of (6.26, 8, 8.52) for (0.1, 1, and 10 μm).
Zítek et al. 7 studied the airliner to supply fresh, humidified air to all passengers individually. A separate airflow is given to the individual passenger, which is also separately exhausted. CFD model is used for designing the system which is verified with laboratory experiments. The result shows that two nozzles have to be fixed back of the seat ahead and close to the face of the passenger in the personalized air inlet and exhaust portion. Sagona et al. 8 carried out the measurements of personal exposure accurately for atmospheric pollutants. The simultaneous ozone measurements and Personal Ozone Monitors’ (POM) measurements were compared and used a 16 Thermo Scientific 49i monitor to check precision. A controlled environmental facility was tested for in a private residence outdoors. The study concludes that the POM is a feasible option for ozone monitoring. F Kalmár and T Kalmár 9 developed an advanced personalized ventilation system to improve the thermal comfort to the people. Fans are used to improve the thermal comfort increasing artificially in hot environments. The temperature and relative humidity of air movement around the head of the occupant can be compensated by air flow velocity. The results show that the number of warm receptors is less than the cold receptors and the velocity of warm information is 10 times less than the velocity of cold information in the advanced personalized ventilation system. Andrius Jurelionis et al. 10 analyzed the personal ventilation of the occupants in the room at various levels. Three ranges of different heights with a temperature of 22°C to 25°C by performing CFD simulations. The results show that the pollutants available in ground level are entrained into BZ of the occupants due to a temperature gradient. Bogdan et al. 11 studied the effect of the breathing process in personalized ventilation (PV) experimentally. The results depict that air jets in BZ influence the users’ thermal sensation. The ventilation and air conditioning systems are designed based on the information particularly important that affect the environmental parameters in the local region of the human body. Wang and Zhong 12 developed an approach to determine the infiltration and the exfiltration. A detailed parametric study was conducted by using CFD simulations. The calculated air infiltration rates were correlated with the pressure differences across the air curtain. New infiltration/exfiltration correlations of the modeled air curtain were developed as the functions of the pressure difference, flow coefficient, and flow modifier. Shi et al. 13 carried out a numerical simulation of convergent air curtain using CFD. For the air curtain at a different angle of incidence, initial wind speed was studied under static conditions using simulation model. The experimental results were compared with numerical simulation results, and the convergent effect of the air curtain with uninterrupted outward conditions have been investigated. Shih et al. 14 investigated the pollutant dispersion flow field in an incoming quality control (IQC) cleanroom experimentally. The results reveal that the air curtain device creates reasonable protection to restraint pollutant spreading. The performance has been optimized with ejection angle, velocity, and height of installation. The air curtain was used for the personnel safety concern by monitoring the airflow, contaminant characteristics, and pollutant spreading process for emergency management in a contaminated cleanroom.
Wilson 15 registered a patent, which used a facial device that includes a pair of eye glasses wherein the channel pushed air through the frame of the glasses. Osipov and Tsyganov 16 invented a product that protects the facial areas such as the nose, eyes, and mouth from the airborne particle matter from air surrounding. Glazman 17 patented a respiratory protection system device which could be used in many fields by anyone who wants to separate the outside atmosphere from the BZ. Gonzalez and Iriarte 18 invented a device that is used for protecting the facial area from smoke, dust, odors, and insects, and claims that a lens member, air supply member, and at least one side nozzle member provide adjustable directional air flow. Kikuyama 19 created the device related to eyewear that protects a user’s eyes from airborne particles that would obscure the user’s vision. Moreover, the device is related to users who use spray printers, with a compressor air source.
Yu et al. 20 carried out the small-scale experiments to study the sealing effect of an air curtain for fire-induced smoke confinement in a tunnel configuration. It is observed that an optimal injection angle of 30° inclined to the fire source is recommended in the engineering design of the air curtain for smoke confinement for situations where the fire location can be pre-determined to be only at one side of an air curtain.
Hu et al. 21 carried out experimental and numerical studies of the possibility of utilizing air curtain for confinement of fire-induced smoke and CO transportation along channels. It reveals that that the air curtain can be an effective measure for confining the transportation of smoke and CO species.
From the above literature, the majority of the studies available related to personal ventilation and few studies available related to door air curtain to prevent the infiltration and exfiltration in the building and no studies found related to personalized air curtain for a human except few patents filed with the similar principle about the personalized air curtain. It is understood from the literature that there is a need of air curtain for human due to increasing industrial pollution scenario in the recent years and scientists have shown interests in creating new products in the said field. Considering the importance and expertise available in the field of CFD simulation, the concept of air curtain for human was analyzed through CFD in the present work in order to provide optimal flow parameters toward developing new product in this field.
Physical model
In the present work, the flow field is created in the BZ by issuing clean air from 11 identical multiple nozzles with a width of 2 mm each in an air curtain device with various uniform velocities into the BZ. The flow field is produced by air issuing from 11 identical parallel nozzles set in a common end wall, discharging into the quiescent ambient air, and sample twin jet flow configuration is shown in Figure 1. The flow of clean air in the BZ is considered as planar two dimensional, transient, turbulent, and incompressible. The jet Reynolds number based on local velocity and jet width remains in the order of 500 is assumed as laminar. However, the flow in the computational domain becomes turbulent nature due to entrainment and mixing of ambient air in the jet flow region. The standard k-ε model is used to predict the turbulent characteristics of jet flow in this study.

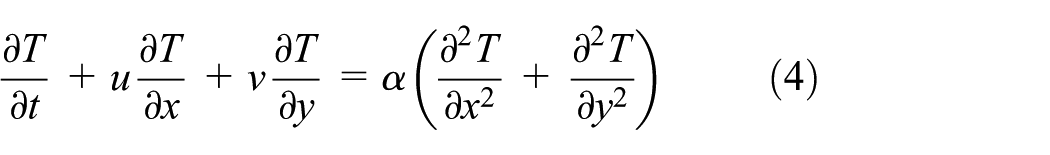
The governing equations used for the two-dimensional (2D), transient, turbulent, and incompressible flow simulation in Cartesian coordinates are as follows 22 :
Continuity equation
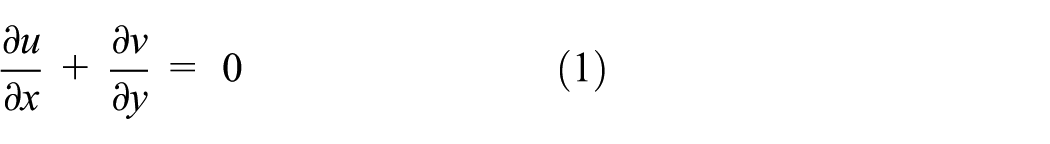
x—Momentum equation
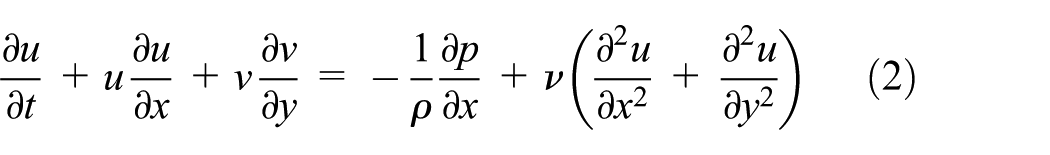
y—Momentum equation

Energy equation
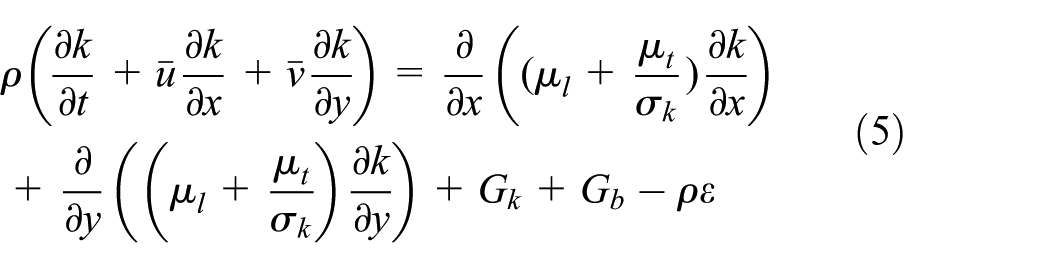
Equation for turbulent kinetic energy 22
Equation for turbulent dissipation rate 22

Rate of production of k by viscous dissipation is

Rate of production of k due to buoyancy is

The values of constants for k-ε model are Cµ = 0.09, Cε1 = 1.44, Cε2 = 1.92, Cε3 = 1.0, σε = 1.3, and σk = 0.85, where
The nozzle width (dj) of each jet and the nozzle inlet velocity (u0) can be used to convert all length- and velocity-related quantities, into non-dimensional quantity (Reynolds number). Also s = stand of distance and y = distance in vertical direction.
Grid independence study and validation
The fine orthogonal mesh was generated in the computation for the simulation. There are 1708 nodes and 1620 number of elements created in the computational domain. The central difference method is applied for solving diffusion terms and up winding scheme is applied for solving convective terms of the momentum equations. SIMPLE technique 23 is used for pressure, which is corrected depending on the residue of the continuity equation. A conjugate gradient solver was used for the pressure correction equation iteratively. The residuals (convergence criteria) of pressure, temperature and 2D components of velocity are 10−6 for the iterative procedure in the simulation. Typically, time steps of the order of 0.1 s were found to be adequate for this study.
Grid independence study was carried out and identified the optimal grid size of 800 × 600 (optimum) for twin jets as shown in Figure 2, at a dimensionless axial distance of x/dj = 10. The differences were found to be minor, for grid refinement from 800 × 600 to 850 × 650. Hence, in the present simulation, 800 × 600 grid has been used for the parametric study.

Grid independence study. 22
The predicted numerical results have been validated against the experimental and numerical results available in the literature for twin jets 22 as shown in Figure 3. The comparison of axial mean velocity distribution of this study with the experimental data 24 has been carried out. The prediction is found to be in good agreement with the experimental data.

Validation of axial velocity distribution.
Boundary conditions
The boundary conditions employed in the present model are shown in Figure 4 as follows.
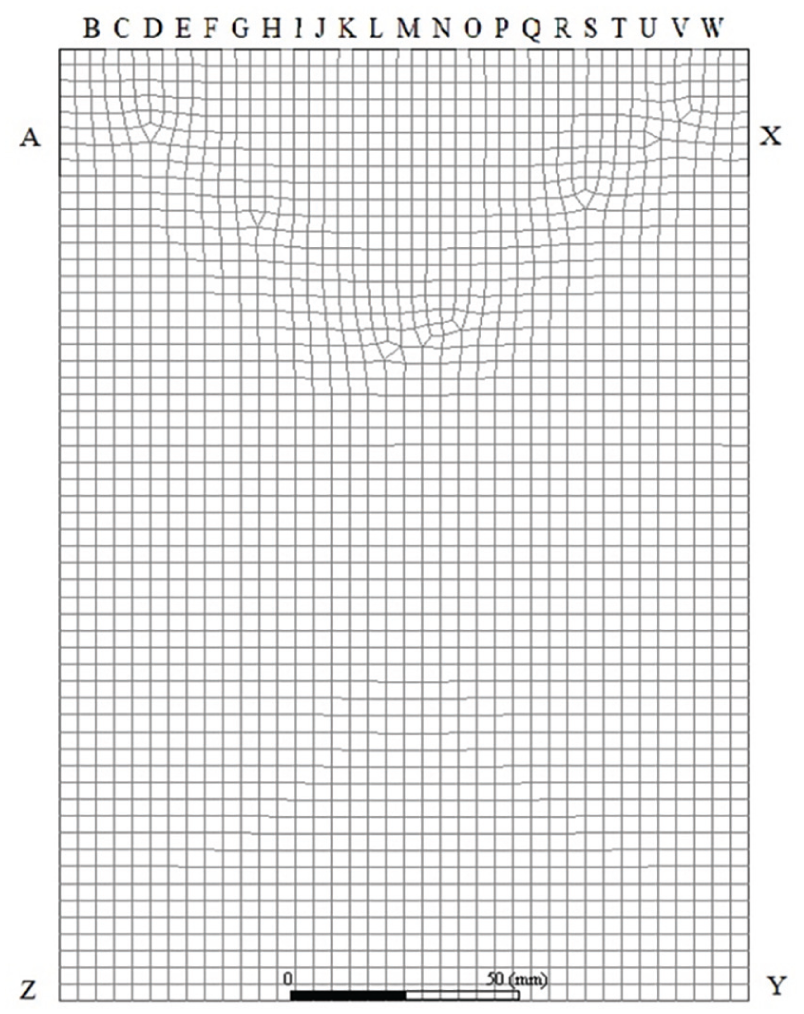
Computational domain, mesh, and boundary conditions employed.
Nozzle exit
For all 11 jets, inlet velocity and atmospheric inlet temperature were set uniformly. The inlet was set to 10% of turbulence intensity to obtain the distribution of turbulent kinetic energy. The equation Cµk1.5/L, where L = turbulence length scale = (0.08dj), was used to get dissipation rate. All 11 nozzles were fixed on a fixed common wall (Edges: BC, DE, FG, HI, JK, LM, NO, PQ, RS, TU, and VW) and for the wall portions (Edges AB, CD, EF, GH, IJ, KL, MN, OP, QR, ST, UV, WX, and barriers: Edges AB and WX) no-slip conditions was set.
Free surface
Both sides of the jets (Edges XY and ZA) were set with the free boundary conditions (pressure inlet). The entrainment was set with pressure inlet (static pressure of the ambient) condition and ambient temperature. Extrapolation were performed for all other variables with the computational solutions inside the domain.
Outlet
The second order derivative of u, v or T in flow direction was prescribed as zero at the outlet of the domain boundary (Edge: YZ). This can help to perform smooth interpolation of flow variables at the exit boundary.
Furthermore, the computational domain of size with 100 mm width and 150 mm height was considered in which two barriers of 20 mm depth were created at the top left and right ends of the BZ or domain for the second part of the study to avoid entrainment near the nozzle exit due to vacuum which can control jet instability.
Results and discussion
BZ without barrier
Figure 5(a)–(c) shows that the velocity vectors inside the BZ of a human for the Reynolds numbers 136, 411, and 684, respectively. The entrainment of ambient into the BZ near the nozzle exit is more due to more vacuum near the nozzle exit and due to the presence of the common fixed wall, and it reduces toward the downstream of the BZ. It is confirmed that pollutant air is mixed in the boundary of the computational domain due to entrainment. However, the entrainment of polluted into the BZ decreases when the nozzle exit velocity or Reynolds number is increased.

Velocity distribution in the breathing zone for different Reynolds numbers: (a) Re = 136 (v = 1 m/s), (b) Re = 411 (v = 3 m/s), and (c) Re = 684 (v = 5 m/s).
Figure 6(a)–(c) shows that the pressure distribution inside the BZ of a human. It is observed that the pressure in the inner layer of the BZ is varying from 0.123 Pa, 0.8 Pa, and 2.31 Pa to that in the outer layer 0.05 Pa, 0.6 Pa, and 1.78 Pa for the Reynolds numbers 136, 411, and 684, respectively. It depicts that when the Reynolds number increases the pressure inside the BZ increases, thus the entrainment is decreased into the BZ. The pressure inside the BZ for the Reynolds number 411 is found optimum because there is no change in pressure beyond the Reynolds number 411 and the similar trend of air entrainment is seen for the Reynolds number or 684 without barrier.

Pressure distribution in breathing zone for different Reynolds Numbers: (a) Re = 136 (v = 1 m/s), (b) Re = 411 (v = 3 m/s), and (c) Re = 684 (v = 5 m/s).
Figure 7(a)–(c) illustrates the velocity distribution in different lateral directions inside the BZ at 30 mm, 60 mm, 90 mm, and 120 mm height from bottom BZ for different Reynolds numbers. The result reveals that more entrainment is found near the free boundary for lower Reynolds number. The velocity at the inner layer of the BZ varies from 0.3 to 0.5 m/s, 0.8 to 1.3 m/s, and 1.4 to 2.2 m/s at different lateral directions as shown in Figure 7 for the Reynolds numbers 136, 411, and 684, respectively. The entrainment of atmospheric air inside the BZ toward middle portion was reduced when the Reynolds number increases because the air flow inside the BZ is capable to prevent the atmospheric air entrainment. The velocity profile is developing to uniform velocity in the inner layer of the BZ when the Reynolds number increases which will be comfort for breathing to a human. The turbulence occurs at the outer layer of the BZ but it is prevented inside the BZ due to developing of velocity in inner layer.
Velocity distribution at 30, 60, 90, and 120 mm height from bottom breathing zone for different Reynolds numbers: (a) Re = 136 (v = 1 m/s), (b) Re = 411 (v = 3 m/s), and (c) Re = 684 (v = 5 m/s).
The above results depicts that the velocity in the BZ increases toward downstream of the BZ, due to jet mixing, turbulence, and entrainment. However, the BZ is partially occupied by pollutant air. So it is decided to attach the barriers on both top sides or near the fixed wall of the BZ to control the entrainment and turbulence.
BZ with barrier
The BZ with barriers was simulated for the velocities ranges from 1 m/s to 5 m/s and the results are discussed in the following sections.
Figure 8(a)–(e) shows the velocity distribution in the BZ of a human for Reynolds numbers 136, 274, 411, 548, and 684, respectively. It is observed that the ambient air is entrained into the BZ through the free boundaries due to the entrainment.

Velocity distribution in the breathing zone for different Reynolds numbers: (a) Re = 136, (b) Re = 274, (c) Re = 411, (d) Re = 548, and (e) Re = 684.
The results illustrate that the velocity in the inner region of the BZ increases with increase in Reynolds number. The entrainment of polluted air from atmosphere into the BZ decreases when the Reynolds number increases. The turbulence is found near the outer layer but it disappears when the Reynolds number increases to 684 due to the barrier fixed at the end wall. Also, the magnitude of the velocity in the BZ is less than that of without barrier because after fixing the barrier, the vacuum near the fixed wall and nozzle exit are controlled, and the amount of polluted air entering into the BZ is reduced than without barrier. Thus, the optimum nozzle exit velocity is found as 3 m/s.
Figure 9(a)–(e) illustrates the pressure distribution in the BZ of a human for Reynolds numbers 136, 274, 411, 548, and 684, respectively. It is observed that the entrainment is reduced near the nozzle exit due to the barrier which controls the mixing of pollutant air in the BZ. The major area of the BZ is filled with clean air for the Reynolds number 411 (Figure 9(c)). The pressure near the boundary of the BZ (0.179 bar) is less than the quotient ambient air, due to that the ambient air entrains into the BZ; however, the velocity is uniform in the inner layer which protects the BZ from pollution. The pressure near the boundary of the BZ is almost closer to the quotient ambient air for Re = 548, due to that the ambient air that entrains into the BZ is reduced to almost zero (Figure 9(d)).

Pressure distribution in the breathing zone for different Reynolds numbers: (a) Re = 136, (b) Re = 274, (c) Re = 411, (d) Re = 548, and (e) Re = 684.
Figure 9(e) illustrates the pressure contours in the BZ at Re = 684 (v = 5 m/s). It is observed that the pressure near the boundary of the BZ is equal to atmospheric air. The entrainment is zero at the free boundary of the BZ. Also, the pressure near the boundary of the BZ is approximately equal to atmospheric (quotient ambient) air.
It is concluded that the pressure inside the BZ increases with increase in Reynolds number so that the pollutant air mixing is reduced. However, the optimal velocity and pressure for breathing clean air for human is achieved for the Reynolds number 411 itself. The study is extended up to Re = 684 to confirm that the entrainment becomes zero when the computational domain is considered.
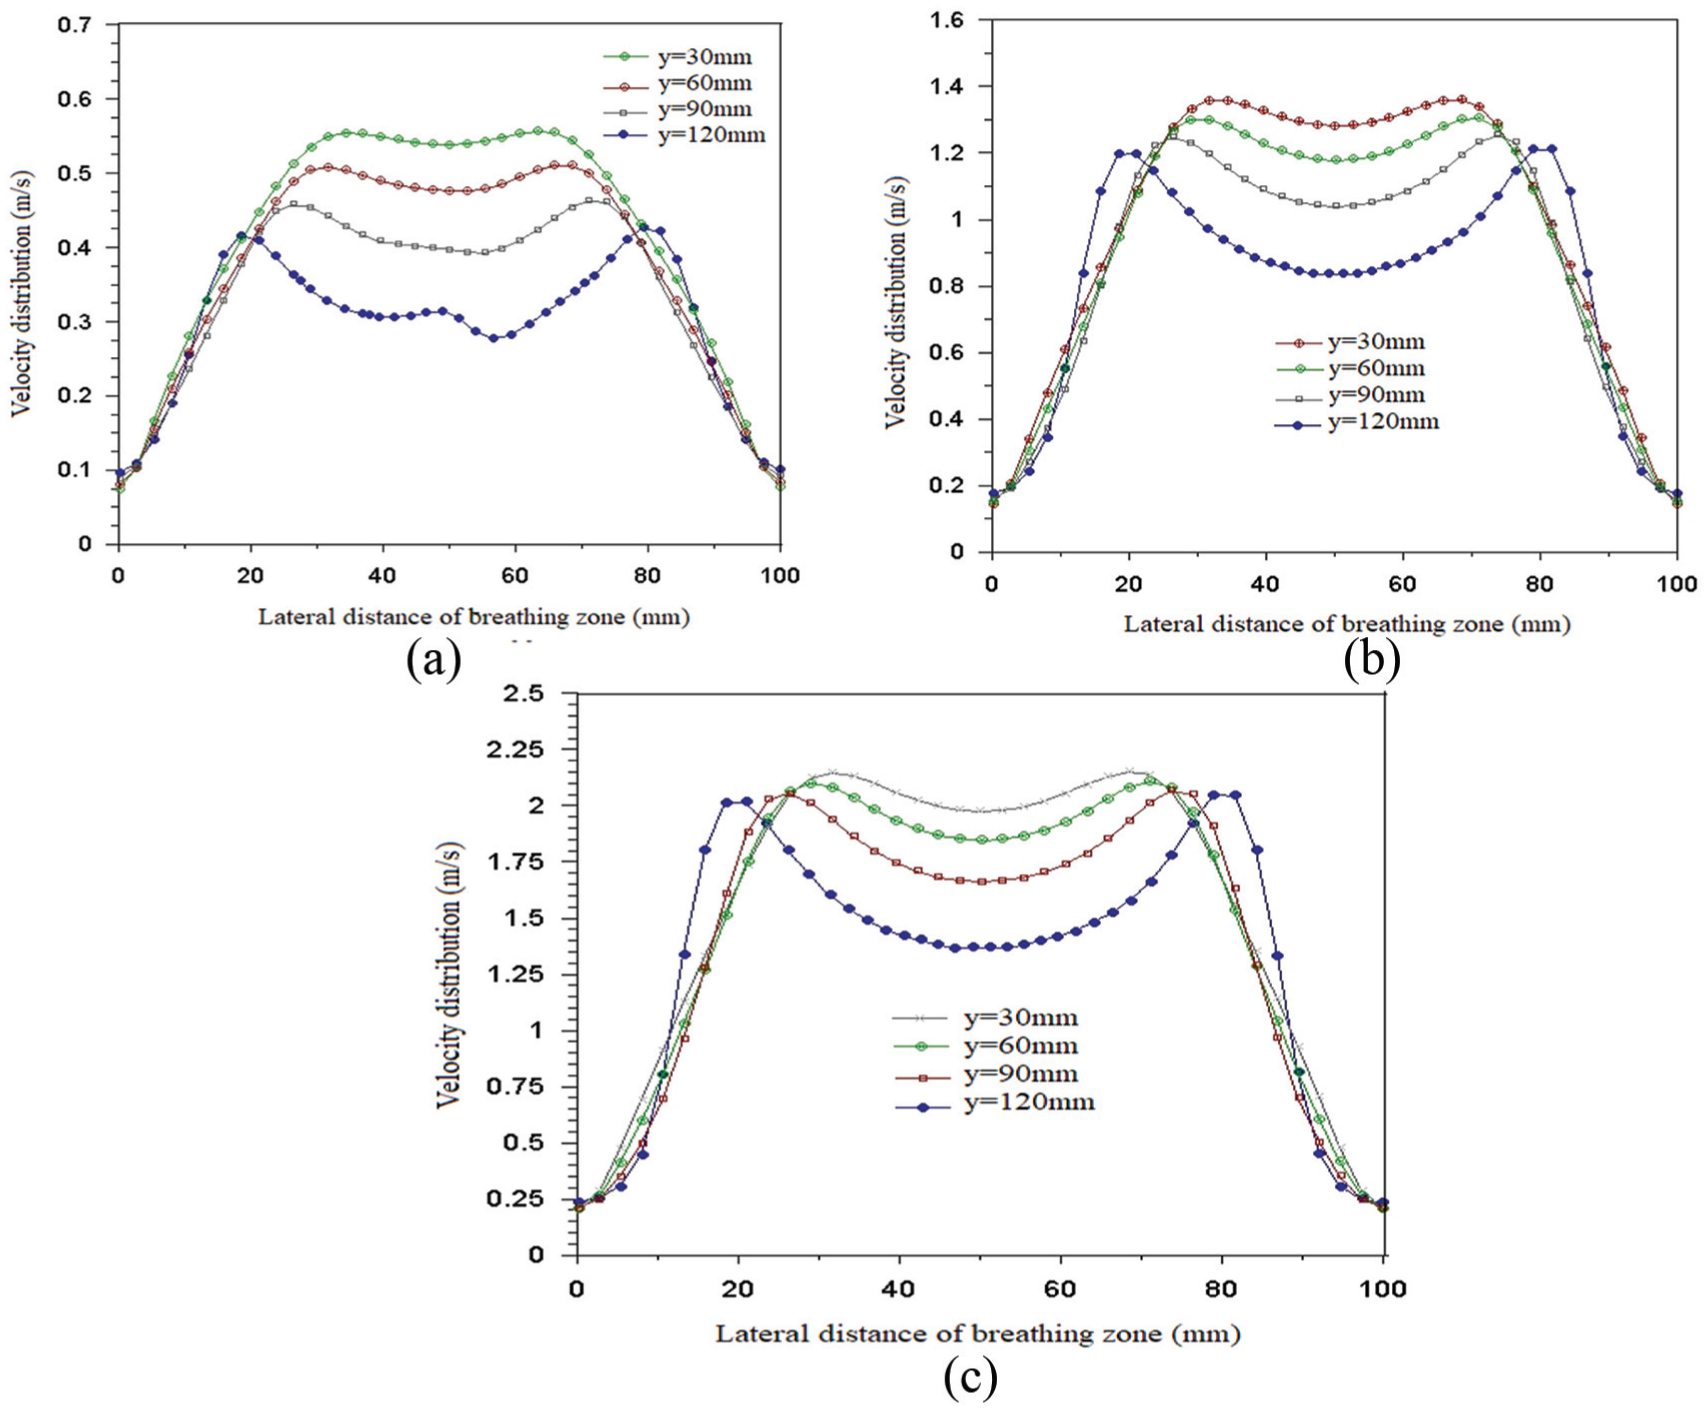
Figure 10(a)–(e) represents the velocity distribution in the BZ in the lateral direction at different locations that are 30, 60, 90, and 120 mm in height from the bottom of the BZ for different Reynolds numbers. It reveals that the velocity at the inner layer of the BZ increases toward the downward direction of BZ. The maximum velocity at y = 120 mm (almost close to the barrier) is 0.5 m/s nearly constant for Reynolds number 274 but it increases toward the bottom of the BZ.

Velocity distribution in breathing zone at 30, 60, 90, and 120 mm height from bottom breathing zone for different Reynolds numbers: (a) Re = 136, (b) Re = 274, (c) Re = 411, (d) Re = 548, and (e) Re = 684.
The BZ velocity at y = 120 mm close to the nozzle exit is found as 0.75 m/s or volume flow rate 10 L/s for Reynolds number 411 (Figure 10(c)) and it increases toward the bottom of the BZ. The BZ velocity is 0.9 m/s or volume flow rate 10 L/s at y = 120 mm nearby the barrier but it increases and constant toward the bottom of the BZ which helps to prevent the polluted air into the BZ completely. The BZ velocity in inner layer is approximately constant in all regions in the lateral direction inside the BZ for the Reynolds number 684 as shown in the Figure 10(e).
From the above results, it is observed that the nozzle exit velocity of 3 m/s is optimum with baffles on both sides in the personalized air curtain and the velocity in BZ found uniform as 0.85 m/s which is a comfort for breathing. Therefore, the air quality can be mounted in the BZ so that the human can be prevented from the diseases due to breathing of pollutant air.
Figure 11 illustrates that the temperature distribution in the BZ of a human. The temperature analysis has been performed in four-layers in the lateral direction of-of the BZ at y = 30, 60, 90, and 120 mm, respectively. It is evident that the temperature distribution in all the regions in the BZ is uniform at 300 K which is a thermal comfort for a human.
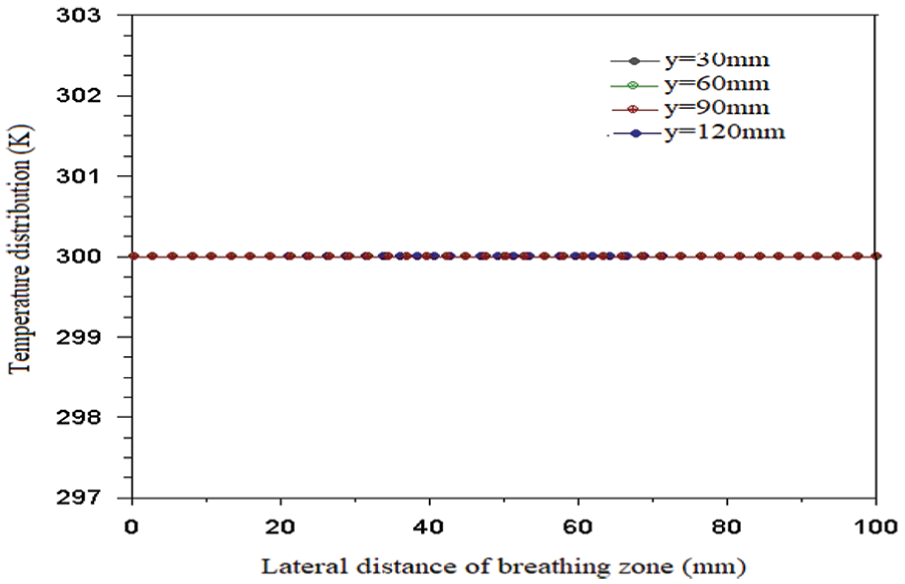
Temperature distribution in the breathing zone (v = 3 m/s).
Figures 12–14 illustrates the velocity distribution in the BZ at three different layers, y = 30, 50, and 70 mm, for the Reynolds numbers varies from 136 to 684. It is observed that the velocity in the middle region of the BZ is uniform but the BZ velocity increases with increase in Reynolds number. At y = 30 mm (Figure 12), the center of the berating zone velocity increases from 0.5 to 1.6 m/s. Similarly, at y = 50 mm (Figure 13), it varies from 0.4 to 1.5 m/s, and at y = 70 mm (Figure 14), it varies from 0.4 to 1.4 m/s. Thus the results reveal that velocity increases in the BZ with an increase in Reynolds number at particular layer or region, also the BZ center line velocity decreases when the distance in the BZ increase from the bottom of BZ. However, the Re = 411 is optimum and the velocity at y = 70 mm is a comfort condition for a human breathing.

Velocity distribution at 30 mm height from bottom of the breathing zone.

Velocity distribution at 50 mm height from bottom of the breathing zone.
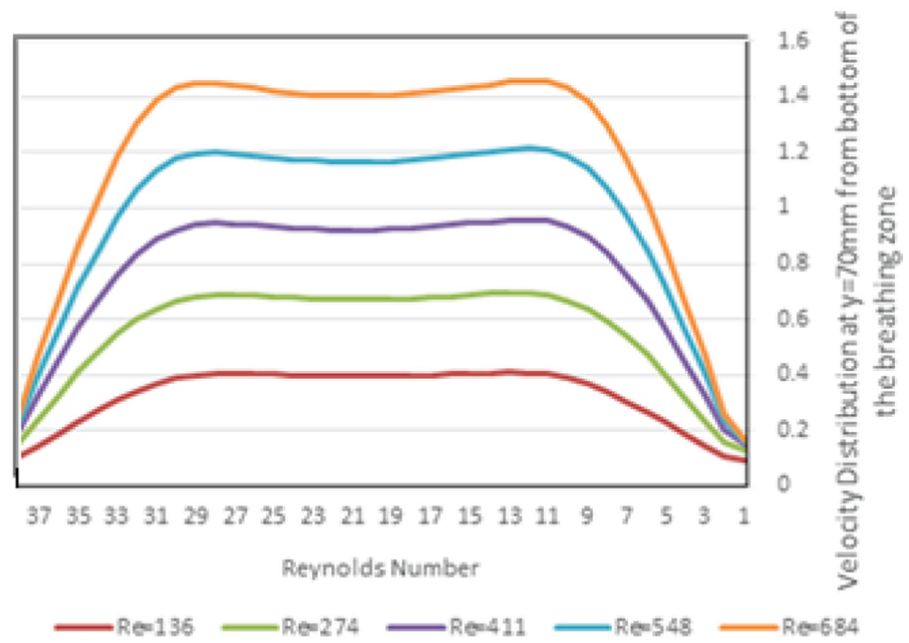
Velocity distribution at 70 mm height from bottom of the breathing zone.
Conclusion
In this study, the BZ of the human has been analyzed numerically for different Reynolds numbers 136, 274, 411, 548, and 684. The flow of air in the BZ becomes turbulent due to entrainment of ambient air even at lower Reynolds number considered in this study. The k-ε turbulent model was used to predict the turbulent parameters and control it by increasing the nozzle exit velocity. Also, the effect of barriers on both top sides of the BZ has been studied. The result reveals that the flow is unstable and non-uniform in the BZ, without the barriers, which becomes more turbulent because of more vacuum near the fixed wall or nozzle exit, and it takes more time to become stable and high velocity of the air jet is required. But the high velocity will cause discomfort for breathing for a human. It is construed from the results that the optimum velocity of 3 m/s (Re = 411) and distance y = 70 mm at which the BZ fully occupied with quality air, uniform velocity of 0.5–0.8 m/s, and thermal comfort of temperature at T b = 300 K for a human and pressure approximately 1 atm. Therefore, the barrier is required to control the entrainment and mixing of pollutants with the clean air in the BZ of human and air quality can be maintained.
Future recommendation
The optimum design data obtained from the present CFD analysis can be used to design and fabricate the personalized air curtain device. The experiment could be carried out to validate the present numerical solution. These results will be very useful toward new product development.
Footnotes
Handling Editor: SA Shehzad
Declaration of conflicting interests
The author(s) declared no potential conflicts of interest with respect to the research, authorship, and/or publication of this article.
Funding
The author(s) received no financial support for the research, authorship, and/or publication of this article.