
Abstract
An eco-driving strategy is established in this article which includes four parts, namely, initial judging model, speed prediction model based on back-propagation neural network, MATLAB curve fitting, and integral. First, based on vehicle infrastructure cooperative systems, the initial judging model is instructed and vehicle road test is conducted. Then, a speed forecast model based on back-propagation neural network had been set up using test data obtained in the previous step. Next eco-driving strategy had been specified using curve fitting based on the forecast speed data and integral in MATLAB. Finally, a verification test had been done using VISSIM simulation tool. The conclusion of the test showed that using eco-driving strategy was conducive to decrease fuel consumption efficiently when driving at intersection. This article provided a specific case in application of vehicle infrastructure cooperative system to study on fuel consumption and emission in city traffic.
Keywords
Introduction
Automobiles have become an indispensable part of people’s lives, and the exhaust generated by cars also poses a threat to the environment. Studies have shown that when vehicles are driven at urban road intersections, it is often necessary to alternate the various operating conditions of the engine, resulting in increased energy consumption and emissions.1,2 The data show that the impact of driving behavior on fuel economy can reach 30%, 3 for which American researchers took the lead in proposing the concept of eco-driving strategy. 4 The development of vehicle road coordination technology has greatly improved the accuracy and real-time performance of vehicle access road information, which makes the research of eco-driving strategy more reliable.
Researchers from all over the world have done a lot of research on eco-driving, and the use of vehicle-assisted technology is more conducive to the implementation of eco-driving strategies. The research on eco-driving strategy based on the vehicle-based synergy technology has gradually gained the attention of scholars.
Virginia Tech University scholars5,6 established an eco-driving model at the intersection, using car–road communication technology to receive the phase and timing information of the intersection signal. When the vehicle enters the communication distance range, the signal light information is received, and then the model calculates the recommended vehicle speed. In order to avoid the influence of the driver’s difference, the model assumes that the driver completely follows the operation instruction and does not consider the driver’s adaptability.
Researchers of Texas A&M University 7 used the intersection signal information and queuing time to establish an ecological driving strategy optimization model for the intersection. The optimization goal of the model is to minimize the linear combination of vehicle exhaust emissions and driving time.
A dynamic driving strategy model based on intersection traffic light information is established. The model uses the real-time traffic light information to calculate the recommended vehicle speed and helps the driver to adjust the vehicle speed to pass through the intersection in the University of California at Riverside.8–11
Researchers of Tongji University 12 proposed the dynamic eco-driving speed guiding strategy (DESGS) model using current signal lights and vehicle position information. The model consists of an ecological index calculation module and an optimization module. The eco-index calculation module estimates the fuel consumption rate of the vehicle based on the vehicle’s operating conditions; the optimization module finds an optimal control scheme with the lowest fuel consumption and CO2 emissions and meets the speed limit conditions.
Beijing Jiaotong University 13 used car–road communication to obtain traffic signal information and designed corresponding eco-driving strategy model and ecological driving trajectory optimization algorithm for a single vehicle. The MATLAB development program was used to evaluate its effectiveness, and during the establishment of the eco-driving strategy model, it was assumed that the driver agreed and followed the guidance speed 100%.
By exploring the research status of eco-driving, this article finds that the current research on eco-driving strategy is carried out on the premise that the driver completely follows the theoretical guidance, but in fact the driver’s operational behavior cannot be completely consistent with the theory. This article studies the eco-driving strategy based on the actual road test. The proposed eco-driving strategy takes into account the actual road conditions and the actual operational ability of the driver. It can provide a reference for the subsequent research on the coordinated application of the road and the ecological driving strategy.
Vehicle road test at intersection based on vehicle infrastructure cooperative system
Initial judging model of eco-driving strategy
According to the eco-speed planning algorithm proposed by the University of California Riverside scholars, 8 in order to ensure that there is no idle speed through the intersection, the vehicle should try to drive within the green phase of the signal light. The vehicle receives the signal information SPaT (Signal Phase and Timing) when the distance from the intersection signal is d, 14 according to the information of the traffic light, the time period during which the vehicle can pass through the intersection without idling is shown in Figure 1.

Period vehicle could cross intersection.
Based on the current signal lights and vehicle speed information, an initial judgment model for the eco-driving strategy that allows the vehicle to pass through the intersection without idle is established, as shown in Figure 2.

Initial driving strategy model.
Parameters of test
The total length of the test section is 230 m, and the signal light is located 220 m away from the starting point of the test section; 15 the phase of the test signal is two phases, the signal period is 76 s, and the green light phase time of the east-west section is 33 s, the red light phase time is 40 s, north-south had the opposite phase, and yellow phase was 3 s. The signal light information in the test SPaT scheme settings are shown in Table 1.
Traffic light information plan.

In the test, the maximum speed limit of the vehicle is 70 km/h, and the initial speed v0 is 30, 40, 50, 60, and 70 km/h.
After the initial vehicle speed v0 and the traffic light information SPaT scheme are arranged and combined, five untested driving strategy tests are repeated, that is, 5 × 8 × 5 = 200 groups of tests; 10 times have initial driving strategy tests, that is, 5 × 8 × 10 = 400 sets of tests. In order to prevent the driver from remembering the inertia operation of the test sequence, it is necessary to perform the test in disorder, and the tester needs to record the test sequence.
Test parameters above are input into the initial judgment model of the driving strategy shown in Figure 1, and the initial driving strategy under the corresponding test conditions is obtained.
Process of test data
Speed data
According to the test results, the driving strategy initial judgment model is divided into a uniform driving strategy, an accelerated driving strategy, and a deceleration driving strategy. Figure 3 shows the change in vehicle speed in the uniform velocity group (v0 = 70 km/h) with or without the eco-driving initial strategy. It can be seen from the figure that in the uniform speed group test scheme, the vehicle can pass the intersection at the current speed without the initial driving strategy, when the driving speed is about 70 km/h, the fluctuation range is smaller, and the speed of the vehicle changes relatively more smoothly. This is mainly because the driver can know the signal information in advance under the prompt of the initial driving strategy, so that the measures can be taken in advance and the driving operation is more stable.

Speed changing rules of constant speed (v0 = 70 km/h) with tips and no tips.
Figure 4 shows the speed of the acceleration group in the presence or absence of an eco-driving strategy. It can be seen from the figure that the speed of the vehicle with the initial judgment of the driving strategy is lower than that of the vehicle without the initial driving strategy, and the acceleration of the vehicle is smaller. This is mainly because the driver can judge the current driving situation according to the information when the signal information is acquired in advance, so as to adopt a more appropriate driving manipulation behavior.

Speed changing rules of acceleration with tips and no tips.
Figure 5 shows the speed change diagram of the deceleration group with or without the eco-driving initial judgment strategy. As can be seen from the figure, in the deceleration experiment group, the eco-driving strategy suggests that the vehicle slowly decelerates to the intersection and finally waits for idle stop. In the actual driving process, because the driver knows the status of the signal light in advance, it may lead to emergency braking to the intersection, which will lead to a sharp increase in fuel consumption and emissions; on one hand, this will lead to a sharp increase in fuel consumption and emissions, and on the other hand, it will increase the driver’s waiting time at the intersection, which is unfavorable for eco-driving.

Speed changing rules of deceleration with tips and no tips.
According to the data analysis of the above three types of test groups, in order to avoid unnecessary idle stop and acceleration and deceleration of the vehicle at the intersection, an eco-driving strategy should be adopted.
Fuel consumption data analyses
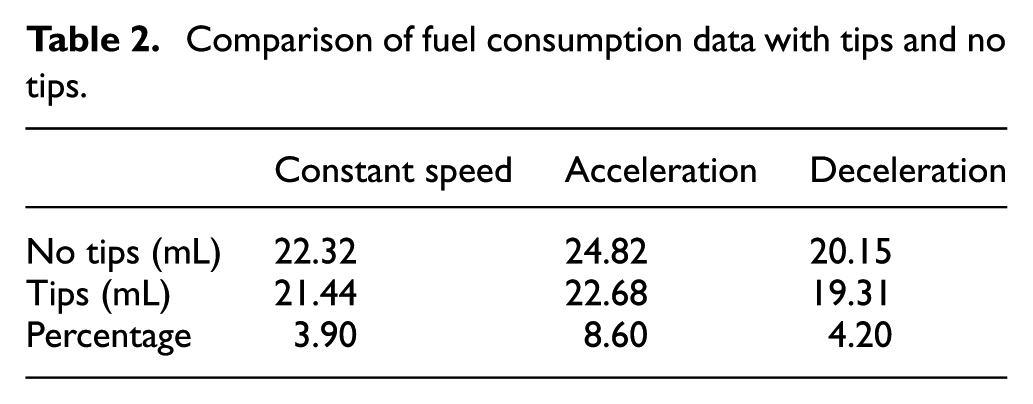
Table 2 shows the comparison of fuel consumption data under the initial judgment model of eco-driving strategy. It can be seen from Table 2 that the adoption of the eco-driving initial judgment strategy can reduce the fuel consumption of the test vehicles of the constant speed group, the acceleration group, and the deceleration group by 3.9%, 8.6%, and 4.2%, respectively. It can be seen that the study of ecological driving strategies at urban road intersections is of great significance in fuel economy.
Comparison of fuel consumption data with tips and no tips.
Eco-driving strategy modeling
Eco-driving strategy model
The model is mainly composed of four parts: the initial judgment model of driving strategy, the vehicle speed prediction model based on back-propagation (BP) neural network, curve fitting and integral calculation, and simulation analysis. The eco-driving strategy model is shown in Figure 6.

Eco-driving strategy model.
The driving strategy initial judgment model is based on the model input variables, and it is judged that the situation should adopt a uniform speed, acceleration or deceleration driving strategy, as shown in section “Initial judging model of eco-driving strategy.”
Speed prediction model based on BP neural network
If the judgment result is uniform speed, then the uniform driving is output as the eco-driving strategy; otherwise, according to the result of the judgment, the corresponding acceleration/deceleration-type BP neural network-based vehicle speed prediction model is selected for the vehicle speed prediction.
In the test, the factors that characterize each set of test characteristics and affect the vehicle speed include the signal light SPaT, the test start distance from the signal light d, and the initial vehicle speed v0. Therefore, the input layer nodes of the vehicle speed prediction model based on BP neural network15,16 are tg, d, and v0.
In the acceleration class and deceleration class prediction models, the number of output nodes should be the number of data of the test group with the largest number of data in the model. Therefore, by comparing the experimental data, it is determined that the output nodes of the accelerated class prediction model are 19 and the output nodes of the deceleration class prediction model are 28. If the number of test data is less than the number of determined output nodes, the data are supplemented with –1 to make it the same as the number of output nodes. When modeling with MATLAB, replace all –1 in the data with nan, so that the length of the data is unified without changing the data.
In this article, we choose the implicit layer transfer function as tansig, the output layer transfer function as purelin, and the trainlm function as the training function. 17
Considering the running time and prediction accuracy, this article chooses the double hidden-layer network structure for prediction, and the learning rate is 0.05. 18
Figure 7(a) and (b) shows the predicted vehicle speed and actual vehicle speed comparison for the acceleration and deceleration models, respectively. It can be seen from the figure that the predicted vehicle speed based on the BP neural network is consistent with the actual vehicle speed, so the predicted vehicle speed can be used for curve fitting and integral calculation.

Comparison of forecast speed and actual speed of (a) acceleration and (b) deceleration groups.
MATLAB curve fitting and integral
Curved fitting based on the obtained predicted vehicle speed to obtain the v–t curve of acceleration/deceleration. When the driving strategy is decelerated, the fitting curve is obtained and then integrated. If the vehicle cannot travel through the intersection, the deceleration curve is output as an eco-driving strategy; if the vehicle can decelerate through the intersection, continue to integrate the fitting curve to obtain a variety of driving strategies.
When the driving strategy is initially accelerated, after the fitting curve is obtained, the curve is integrated. If the vehicle can accelerate through the intersection, continue to integrate the curve to obtain a variety of driving strategies; if the vehicle cannot pass the intersection, the deceleration-like BP neural network speed prediction is performed for the situation.
The analysis is carried out with v0 = 40 km/h and the remaining time of green light 5 s as an example. First, based on the BP neural network, the predicted vehicle speed is MATLAB curve fitting, 19 and the curve is integrated into the t-axis to obtain the driving distance of the vehicle in the integration period. As shown in Figure 8, the fitting equation is shown in formula (1).


v 0 = 40 km/h, tg = 5 s, and fitting curve integral based on forecast speed.
The result of formula (1) was calculated as

v 0 = 40 km/h, tg = 5 s, and fitting curve integral of eco-driving strategy.
Verifying test of eco-driving strategy
Using VISSIM simulation software to simulate and analyze the various driving strategies obtained in the previous step, 20 the fuel consumption of each driving strategy is obtained, and the driving strategy with the least fuel consumption is found as the ecological driving strategy output.
First, the simulation section and signal information are set in VISSIM, the path length is 230 m, and the signal light is located 220 m away from the starting point of the road section. The case where v0 = 40 km/h and the remaining time of the green light is 5s is taken as an example. The comparison between the VISSIM simulation test vehicle speed and the real vehicle test eco-driving strategy vehicle speed is shown in Figure 10. It can be seen from the figure that the speed of the eco-driving strategy under the simulation experiment is lower than the actual vehicle test data, and the speed change is more gradual.

v 0 = 40 km/h, tg = 5 s, and comparison of eco-driving strategy and vehicle driving strategy.
In the VISSIM node evaluation file, the fuel consumption is 0.09 gal/100 km. Since the number of vehicles in the parameter setting is 9, the fuel consumption of the bicycle driving through the simulation section is calculated to be 16.46 L/100 km, and the same test preconditions and conditions. Under the vehicle, when the vehicle does not adopt the eco-driving scheme, the fuel consumption of the bicycle simulation obtained by the VISSIM simulation model is 17.68 L/100 km. The calculation shows that the eco-driving strategy can reduce the fuel consumption of the vehicle by 6.93% compared with the non-environmental driving strategy.
Conclusion
Based on the theory of vehicle infrastructure cooperative system (VICS), eco-driving strategy was built and applied in vehicle road test and simulation, and the conclusions were as follows:
When vehicle gets close to intersection, driving according to eco-driving strategy can make speed more stable than without tips;
By comparing fuel consumption tests, eco-driving strategy could help decrease fuel consumption by means of 5.56% than without tips;
When vehicle has to stop with idling at intersection, waiting time could be cut down efficiently with eco-driving strategy.
Footnotes
Handling Editor: Hai Xiang Lin
Declaration of conflicting interests
The author(s) declared no potential conflicts of interest with respect to the research, authorship, and/or publication of this article.
Funding
The author(s) disclosed receipt of the following financial support for the research, authorship, and/or publication of this article: This research was supported by the Science and Technology Project of Department of Education in Jilin Province (JJKH20170809KJ) and the Changbai Mountain Scholars Program in Jilin Province (440020031167).