
Abstract
This article presents the design for a sustainable reverse supply chain network for remanufacturing the proton-exchange membrane fuel cell used in hydrogen vehicles. An optimization model with multiple objectives is proposed. In this article, a multi-objective optimization model is proposed and used to design a near-optimal reverse supply chain network that satisfies economic, environmental, and societal objectives, which are combined into one multi-objective function. An end-of-life proton-exchange membrane fuel cell battery collection in Riyadh city is the subject of the designed network. This model is found to be capable of choosing collection centers (drop-off) from a set of available centers and selecting a facility location for the remanufacturing plant. The model also serves as a tool to carry out analyses under different scenarios, as well as future changes in the factors that influence the designed reverse supply chain network, such as the hydrogen tax credit and the CO2 emissions cap. The output of this research facilitates the transition from oil-dependent to renewable energy transportation by providing a solution for its end-of-life products. The output of this article is considered as preparedness plan to help countries who seek transition from oil-dependent transportation to a system that uses renewable energy.
Introduction
The necessity of living in a sustainable world cannot be overemphasized. The need to sustain economic, environmental, and societal development in a balanced manner has become a default requirement in every future plan or initiative. The awareness toward sustainability is not only found among the elite but also among the majority of people who have enough awareness to evaluate and judge new developments and initiatives. The need for sustainability touches everyone’s daily activities, such as fuel economy and energy-saving light bulbs.
Energy is a major sustainability concern; oil has been the main source of energy for decades. Oil reserve depletion and the increase in worldwide energy demand have motivated the use of alternative renewable sources of energy. The automotive industry strives to introduce vehicles that run on renewable energy. Electric, hybrid, and hydrogen cars are successful examples of products that use renewable energy. The number of alternative fuel cars is expected to increase over the coming decades. Foster et al. 1 estimated that the number of electric vehicles in the United States by the year 2035 will range between 1376 million (a pessimistic forecast) and 6759 million (an optimistic forecast). Similar conclusions can be drawn about the hydrogen vehicle market.
The demand for hydrogen vehicles is expected to grow; currently, there are only three models available in the market for purchase: the Toyota Mirai, the Honda Clarity, and the Hyundai Tucson. In the coming years, the number of hydrogen car models is expected to jump. 2 Hydrogen cars use a fuel cell battery that uses hydrogen to produce electrical power through an electrochemical reaction. The reaction uses platinum (a rare earth metal) as a catalyst. Due to this fact and other potential benefits, end-of-life (EoL) battery recovery has proven feasible. 3 Remanufacturing is one of the recommended recovery options.
Potential recovery options for proton-exchange membrane fuel cell (PEMFC) were studied in research conducted by Ziout et al. 3 Recovery of a PEMFC is motivated by preserving natural resources (platinum) and increasing the financial profit. Extended producer responsibility (EPR) is a strategy for product recovery. 4 In the case of hydrogen cars that run on PEMFCs, future legislation regarding EPR could be a force and motivation to consider PEMFC battery recovery. According to the BS 8887-220:2010 definition of remanufacturing, the battery is brought to an almost new state and is sold with a warranty similar to that of a new battery. Though remanufacturing is appealing from the point of resources conservation, remanufacturing also requires the use of new resources. One example of that is the transportation used to collect the EoL products.
Many studies have focused on the optimal design for a reverse logistics network. Plenty of literatures on reverse supply chain (RSC) have focused on the economic aspects of the network, that is, designing a RSC network to minimize the network financial cost. A better design for a RSC network would be the one that considers sustainability pillars, namely economic, environmental, and societal aspects. Balanced consideration of these three aspects maintains the sustainability of a RSC network and contributes to sustainable development at large. This article provides a model that combines the abovementioned three pillars of sustainability and addresses a specific geographical region, the capital city of Saudi Arabia. This study was funded by the King Saud University to assess the potential for handling energy products at their EoL, specifically the PEMFC stack.
The following section reviews literature related to network design in reverse logistics. The gap addressed by this article is identified based on the reviewed literature. The section “Case study background” explains the case study background. The section “Reverse logistics system structure and the mathematical model” addresses the problem formulation, while results are shown and discussed in section “Computational results.” Finally, the section “Discussion” summarizes the conclusions of this research.
Literature review
Different surveys and studies have discussed RSCs from different perspectives. Jun et al. 5 reviewed product lifecycle management. Three phases were identified: beginning of life (BoL) that includes both production and design, while the middle of life (MoL) spans maintenance, services, logistics (distribution), and final use. Final phase was identified as EoL, and it covers reverse logistics (collecting), reuse, recycling, remanufacturing, and finally disposal. Kumar and Putnam 6 conducted a study that focused on consumer appliances, automotives, and electronics, and they pinpointed the motivations for these industries to close the supply chain loop in their product lifecycle. Kumar and Craig 7 conducted strengths, weaknesses, opportunities, and threats (SWOT) analyses to analyze Dell’s closed-loop supply chain. They found that Dell’s reverse logistics is motivated by the reduction in their product lifecycle environmental impacts. Usually, RSC and closed-loop supply chains are environmental friendly, but some of their processes could be polluting. 8 Feitó-Cespón et al. 9 advocated for proper balance between economic, environmental, and societal aspects of a RSC. Economic aspects are the most often considered, environmental issues come next, and the societal component is studied the least. 10
Early research on RSC has optimized the network design from a single-objective perspective, namely cost optimization, to decide on issues related to long-term aspects such as facility capacity and its location, and this translated into configurations and structures. Elkington 11 studied the return flow and forward flow to model and optimize the supply chain, and the capacity limit was not included. That study was followed by other studies that considered the capacity limit. Inderfurth 12 considered equal lead times, stochastic uncertainty, and stationary demand to optimize integrated reverse logistic system. Jayaraman 13 uses an optimization model for a reverse supply system with remanufacturing and reuse options, assuming deterministic demand, a zero lead time, and known return. Chouinard et al. 14 used heuristic optimization approach to design RSC. The potential reuse was included in the model. Niknejad and Petrovic 15 optimized a production planning and inventory control problem of an integrated reverse logistics system, which consists of a generic problem and includes remanufacturing and repair as recovery routes, a forward production route, and a disposal route. The disposal is characterized by multi-period, multi-quality levels, different lead times, uncertainty in demand, return qualities, and return quantities. Barker and Zabinsky 16 provided a multi-criteria decision making solution for reverse logistics, and analytical hierarchy process was used for designing reverse logistics networks in their study. Chuang et al. 17 studied products that have volatile demand and short lifecycle, such as high-tech products. Closed-loop supply chain was modeled. The model was used to assess the manufacturer’s optimal production quantities, product take-back law, cost structures, implementations, and profits under three alternative reverse channel structures. The three alternatives considered in their study were (1) EoL product collected by the manufacturer, (2) EoL product collected by the retailer who collects the used product for the manufacturer, and (3) EoL product collected by the subcontracts and then shipped to a third-party partner.
Recent research in RSCs has focused on sustainable network designs that consider the sustainability aspects of the network. However, the RSC network design problem is an infrastructure issue. RSC management is interested in strategic and tactical decisions regarding determination of the facilities issues, such as its location, configuration, their optimal number, and implemented technology in such facilities. Other interests of RSC management are quantity issues, such as inventory, distribution, production quantity, and shipments. Optimization is therefore implemented to optimize both customer satisfaction and the chain value. 18 Kannan et al. 19 incorporated the impact of the carbon footprint on the reverse network design, while Krikke 20 assessed the carbon footprint of a variety of closed-loop network configurations. Kilic et al. 21 designed a reverse logistic network for the waste electrical and electronic equipment (WEEE) product in consideration of the compulsory recycling rate imposed by the WEEE directive. Furthermore, Gu et al. 22 confirmed that price, convenience, and canonical motivations determine consumers’ involvement in a RSC. Regarding sustainability, Soleimani et al. 23 addressed design problems in sustainable RSC networks. A network of manufacturers, suppliers, customers, distribution centers, return centers, warehouse centers, and recycling centers was modeled in their study. The problem considered three choices: product recycling, components recycling, and raw material recycling. The objective was to maximize customer’s satisfaction through being responsive for their demand. In this model, lost hours due to accidents, environmental benefits, and economical profit were integrated in their optimization model.
Multi-objective functions optimization is often used to model RSC problems, and these models are linked with green, sustainable, environmental, and resilience objectives. Dekker et al. 24 performed one of the early studies that paid attention to appropriate societal and green-based objectives in RSC design and analyses. In addition, Ramos et al. 10 proposed a multi-objective mathematical model to represent multi-depot periodic vehicle routing problem, and they also included routes between depots to support decision makers in collection system for recyclable waste. Their model determines depots; vehicles; and containers parameters such as the location, number, and schedule.
The work in this article addresses a specific case study with unique characteristics that differentiate this work from previous research. In addition, this research models the network design problem under a constraint that was absent in previous models, that is, satisfying social responsibility and corporate citizenship at the expense of economic profitability. Moreover, the combination of factors that influence the network design is reflected in the actual case study’s parameters, which are determined by the network stakeholders. This is also different from any previous study. It is worth mentioning that this work uses, for the first time, through Google Maps, actual traveled distances between the sources of demand, collection centers, and remanufacturing plants, which is an advantage over models that use the shortest distance. This feature improves the usefulness of this work.
Case study background
Product of the study: PEMFC
The subject of this study is the fuel cell stack produced for General Motors (GM) hydrogen car. Among a range of produced stacks, the 80-KW stack is selected and then disassembled into its main components, which are detailed in Table 1. The main modules in the hydrogen car power system are oxygen supply, hydrogen supply, fuel cell stack, and cooling system. These modules provide the required power to drive the hydrogen car.
List of PEM fuel cells stack components.
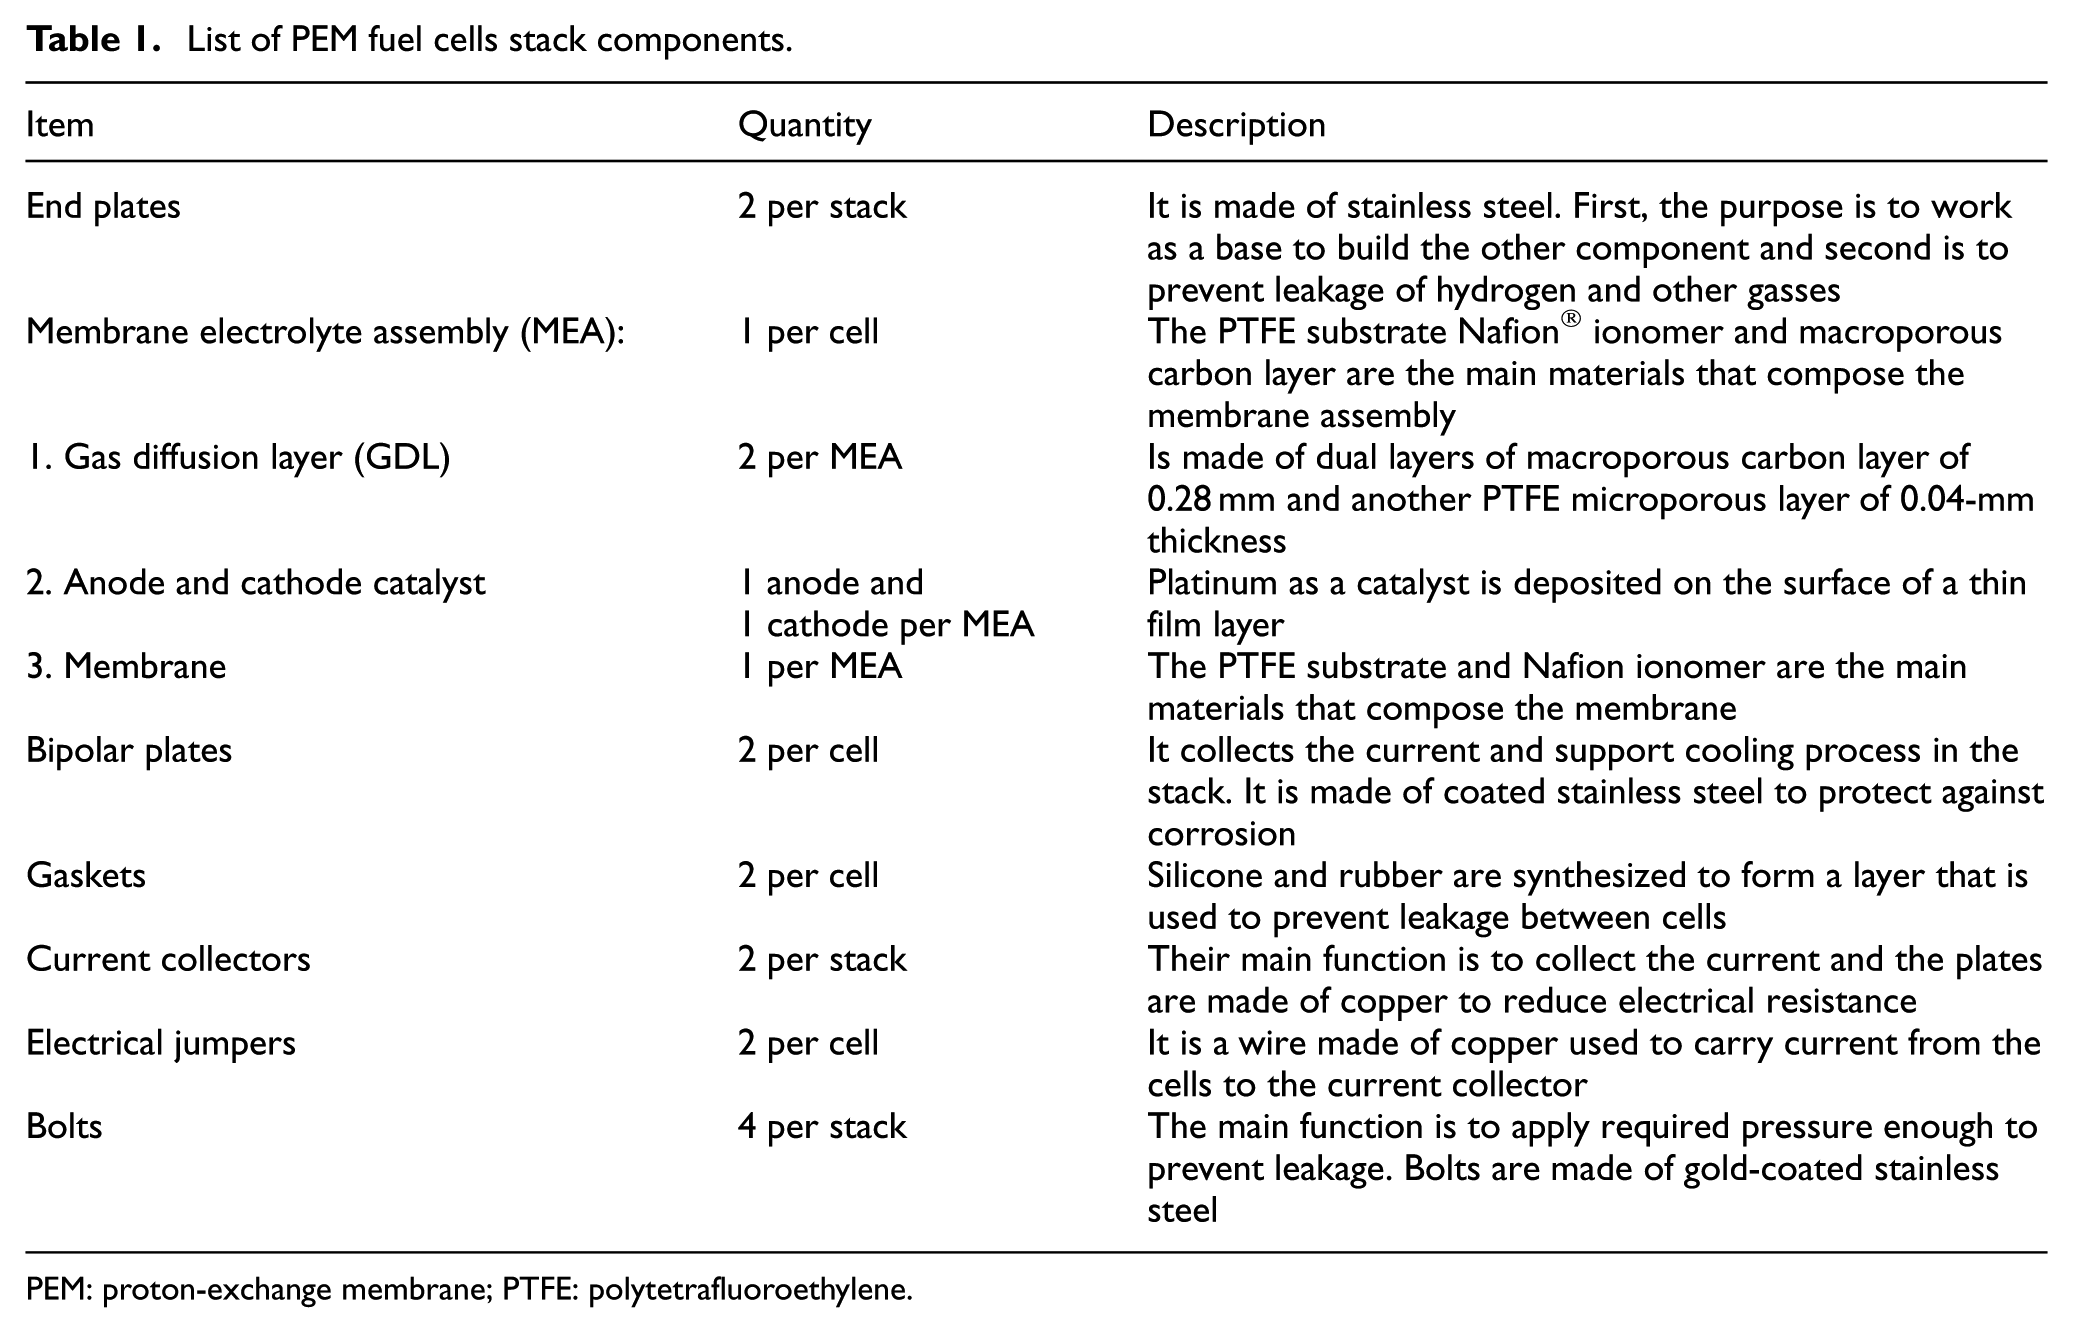
PEM: proton-exchange membrane; PTFE: polytetrafluoroethylene.
Fuel cell stack is a critical module in the power system and is considered as the limiting factor for the power system’s useful life. This research focuses on proton-exchange membrane (PEM) fuel cell type. Many features in this type of fuel cells make it attractive for remanufacturing. This aligns with automakers’ strategies regarding renewable energy and resources sustainability. GM is a leader in this respect.
Fuel cells stack’s working principle
Identical fuel cells are replicated to produce a stack of fuel cells. Each cell produces electric current which is collected through current collectors and added up to feed the electric motor, which in turns provide the driving power. Figure 1 shows the working principle of the fuel cell. The hydrogen atoms are decomposed into free electron and a proton. The decomposition process is facilitated by the presence of platinum as a catalyst. Two major chemical reactions describe the working principle:
Anode reaction: hydrogen decomposed into proton and electron, and the proton moves through the membrane toward the cathode, while the electron is collected through current collectors and transferred to the cathode.
Cathode reaction: the oxygen atoms, the proton, and the collected electron are combined together to produce H2O. This reaction is facilitated also with the presence of platinum as a catalyst.
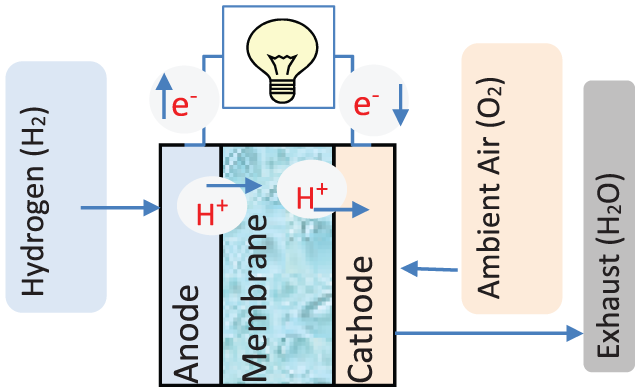
Working concept of the fuel cell.
The released electrons at the anodes of each fuel cell make up the collected current that passes through the car motor. It is worth mentioning that input and output of these reactions involve renewable and harmless materials, basically hydrogen, oxygen, and water.
Fuel cell stack EoL
In concept, the fuel cell stack can live infinite life, yet the useful life is limited by two major factors:
Catalyst performance: platinum starts showing decrease in its performance as a catalyst after mainly 2 years of normal use of the car. Practically, the useful life for a fuel cell in a hydrogen car is between 4 and 6 years of normal use.
Car’s useful life: average car useful life is 10 years. Hence, the fuel cell stack useful life would be limited to the useful life of the product where it is installed in, in this case, a life of 10 years. Regardless of how long the research can improve the fuel cell useful life, it is limited by the car’s useful life.
EoL recovery for fuel cell stack is prompted by the above two limiting factors. In addition, the extensive use of platinum, which is a scarce material, makes fuel cell recovery at its EoL a need.
Stack components
The required output determines how many cells should be included in the fuel cell stack, more cells give more power. The subject of this study is a stack with 200 cells. Table 1 shows stack items with their description. This list is based on published data found in James and Spisak. 25
Geographical region of the study: Riyadh city, capital of Saudi Arabia
Riyadh, the capital of Saudi Arabia, is a very crowded city. There are 2,642,504 registered vehicles according to the 2015 records. Since the country is one of largest oil producers, the government subsidizes its energy needs. Apart from the Riyadh train that is planned to be running by 2020, the city lacks a sufficient public transportation system. Due to these facts, the ratio of the number of cars to the number of people is high (0.46 cars per capita). The people of Riyadh mainly depend on their own cars for commuting. The country is going through a transition period from total dependency on oil to other sustainable sources of energy.
The studied geographical region is Riyadh city, the capital of Saudi Arabia, one of the world’s largest oil producers. This study aims to help the country establish the infrastructure required to achieve its announced 2030 vision. This vision requires a reduction in the dependency on oil as an energy source and a move toward renewable resources. The outcome of this article is considered a future preparedness plan to help achieve the country’s 2030 vision.
The city is divided into 16 geographical regions; each region is considered as a source for an EoL battery. The collection centers are assigned to SACO stores located all over the city. SACO is a multi-purpose store that has branches throughout the whole country. SACO’s management agreed to participate in the study and commit to its findings. Data related to costs and capacity were taken directly from SACO. The potential locations for remanufacturing plants are restricted by designated industrial zones identified by the city. There are three industrial zones that are managed by the Saudi Industrial Property Authority (MODON), which provided the cost data on the potential plant.
Reverse logistics system structure and the mathematical model
In this article, a multi-objective mixed integer linear model is proposed to design the reverse logistic network at hand, which represents a recovery supply chain network. The developed model’s main goal is to minimize the reverse logistic network costs, including environmental factors (CO2 emission) and social aspects (number of job openings), and to maximize the social benefits.
The multi-objective function of the developed model minimizes costs, including collection, transportation, fixed costs for opening collection centers and remanufacturing plants, and CO2 emissions. The model is also intended to maximize the social benefit in a multi-echelon reverse logistic network, as shown in Figure 2.

Reverse logistic network.
The model decides which collection center to open for collecting used products and the location of the remanufacturing plant. The distance between the demand source market and potential collection centers, as well as the potential location for the remanufacturing plant, is fixed and known (calculated using Google Maps). The CO2 emissions are directly proportional to the distance traveled (fuel consumption) during the collection and transportation processes. This network consists of 19 demand points, 24 collection centers, and two locations for remanufacturing plants. These nodes altogether consist the initial design of the network. The model is expected to provide near-optimal design. The following assumptions were considered in developing the model.
Assumptions
A1: Only one remanufacturing plant is needed with a known location and capacity.
A2: Single item.
A3: All the collected products will be transported to the remanufacturing plant for further processing.
The used notations, decision variables, and the model’s mathematical formulation are highlighted below.
Nomenclature of the mathematical model

Objective function


The objective function
The objective function
The objective function
Constraint (1) enforces the collection of all available units in each demand source market.
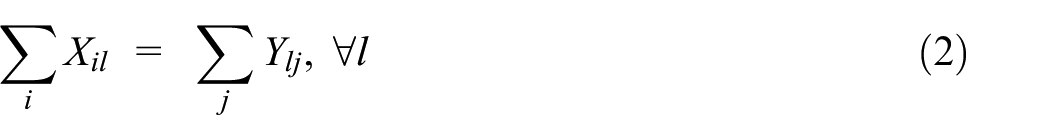
Constraint (2) ensures that the collected products are transported to the remanufacturing plant.
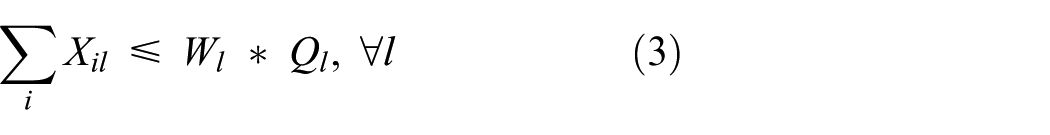
Constraint (3) is the capacity constraint of the collection centers.
Constraint (4) is a capacity constraint of the remanufacturing plant.
Constraint (5) means binary nature of decision variables is ensured.
Constraint (6) maintains restriction on non-negativity of the decision variables.
Figure 3 shows the model’s structure with its input and output.

The structure of the proposed model.
Computational results
In this section, the proposed model is used to design the PEMFC’s reverse logistic network. Three scenarios are assumed to estimate the availability of the EoL PEMFC battery; the scenarios are within the International Energy Agency’s forecast for the hydrogen car for the period from 2015 to 2050. IHS Automotive 2 estimates that the use of conventional vehicles will drop to less than 10%, while hydrogen car usage will increase to 30%.
The proposed scenarios are as follows:
Optimistic scenario based on 10% of the total number of vehicles in the city being hydrogen cars.
Mid-range scenario based on 5% of the total number of vehicles in the city being hydrogen cars.
Pessimistic scenario based on 0.1% of the total number of vehicles in the city being hydrogen cars.
In order to estimate the availability of the product demand, Riyadh city is divided into 16 geographical regions according to the administrative divisions set by the Riyadh municipality; also, the expected life of the battery is estimated to be 5 years. Table 8 (Appendix 1) shows the annual expected number of EoL batteries from each region. This number is denoted as ri = return from source market i.
Table 9 (Appendix 1) shows the transportation cost and remanufacturing plant input parameters. Two transportation methods are considered based on what is commonly used in the city; one between the demand source to collection centers using a small pickup and the use of a small truck between the collection centers and the remanufacturing plant. Then, the transportation cost and CO2 emissions for the selected transportation method are calculated. Table 10 (Appendix 1) demonstrates the input parameters for the potential collection centers; they are based on the data provided by SACO. Tables 11 and 12 (Appendix 1) list the distance between the source market and the collection centers, as well as the distance between the collection centers and the potential remanufacturing plants. All distances are actual (based on the route the vehicle will follow) and were obtained using Google Maps.
Solution approach
When dealing with multi-objective optimization, there are several optimal solutions for the individual objective functions; however, there is no optimal solution that simultaneously optimizes all the objective functions.
Therefore, we need to generate a set of efficient Pareto solutions (Pareto frontiers). The feasible solution for the multi-objective optimization problem is considered an efficient Pareto solution if there are no other improving feasible solutions. The problem is shown as

where S is the feasible solution space.
We used, as a solution approach for multi-objective optimization, the well known and most effective ε-constraint method. For more information regarding the ε-constraint method, please refer to Mavrotas. 26
The problem can be expressed as

s.t.

The efficient solutions to the multi-objective optimization problem are obtained by the parametrical variation in the right-hand side (RHS) of the constrained objective function
We started by optimizing the higher priority objective function (minimizing the transportation cost) by obtaining Min z1, and then, we optimized the second objective function after adding the constraint Min z1 to maintain the optimal solution of the first objective function (transportation cost) to obtain Min z2 as an optimal solution (CO2 emission). We performed the same for the Max z3.
After calculating the payoff table, we divided the ranges of the objective functions to 10 equal intervals and used the 10 grid points as the values of
Results
The augmented ε-constraint method was used to solve the proposed model. The General Algebraic Modeling System (GAMS) was employed to generate Pareto solutions. For each demand scenario mentioned above, a network design was obtained under two cases:
Case 1: multi-objective optimization design, where economic, environmental, and societal objectives are sought simultaneously. In another words, we optimized the three objective functions—economic, environmental, and social (z1, z2, and z3).
Case 2: single-objective optimization design, where only the economic objective (z1) is optimized.
We solved six different instances of the model and obtained results for the location. Then, we collected quantities of both the collection centers and the remanufacturing plant. We solved each scenario as a multi-objective optimization (Case 1) or as a single-objective optimization (Case 2). The results are shown in Tables 2–7.
Collected items from source demand to collection centers based on optimistic scenario under Case 1.

Collected items from source demand to collection centers based on optimistic scenario under Case 2.

Collected items from source demand to collection centers based on mid-range scenario under Case 1.

Collected items from source demand to collection centers based on mid-range scenario under Case 2.

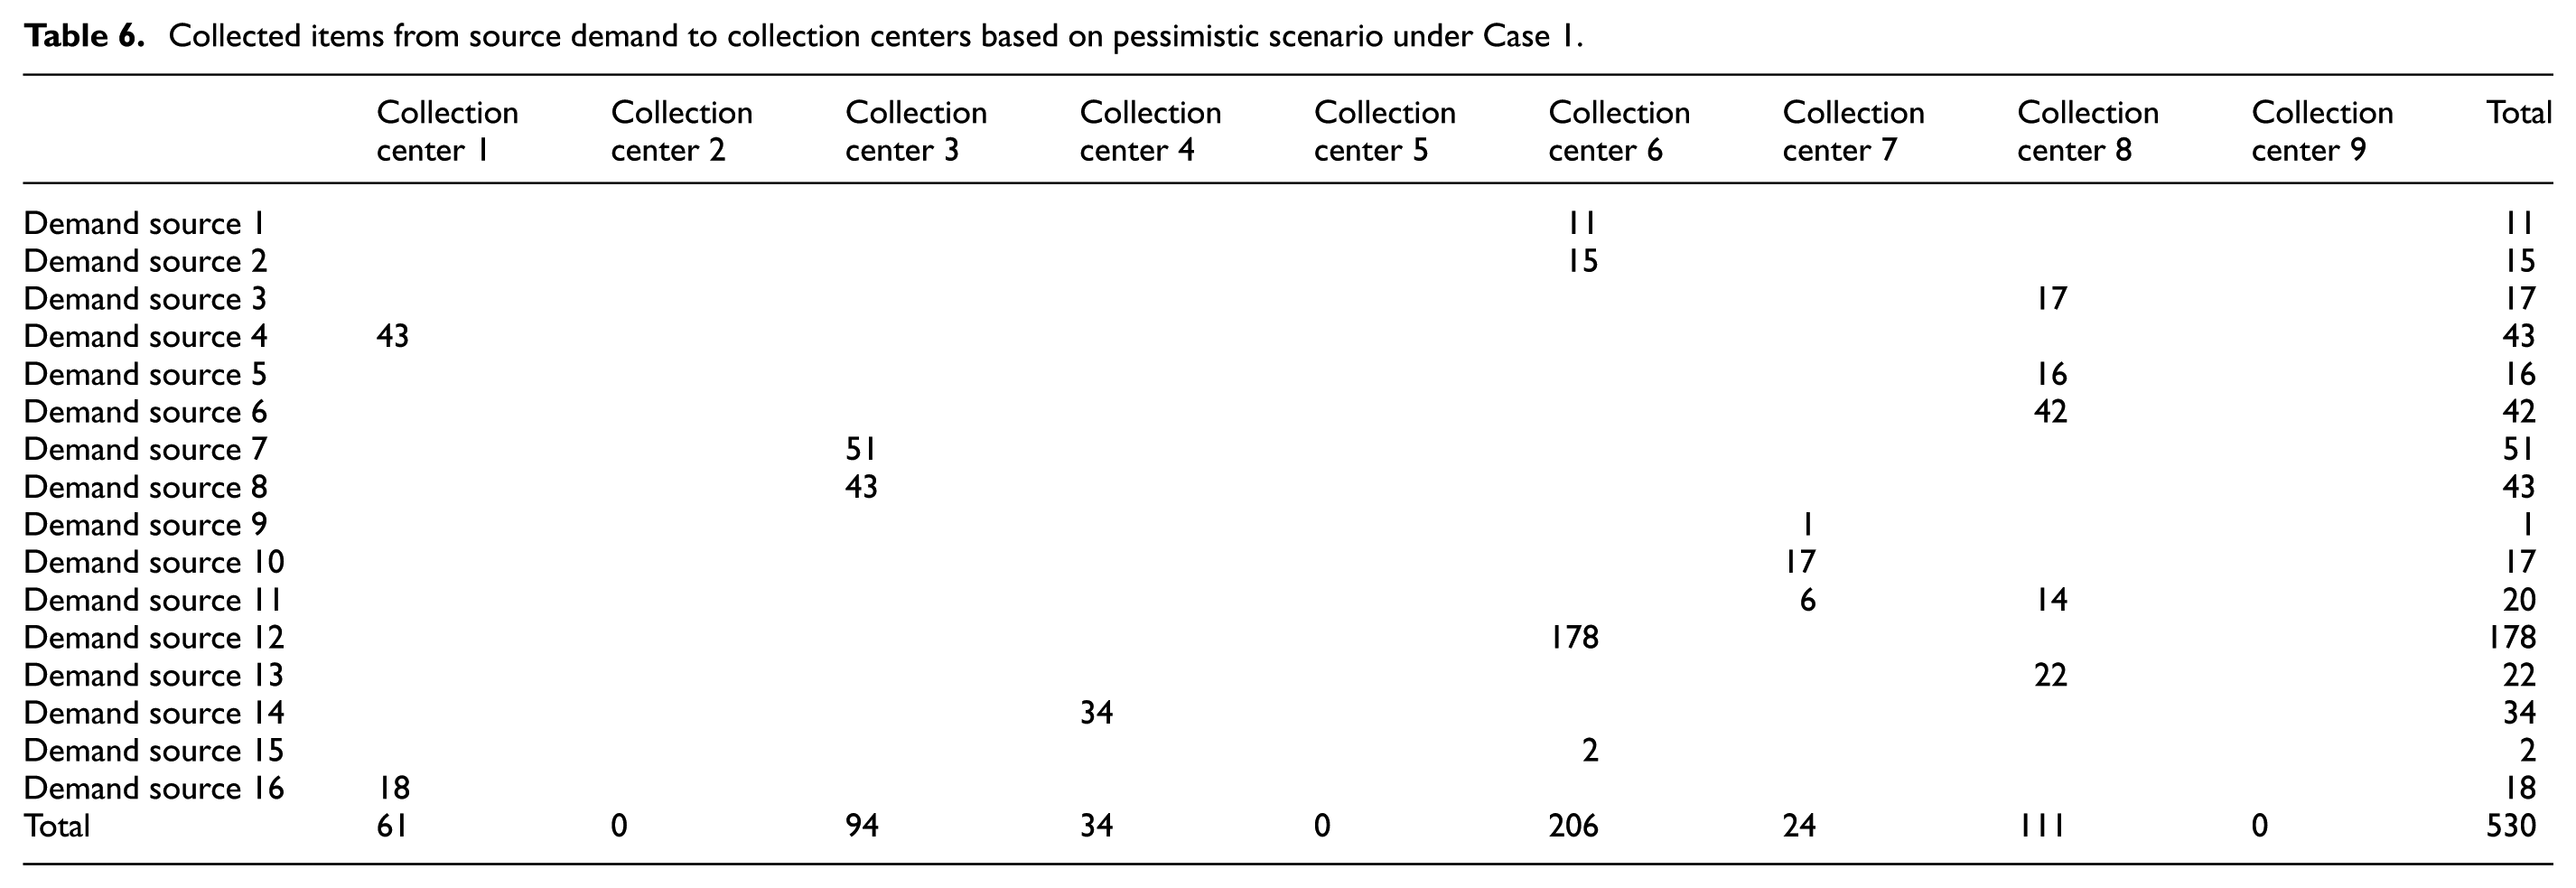
Collected items from source demand to collection centers based on pessimistic scenario under Case 1.
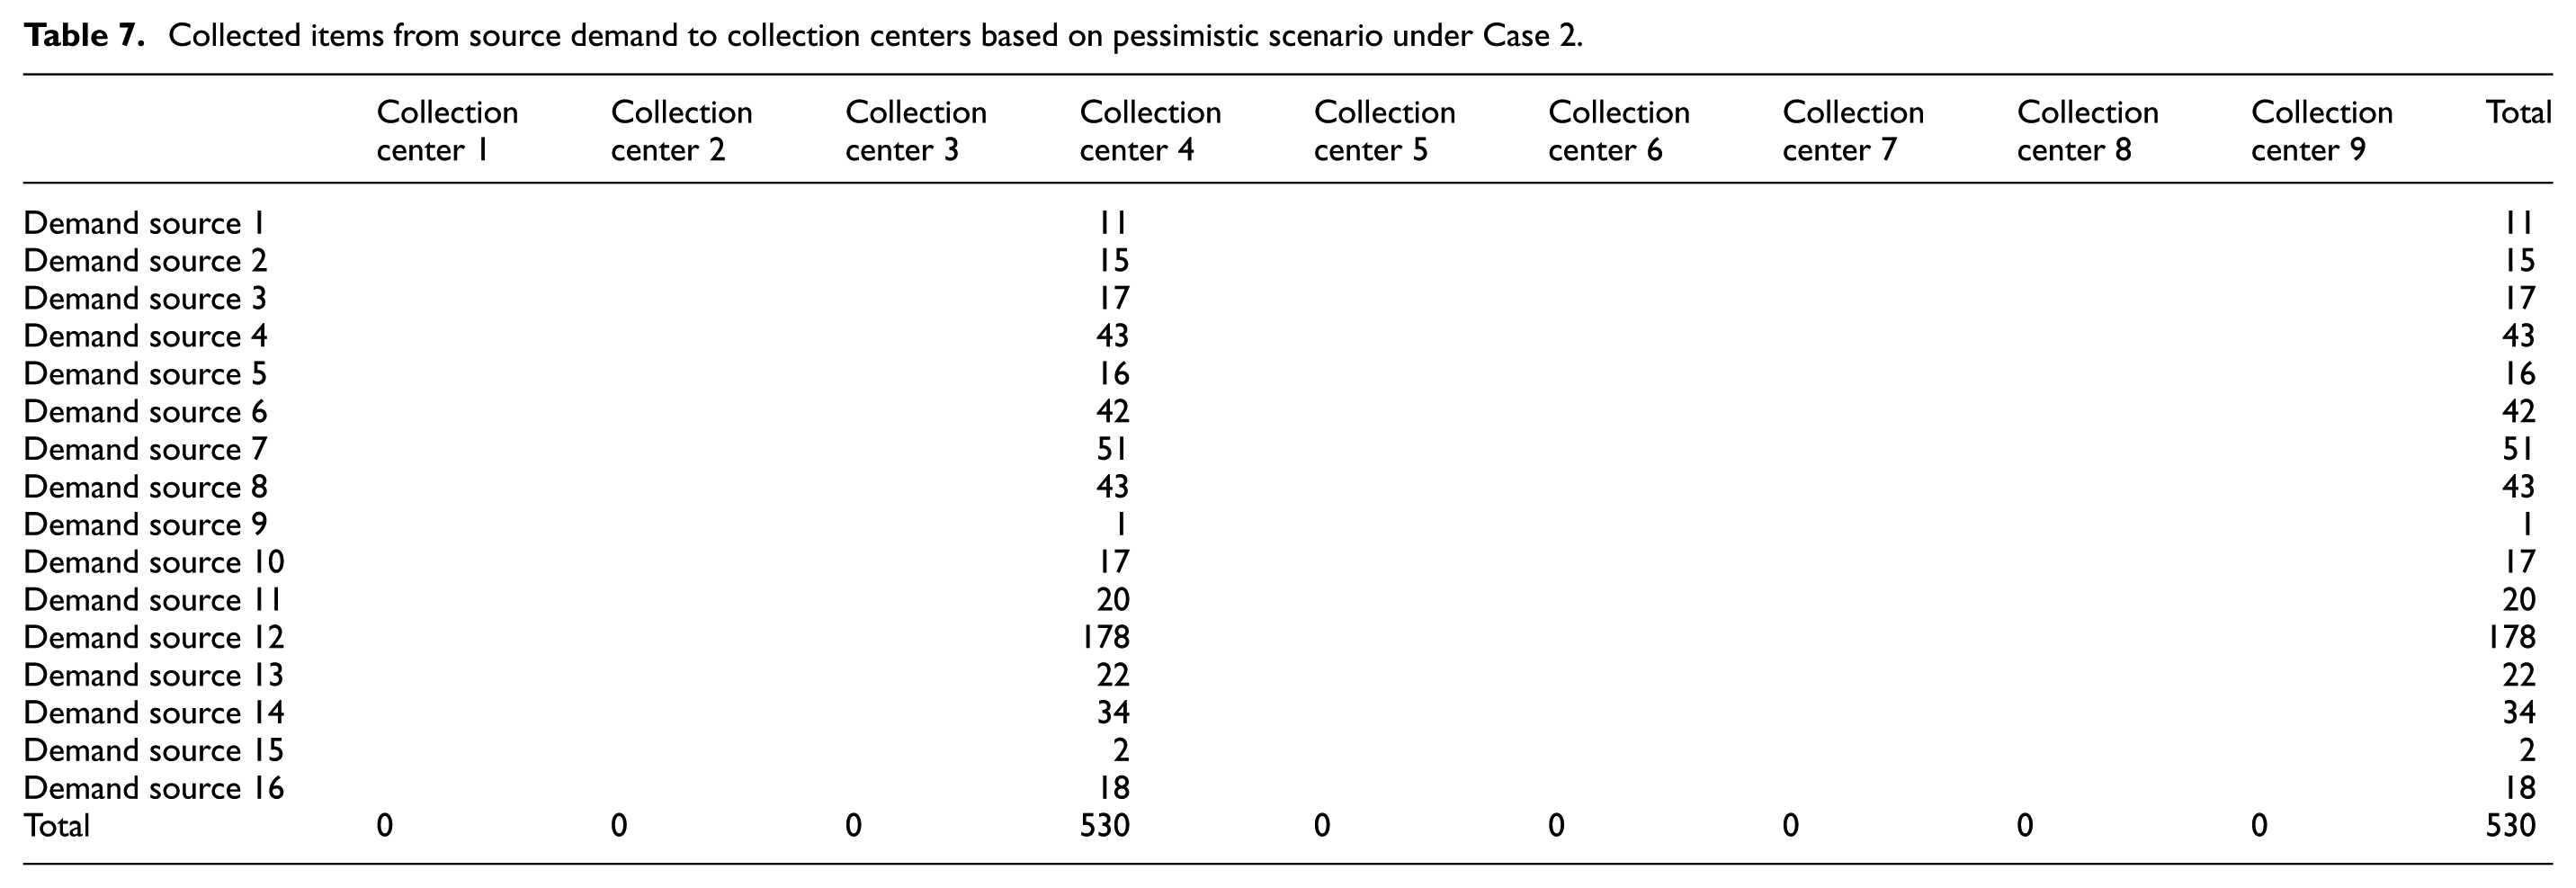
Collected items from source demand to collection centers based on pessimistic scenario under Case 2.
Optimistic demand scenario (10%)
The results for the optimistic demand scenario under Case 1 are shown in Table 2. The optimal solution is to open collection centers 1, 2, 3, 4, 6, 7, 8, and 9. Results show that location 2 is the best location for the remanufacturing plant, with a total cost of 14,552,183 SAR (Saudi Arabian Riyal).
The results for the optimistic scenario under Case 2 are shown in Table 3. The Pareto optimal solution is to open the collection centers 1, 3, 4, 8, and 9. Results show that location 3 is the best location for the remanufacturing plant, with a total cost of 13,818,836 SAR.
Mid-range demand scenario (5%)
The results for the mid-range demand scenario under Case 1 are shown in Table 4. The optimal solution is to open collection centers 1, 2, 3, 4, 6, 7, 8, and 9. Results show that location 2 is the best location for the remanufacturing plant, with a total cost of 14,184,907 SAR.
The results for the mid-range scenario under Case 2 are shown in Table 5. The Pareto optimal solution is to open collection centers 3, 4, and 9. Results show that location 3 is the best location for the remanufacturing plant, with a total cost of 13,818,836 SAR.
Pessimistic demand scenario (0.1%)
The results for the pessimistic demand scenario under Case 1 are shown in Table 6. The optimal solution is to open collection centers 1, 3, 4, 6, 7, and 8. Results show that location 2 is the best location for the remanufacturing plant, with a total cost of 13,318,930 SAR.
The results for the pessimistic demand scenario under Case 2 are shown in Table 7. The optimal solution is to open only collection center 4. Results show that location 3 is the best location for the remanufacturing plant, with a total cost of 13,064,770 SAR.
Discussion
The obtained design of the reverse supply network based on the optimistic scenario costs 14,552,183 SAR. This cost is within 1% of the costs related to the network if designed under Case 2, where optimization is based only on economic cost. This low percentage encourages decision makers to base their decision not only on the cost but also on environmental and societal considerations. Due to high demand, the model chose all available collection centers, except collection center 5. This exclusion could be due to its closeness to center number 4, which is close to sources of demand and has lower costs.
The network based on the mid-range scenario under Case 1 has an optimal solution that will result in the emission of 122,456 kg of CO2, while the network under Case 2 emits 135,454 kg of CO2. The proposed model therefore saves 12,998 kg of CO2 and also opens additional collection centers (leading to more job creation) in exchange for a 366,071 SAR increase of the total reverse logistic network costs. Solving the problem under Case 2 (single objective) creates a 2.6% cost reduction. It is the decision maker’s preference to design the network based either on merely optimizing the cost or also considering the environment and society.
Results show that the cost of the network and its CO2 emissions do not have the same relationship with the demand level; an obvious relationship between demand and CO2 emissions can be seen, while the cost of the network is mostly tied to the fixed and capital costs. When the demand is very low, as in the pessimistic scenario, it does not seem feasible to open many collection centers. The expected demand of 540 units can be handled within one collection center. At this level of demand, the feasibility of the business is questionable and needs to be verified.
Conclusion
This research introduced a design for a RSC as a case study in the remanufacturing environment. A multi-objective optimization model was developed to assist with the design of the network. The model provided designs based on economic, environmental, and societal objectives, and it analyzed different scenarios using a case study of multiple collection centers and multiple remanufacturing plant locations. The model and case analyses led to the following conclusions:
Introducing the idea of remanufacturing a PEMFC battery and optimizing the total cost of the collection network is beneficial. This is feasible through selecting collection centers and locations for manufacturing plants while fulfilling three optimization objectives.
A carbon emissions cap incentive is needed to motivate network designers to include environmental and societal aspects in their designs. Results show that a network designed under Case 2 (single objective) is 2.6% less costly compared to a network designed under Case 1 (multi-objective). Hence, a carbon emissions cap incentive comparable to 2.6% will encourage remanufacturers to consider environmental and societal concerns in their decision.
Since the cost of the network is mostly tied to fixed and capital costs, the feasibility of a remanufacturing initiative can be improved by seeking options with low capital investment. Municipalities are encouraged to establish industrial zones that require low initial investments; this will reduce the initial capital investments required for remanufacturing plants.
The proposed model was found to be useful in assessing the influence of the design input parameters on the network design. For instance, the number of batteries to be collected will influence the number of feasible locations of collection centers and the number and location of the optimal remanufacturing plant. The model is found to be capable in relating and linking the input parameters to the network design correctly and meaningfully.
Moreover, the decision maker’s satisfaction is reflected in this model through the scenarios and case constraints. In future work, the decision maker’s satisfaction can also be reflected by the gap between the actual battery demand level and the required remanufacturing demand level. A smaller gap leads to better satisfaction and further reduction in the total cost of achieving the three objectives.
Limitations and future work
The proposed model in this article focused on static conditions; dynamic and stochastic nature of the problem can be addressed in future work. This could include collection of different types of batteries, different types of emissions, and other dynamic logistics for serving multiple regions.
The proposed model in this work handles a specific case study. A generalized model can be considered as an extension of this work. Such generalized model can address various regions as well as various products collected using the same network.
Finally, the practical usefulness of the model can be validated through future implementation of the model in the specified region.
Footnotes
Appendix 1
Acknowledgements
The authors are grateful to the (Raytheon Chair for Systems Engineering) for funding.
Handling Editor: Jaber Qudeiri
Declaration of conflicting interests
The author(s) declared no potential conflicts of interest with respect to the research, authorship, and/or publication of this article.
Funding
The author(s) received no financial support for the research, authorship, and/or publication of this article.