
Abstract
Residual strength is one of the important properties of materials and is the basis for material fatigue life prediction. In this article, the residual strength of 18CrNiMo7-6, a commonly used material for wind power gears, is degraded with the load of fatigue load. According to the law of fatigue damage generation and development, a residual strength degradation model is proposed. According to the comparison between the test results and the model, the accuracy of the proposed model is high. When the number of loading/total number of cycles is close to 0.7, the residual intensity will change significantly. It is helpful to further study the reliability change of wind power gears under high cycle fatigue.
Introduction
Fatigue damage is a process in which the material is degraded under cyclic loading. The damage variable depends on the magnitude of stress or strain. The cumulative damage process of a material is essentially a nonlinear process in which stress and damage interact. 18CrNiMo7-6 is commonly used in the manufacture of wind turbine gearbox gears, and according to ISO-81400-4, 1 wind turbine gearboxes are designed to meet the service life of at least 20 years. When the gearbox design is put into use, its strength can meet the requirements according to the design requirements. As the use time continues, the strength reliability of the gearbox is continuously reduced, and even if the load is constant, it often leads to accidents such as breakage. That is to say, the same load is safe when the component is just used, and it is dangerous when the component is used for a long time. The reason is that the strength of the member is gradually reduced with the number of load cycles, that is, the strength is degraded.
In this article, the nonlinear fatigue damage accumulation model of 18CrNiMo7-6, a common material for wind power gears, is designed. The strength test scheme is designed. The relationship between residual strength, stress level, and load cycle number is obtained, and the nonlinear decay attenuation law and mathematical model are established.
The material’s internal cumulative damage increases continuously under cyclic loading, resulting in a continuous decline in its performance, manifested by degradation of macroscopic strength and reduction of remaining life. 2 Studying and determining the strength degradation of materials has important engineering significance for accurately predicting fatigue reliability.2–5
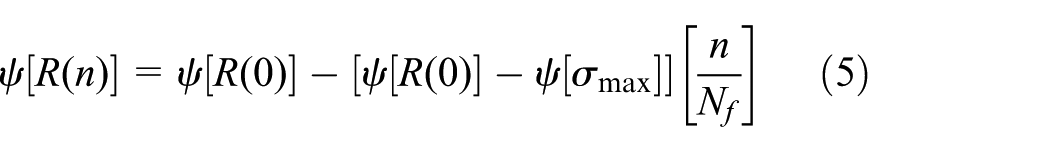
The concept of residual strength is the ability of the structure to withstand external loads after serving for a period of time, closely related to the loading mode and the number of loading actions, namely

where R(n) is the residual strength of the component after a period of service (cycle number n), σmax is the maximum value of the alternating load, and R is the stress ratio of the load

where
The remaining strength should meet the following two boundary conditions

where

where N is the maximum number of failure cycles.
Numerous studies have shown that different materials have different ways of intensity attenuation degradation. From the fatigue damage mechanism of metal materials, in the initial stage of loading, the defects generated by the parts under the fatigue load, such as misalignment, slip, and cavity, have little effect on the strength of the parts, but the cracks caused by the defects in the later stage make the parts. The strength is rapidly reduced, resulting in fatigue damage. Therefore, for metals, the attenuation at the beginning of the residual strength degrades more slowly, but when the loading cycle ratio is close to 1, it decreases sharply, causing fatigue damage.2–4,6–8
Many scholars have proposed a variety of residual intensity attenuation degradation theory. Broutman and Sahu 9 proposed a linear attenuation model of residual strength based on the fatigue test of glass fiber composites (glass fiber–reinforced plastic (GFRP))

In the formula, it is the static tensile strength σb; Nf is the fatigue life corresponding to the load. This model assumes that the residual intensity decays linearly with the cycle ratio.
Yang and Liu 10 assumes that the degradation rate of the fiber composite strength is proportional to the residual strength at that time, and the resulting model is

where
On the basis of the above model, Hashin 11 does generalization and obtains the following model
This model considers that fatigue life data is generally described by a lognormal distribution. The function in the above formula must be determined by a large number of residual strength tests, so it is difficult to apply it in practical engineering.
Charewicz and Danile 12 proposed that the residual strength model satisfies the boundary conditions

Schaff and Davidson 13 believe that under the normal amplitude load, the residual strength of the composite deteriorates according to the power exponential law.
Some scholars in China have also studied the degradation of fatigue residual strength. Xie and Lin 8 based on the experimental study of the residual strength decay caused by fatigue loading proposed the use of logarithmic function to describe the intensity model

Yao 14 proposed the degradation law of metal strength. According to the fracture mechanics

where Kt is the stress intensity factor of the crack-containing component; S is the load; a is the crack length, which is a monotonically increasing function of the number of loadings n; and F is the geometric correction factor, when the stress intensity factor Kt of the crack-containing component reaches the fracture of the material. In the case of ductile KIC, the element is broken, and the stress δ at this time is the residual strength R(n)

W Lu and L Xie 15 described the process of material static strength attenuation degradation of components during fatigue process under equal amplitude stress

where σR(n) is the residual strength of the material; S is the cyclic stress level; n is the number of cyclic loads; and p and q are material constants and are related to external loading frequency, humidity, temperature, and other factors; σR(n) meets the boundary conditions

From the above discussion, the above model gives an explanation to some extent that it is consistent with the mechanism of intensity attenuation degradation. According to its derivation principle, it can be divided into two categories in general: macroscopic phenomenological model and microscopic mechanism model.
The macro-phenomenological model requires a large amount of experimental data to estimate the parameters. Therefore, most of the current models are limited in engineering applications. The micro-mechanism model is based on the development of micro-damage inside the material and degenerates the law, but affects the internal degradation of the material. There are many mechanistic factors, so further research is needed for this type of model.
In this article, based on the degenerate formula of Schaff under the constant load, the degradation model of residual strength under load is derived. Assuming that the component acts n1 under cyclic loading, the damage caused by the load is D(n1)

where
The existing fatigue theory mostly considers that the damage of the load to the material is absolutely equivalent and objective. The Miner rule treats damage as uniform distribution. For example, in constant amplitude fatigue, the damage produced by each cycle is 1/Nf (Nf is the fatigue life limit). 16 The definition of nonlinear damage was first proposed by Marco and Starkey, 17 and later Manson and colleagues18–20 developed different damage curve methods. The damage caused by a cycle defined by the Manson model is
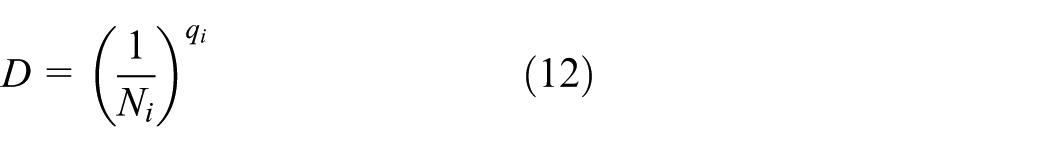

In the formula, Ni is the fatigue life under the corresponding load; B and μ are material constants.
Fatigue cumulative damage D(A) refers to the total amount of damage before the nth cycle. According to the irreversibility and randomness of the damage, the curve of D(A) should be determined by the test, but it is difficult to measure it in actual engineering. Generally, the following functional forms are assumed

where f is the damage index.
The damage caused by multiple cyclic loads corresponding to the Manson model is
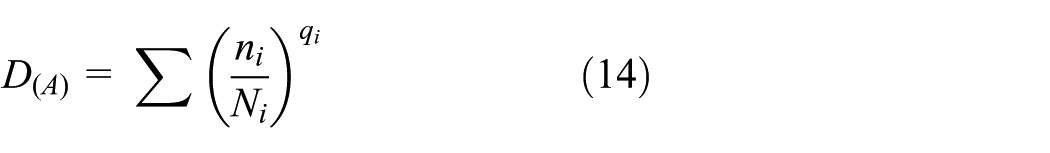
where ni is the number of cycles of the ith stress.
Equation (14) is the cumulative damage model under multi-stage load. Marco and Starkey 17 used this model to better explain the order effect under the widely applied two-stage load, but the specific expression of qi was not given, and Manson-Halford perfected the model from effective microcrack growth.
Residual strength fatigue tensile test
Test conditions
Strength degradation is the residual strength of a material under a certain stress level after a certain stress cycle. It is related to the stress level and the number of load cycles. Therefore, the strength degradation test of the material can be designed, that is, the strength limit of the material is determined by experiments. Fatigue S-N curve; then, according to a certain law, loading at a certain stress level, the number of cycles is less than the corresponding cycle limit under the stress, so that the material produces a certain amount of cumulative damage; and then stretching to obtain the stress level and the number of cycles. The remaining residual strength is fitted to the strength degradation model of the material.
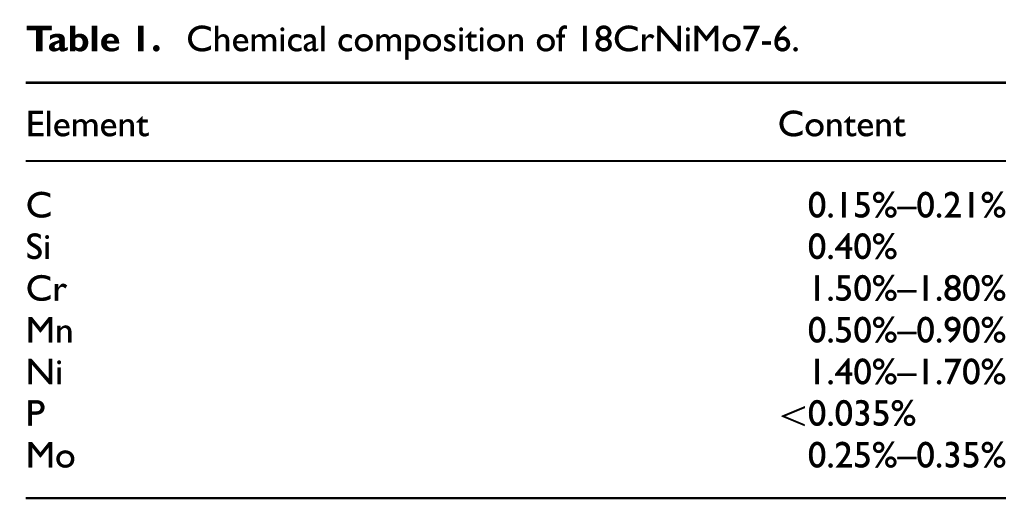
According to the design requirements of a wind turbine gearbox, the test material is 18CrNiMo7-6 forged steel, which is surface hardened. The chemical composition is shown in Table 1. The samples’ hardness is HRC25-3. The test uses a small sample of smooth cylindrical shape, the shape and size of which are shown in Figures 1 and 2. Test sample after fatigue is shown in Figure 3. The fatigue test was carried out on the PWS-E100 electro-hydraulic servo universal testing machine (shown in Figure 4) manufactured by Jinan Times Tester Co., Ltd., with load stress ratio R = –1, loading stress amplitude σmax = 728 MPa, test frequency for 10 Hz, and the loading form is sine wave loading. The material strength limit σb and the yield strength σs were determined by static stretching of the test machine.
Chemical composition of 18CrNiMo7-6.

Test piece shape.

Test piece size.
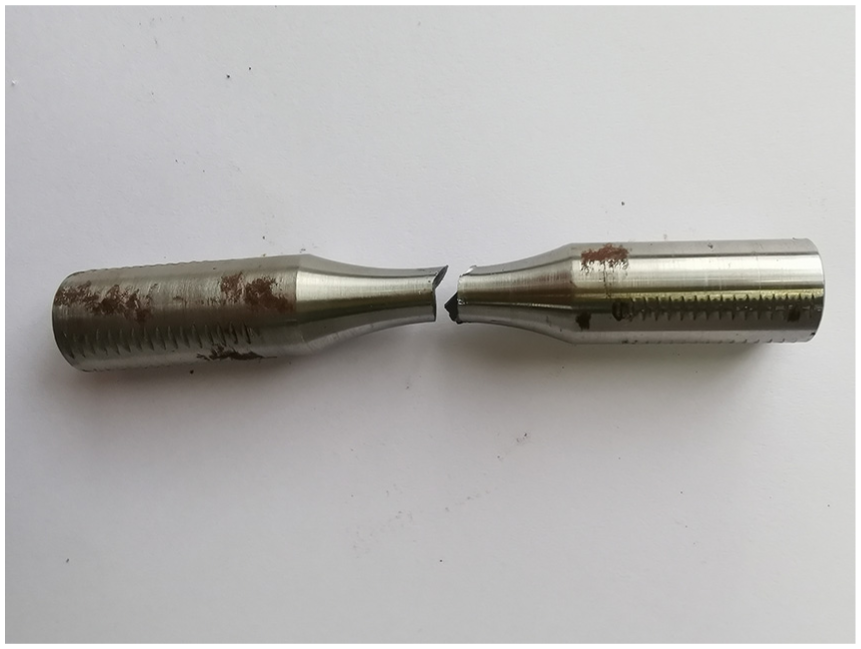
Test sample after fatigue.

PWS-E100 electro-hydraulic servo universal testing machine.
Test methods
First, the static tensile test was carried out on five samples to obtain the maximum tensile strength of the material at the cycle number ratio n = 0. By formula, the fatigue limit of the material is estimated to be 330–385 MPa. Then, with each of the five test pieces as a group of test objects, under the same external environment, the stress gradient of each set of test pieces is reduced by about 104 MPa for sinusoidal loading, the symmetric cyclic stress ratio is R = –1, sine wave loading, the frequency is 10 Hz, and the average number of cycles per test is shown in Table 2.
Fatigue tensile test.

According to the data of Table 2, the S-N curve (stress ratio R = –1) was obtained as shown in Figure 5.

S-N curve.
When the material is tested for its fatigue limit, it is impossible to achieve an infinite number of stress cycles. The test shows that under the action of alternating stress, if the stress cycle reaches 107 without breaking, it indicates that it can withstand an infinite stress cycle. The constant amplitude fatigue limit is defined as the fatigue strength at 107 cycles. According to the trend line, the fatigue limit of 18CrNiMo7-6 is 350 MPa, which is within the estimated range.
The fatigue stress limit N is determined by determining the loading stress (less than the strength limit) of a certain set of test pieces, and then loading under the same stress according to the cycle limit times of 0.5, 0.7, and 0.8 times, respectively, to obtain different residual strengths. Repeat the different loading stresses to complete the material strength degradation test.
Test results
The yield strength and tensile strength change of the sample after a certain number of fatigue loadings are shown in Figure 6. It can be seen from the figure that as the number of cyclic loadings increases, the yield strength and tensile strength of the material decrease gradually, and the variation of yield strength is larger than the variation of tensile strength. In the early and middle stages of the cyclic load, the degradation of the intensity approximates the linear change, while at the later stage, the intensity changes greatly.

Changes of tensile strength, yield strength and after fatigue.
Residual strength degradation model
Model
The results of the degradation test of tensile strength of 18CrNiMo7-6 are shown in Figure 7, and the degradation model can be fitted by a power function.

Residual strength degradation curves for 18CrNiMo7-6 steel.
Let the intensity degradation model be

When n = 0, R(0) = A, and A is the tensile strength of the material (A = 1100 MPa, B = 372 MPa). By fitting with the least squares method, c = 2.8 was obtained. The residual intensity curve produces different degradation laws depending on the value of the parameter c. As shown in Figure 8. When c = 1, equation (15) degenerates linearly; when c > 1, R(n) begins to degenerate slowly and then decreases rapidly in the later stage; when c < 1, R(n) begins to degenerate faster and later degrades slowly.

The law of intensity degradation varies with c value.
Model comparison
Comparing the power degradation model with the logarithmic degradation model, 8 as shown in Figure 9, the experimental values and the estimated values are in good agreement, as shown in Table 3, indicating that the proposed model is feasible.
Comparison of residual strength test values and calculated values.

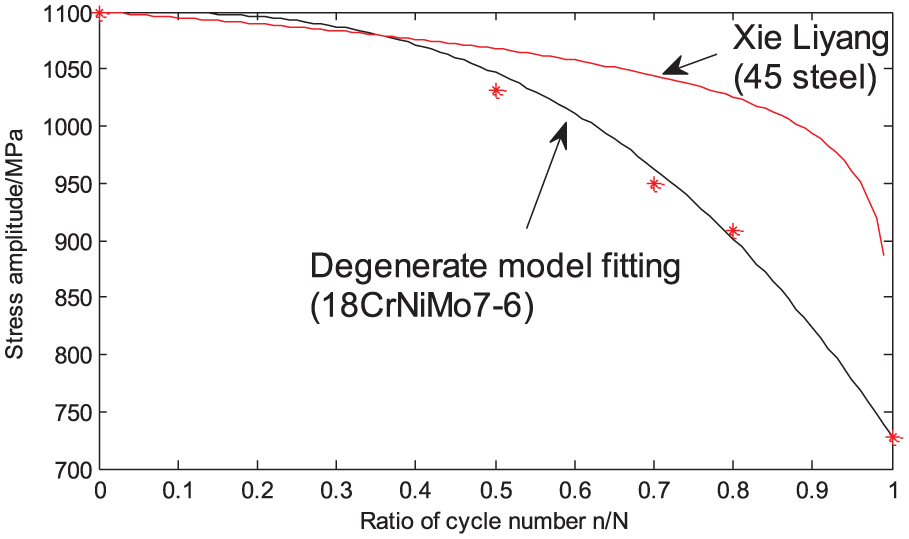
Comparison of different model fitting effects.
Model verification
For the 18CrNiMo7-6 material, different degradation laws can be obtained by formula (15) under different loading stress levels. The curve of Figure 9 is the degradation laws of the loading stress at 728 MPa and is represented by curve 1.
When the loading stress at 416 MPa was loaded, the cycle number ratio was 0.5, and the test value was 1012 MPa (Figure 10, 2—small square); the calculated value was 1001.8 MPa (A = 1100, B = 684), and the relative error was 1.01%, which indicates that this model has higher precision.

Comparison of residual strength test value and calculated value.
It can be found from the curve of Figure 10 that the residual strength of the material is slower when the number of cycles is lower, and the decrease is more obvious when the cycle number exceeds 0.5, especially when the number of times reaches 0.7 or more. It also meets the strength degradation characteristics of most steels, indicating the universality of this model.
Conclusion
The strength degradation law of 18CrNiMo7-6 material is discussed. The material strength degradation test scheme is designed. A reasonable description of the experimental data is obtained and the power degradation law of the residual strength of the material is obtained.
Compared with 45 steel, 8 the residual strength degradation law of different materials is different, but the similarity is that the material residual strength keeps a high value in the interval where the cycle number ratio is lower than 0.5, but when the ratio exceeds 0.7, the ratio of the remaining cycles has a significant change when the ratio of the number of close loops is 1.
The degradation law of this article is fitted by experimental values, which provides data support for gear design, calculation, and calibration. It provides some reference basis for further research on the reliability change of gearbox in long-term working environment.
Footnotes
Handling Editor: Zhaojun Li
Declaration of conflicting interests
The author(s) declared no potential conflicts of interest with respect to the research, authorship, and/or publication of this article.
Funding
The author(s) disclosed receipt of the following financial support for the research, authorship, and/or publication of this article: The present research was supported by the International S&T Cooperation Program of China (2015DFA71400).