
Abstract
Numerical simulations are important in bearing designs and should be in accordance with real working conditions. Two details are analyzed for the numerical simulations with a three-dimensional model of a large tilting-pad journal bearing included. The first detail is the flow model of the journal bearing simulations. The shear stress transport model with low-Reynolds number correction and the laminar model are used for the bearing simulations. In comparison with the laminar model, the pressure distribution of the shear stress transport model with low-Reynolds number correction is closer to and in good accordance with the experimental data. Thus, the shear stress transport model with low-Reynolds number correction is more suitable than the laminar model for the journal bearing simulations. The second detail is the backflow material of the bearing outlet boundary. Two backflow materials, air and oil, are simulated and compared with the experimental data. While the mechanical loss of the oil backflow is much higher than the experimental data, the simulated mechanical loss of the air backflow has an acceptable difference with the experimental mechanical loss. Therefore, air is a suitable backflow material for the journal bearing simulations. In summary, shear stress transport model with low-Reynolds number correction and air backflow should be used in the journal bearing simulations for accurate bearing predictions.
Introduction
The mechanical losses of large tilting-pad journal bearings increase with the rotational speed. Accurate predictions are important for bearing analysis and design. Several critical factors, such as cavitation, flow model, and thermomechanical deformations, influence bearing predictions. In this study, cavitation and flow model are highlighted on the basis of the measured fixed geometry. The cavitation factor can affect the material volume fraction and shear stress, thereby influencing the mechanical losses. The flow model influences the simulation results of the hydrodynamic characteristics.
Recently, numerous studies have focused on bearing oil cavitation and constructed different cavitation models to predict the material fraction and mechanical losses accurately. The half-Sommerfeld model, which is a widely used cavitation model, was used by Fedor 1 in 1963 for an approximation of finite journal bearings and a tilt stiffness simulation of finite journal bearings. 2 The Rayleigh–Plesset cavitation model has also been developed. This model is based on the vaporous cavitation mechanism 3 and was used for journal bearing simulations by Someya. 4 The Rayleigh–Plesset cavitation model has been optimized for cavitation in lubricant contacts on the basis of bubble dynamics. 5
Jakobsson–Floberg–Olsson (JFO)-type cavitation models follow the JFO cavitation theory, including film rupture and reformation conditions. Various algorithms, such as Elrod’s 6 and Kumar and Booker’s 7 algorithms, have been utilized to solve the JFO-type cavitation models. Complex applications, such as cavitation in dimples of a thrust bearing, can be realized on the basis of theories and algorithms. 8 , 9 The JFO cavitation condition can be combined with other models, such as Murty’s 10 algorithm and a mass-conserving model of Bonneau et al. 11
In addition to the vaporous cavitation model, gaseous cavitation models are based on air dissolution and have been constructed for bearing simulations. A homogeneous mixture gaseous cavitation model has been constructed on the basis of air solubility. 12 The vaporous and gaseous cavitation models have different mechanisms. In large tilting-pad journal bearings, the lubricant pressure is often higher than the vaporous pressure (0.4 Pa for VG22 at 100°C). Therefore, the bearing oil cavitation generally depends on the dissolved air and oil. This model has been applied in numerous complex simulations, such as the analysis of non-equilibrium dissolution effect in thrust bearings.13,14
In addition to the cavitation models, the flow models of bearing oil films on bearing numerical simulations have also been studied. The general Reynolds equation has been widely used for bearing simulations. In the general Reynolds equation,15–17 the lubricant flows are assumed to be laminar. Increased rotational speed changes the bearing lubricant flows from laminar to turbulent. In view of the turbulence effect, the general Reynolds equation for bearing lubricant flows has been corrected based on many turbulence theories. The general Reynolds equation was first corrected on the basis of mixing length theory. Compared with the laminar simulation results and experimental data, turbulence simulation results confirm that turbulence effect should be considered for bearing lubricant flows.18,19 Ng and Pan 20 further investigated the theories based on law of wall and mixing length theory, and corrected the general Reynolds equation thereafter. In view of the verified theoretical results based on law of wall, Hirs 21 proposed a bulk-flow theory for the turbulence correction of the general Reynolds equation in bearing lubricant simulations. S Taniguchi et al. 22 used a corrected general Reynolds equation considering turbulence and thermal effects for a tilting-pad journal bearing simulations. Detailed performance analyses of hybrid journal bearings have also been conducted with turbulence effect considered. 23
With the development of computational fluid dynamics (CFD) techniques, CFD simulations have been utilized for bearing research. The turbulence models of the Reynolds-averaged Navier–Stokes (RANS) have been used for the bearings. B. Maneshian and G Nassab 24 and AA Solghar and SAG Nassab 25 reported the CFD results of the journal bearings with the Abe–Kondoh–Nagano (AKN) low-Reynolds number (Re) k–ε turbulence model included. In a tilting-pad journal bearing, the CFD results of a loaded pad simulated by 17 turbulence models were compared with the experimental data, and the shear stress transport (SST) turbulence model with low-Re correction was found the most suitable for the superlaminar bearing simulations among 17 turbulence models. 26
However, the simulation object of the above research was one loaded pad, and the research conclusion may be unsuitable for the entire bearing simulations, including the loaded and unloaded areas. Factors, such as the load direction,27–30 can also affect the bearing flow behaviors in the change of the simulation object. In addition, oil is set as the backflow material in the aforementioned studies, without considering its effect on cavitation. Under working conditions, the oil from outlets fuse at the bottom of bearing houses and the oil outlets of bearings can be present in air environment. Thus, the backflow material can be oil or air. Given the lack of study on the backflow material and CFD flow model in the entire bearing simulations, the present work takes a whole large titling-pad journal bearing as a simulation object and compares the simulation results of the laminar model with oil backflow, SST model with low-Re correction and oil backflow, and SST model with low-Re correction and air backflow with experimental data.
The outline of the present work is as follows. The “Governing equations” section presents the governing equations of the one-phase homogeneous mixture models. The “Simulation object” section introduces the simulation object. The comparison between the tilting-pad journal bearing simulation and the experimental data using traditional numerical method for verification is illustrated in the “Traditional numerical method” section. The comparison between SST model with low-Re correction and laminar model is illustrated in the “Flow model” section. The simulation results of the air backflow and oil backflow are compared with experimental data in the “Backflow material” section. The final part is devoted to the “Conclusion” section.
Governing equations
Cavitation model
A gaseous cavitation model based on air solubility
12
is included in this study. Assuming that air dissolution in oil approaches balance, a reduction of oil film pressure can break the balance and lead to air emission. The standard status of air emission is chosen at

where
The Bunsen solubility is based on the unit volume of solvent. Its value for air can be calculated as 31

where p and T are decided using the dissolution status.
Given that the local situation for air is different from the standard status, the local air emission volume can be calculated using the standard volume, as shown below

Based on the above equations, the air emission volume fraction can be expressed as follows

where
The lubricant oil and the air emitted from it are considered to be mixed fully. Thus, for simplicity, the lubricant oil and the released air from the oil can be calculated as a mixture, the cavitation oil. The density, laminar viscosity, and enthalpy of the cavitation oil can be calculated as


where
Navier–Stokes equations
In the example of the oil backflow boundary, the backflow oil and the cavitation oil are taken as a mixture. For the homogeneous bearing lubrication model, the Navier–Stokes equations can be written as


where
In the example of the air backflow boundary, the backflow air and the cavitation oil are taken as two phases, and the two-phase homogeneous mixture model is used. In the two-phase homogeneous mixture model, the cavitation oil and backflow air phases are calculated separately. Assuming that the cavitation oil and backflow air share a common flow field and the two-phase flow is homogeneous,
For the backflow air phase, the continuity equation is

For the cavitation oil phase, the continuity equation is
The momentum equation is
where
The energy equation is

The air volume is defined as the sum of the air emission volume and the backflow air volume. The air volume fraction can be calculated as
While
Simulation object
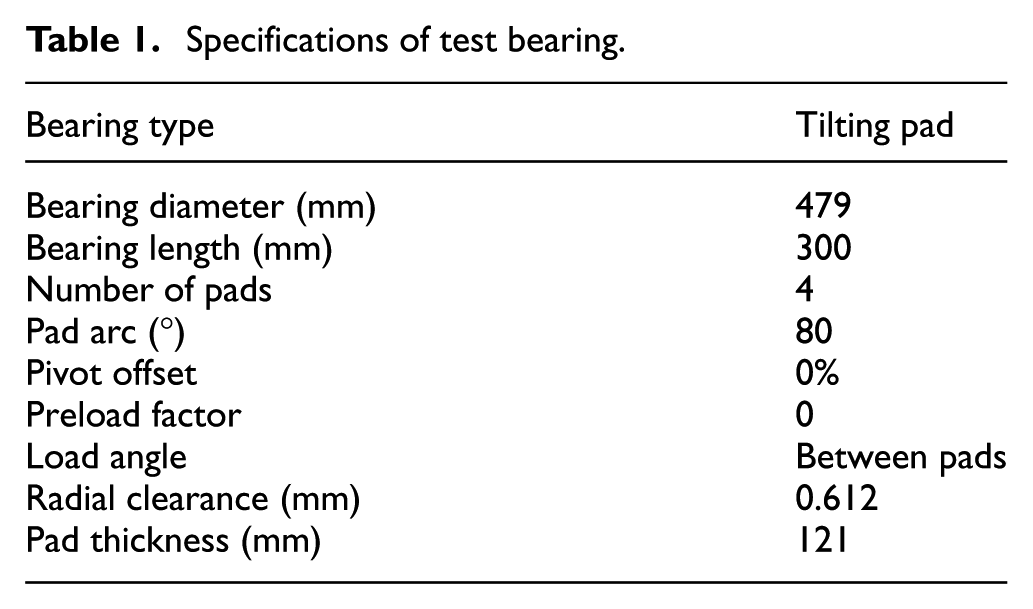
A tilting-pad journal bearing at 3000 r/min rotation speed and under 180 kN load is used for simulations. The simulated bearing specifications 22 are listed in Table 1. Figure 1 depicts the cross-section of the entire experimental apparatus.
Specifications of test bearing.
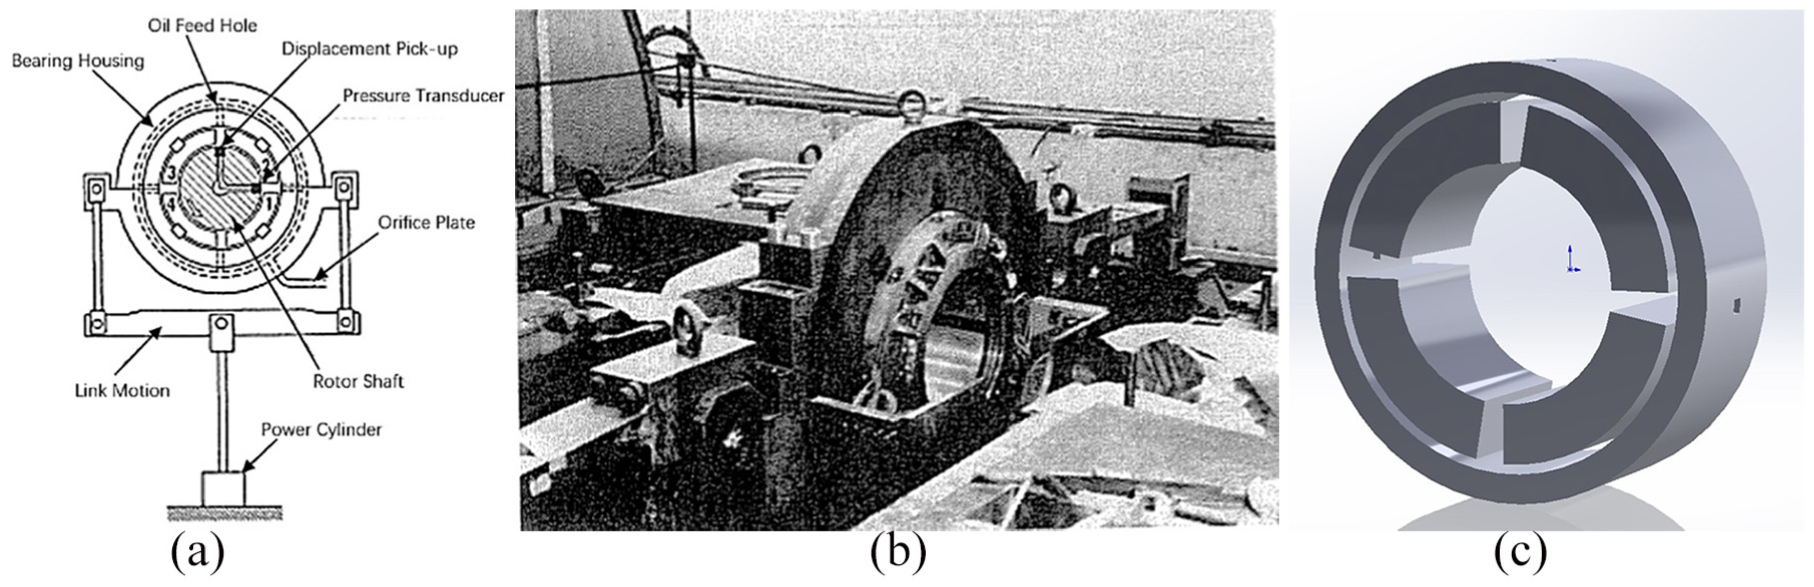
View of the experimental apparatus: (a) cross-section, (b) general view, and (c) three-dimensional (3D) view of the tested bearing. 22
Apart from the above specifications, the experimental oil film thickness at 3000 r/min and under 180 kN is shown in Figure 2. This bearing has four pads, numbered as Nos 1, 2, 3, and 4 from 0° to 360°. Between these pads, the four oil inlet holes are also numbered as Nos 1, 2, 3, and 4. Based on the experimental data, 22 Nos 1 and 2 pads are loaded.
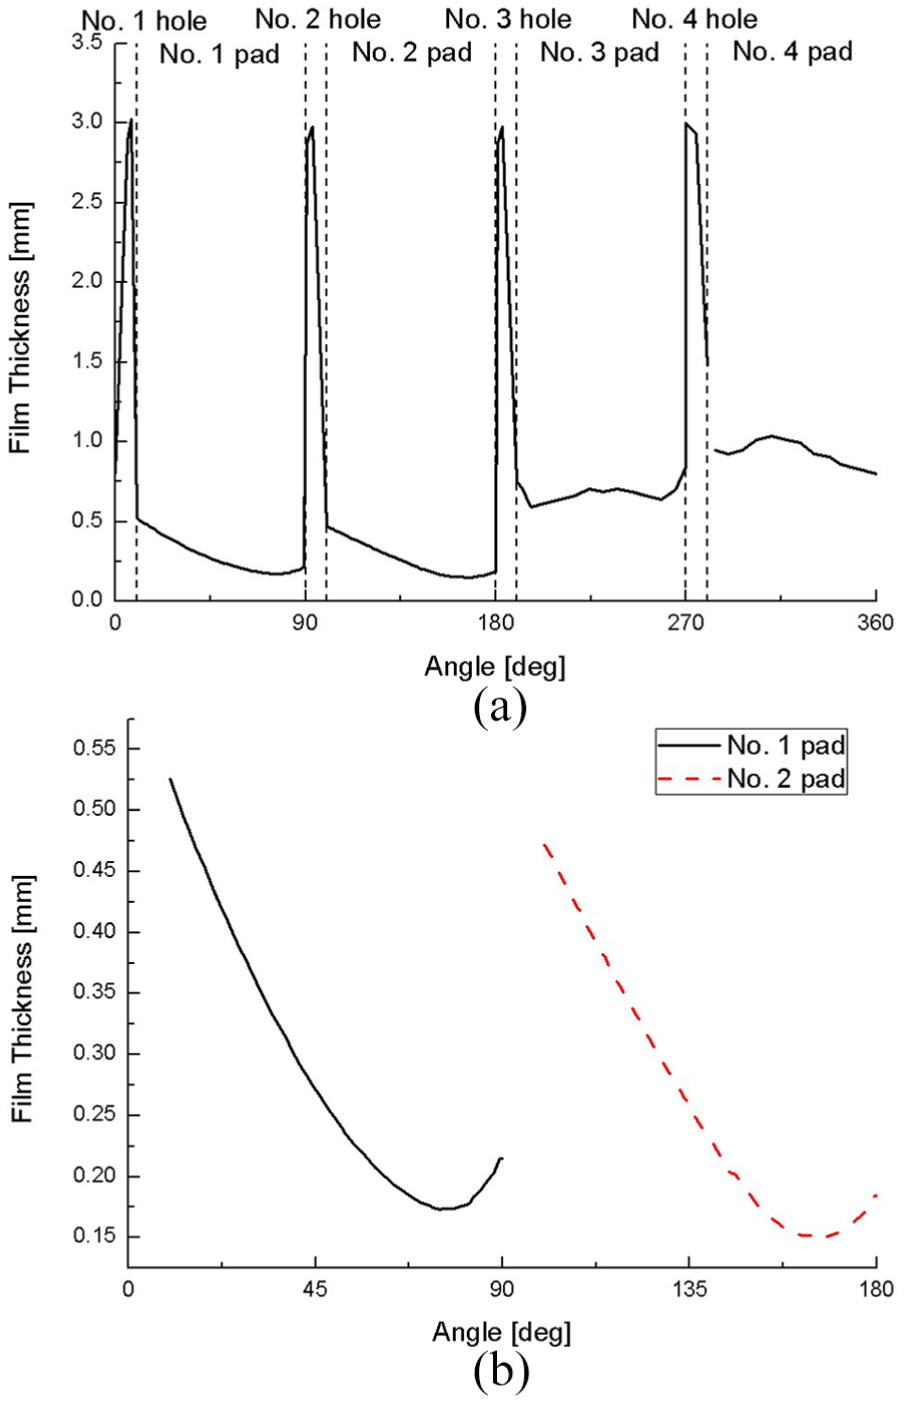
Measured film thickness of (a) tested bearing and (b) loaded pads. 22
Based on the film thickness and bearing specifications, the fixed three-dimensional (3D) bearing geometry can be drawn with a structured mesh. The film part mesh is a 480 × 80 × 20 (tangential by axial by radial) mesh system. The oil hole part mesh is four 20 × 80 × 80 (tangential by axial by radial) mesh systems.
A commercial software, ANSYS CFX, is used in the bearing simulations. The residuals of continuity, velocity, energy, and turbulent kinetic energy are below 1e–05 for convergence. The lubricant of this journal bearing is ISO VG32. The physical properties are listed in Table 2.
Physical properties of ISO VG32 (at 323.15 K).

Considering the thermal effect on material viscosity, the piecewise linear interpolation method is used to determine the relationship between the temperature and viscosity. The data are listed in Table 3.
Viscosity properties of ISO VG32.

Based on the experimental conditions, 22 Table 4 lists the boundaries, with the reference pressure set as 1 bar. Apart from the listed boundaries, other boundaries are all no-slip stationary walls. The heat transfer coefficient value recommended by Taniguchi et al. 22 is 115 W/(m2·K). Assumed to be uniformly distributed, the inlet temperature is set to be the experimental mixture inlet temperature (i.e. 315.15 K). The backflow of outlet is set to be oil or air for different examples.
Boundaries of tested bearing.

To prove the mesh independence, the pressure simulation results of two meshes with the air backflow from the outlet boundary are compared in Table 5. The moderate mesh is shown in Figure 3. The element number of each direction in the fine mesh is 1.3 times that of the moderate mesh. The element of each direction in the coarse mesh is 0.7 times that of the moderate mesh. The simulated highest pressure value of the coarse mesh is 6.3% lower than the moderate and fine meshes. Thus, the coarse mesh is not independent. The result of the same pressure and shear stress distribution of the moderate and fine meshes shows that the moderate mesh is independent.
Mesh independence.


Mesh of tested bearing.
Traditional numerical method
The general Reynolds equation has been widely included in bearing researches. Based on the general Reynolds equation, the traditional numerical simulations consider the bearing flow as laminar and the backflow material from the bearing outlets as oil. Therefore, for verification, the tilting-pad journal bearing simulation using traditional numerical method is compared with the experimental data.
Pressure distribution is a vital hydrodynamic characteristic for bearings. Given the experimental film pressure distributions shown in Figure 4, Nos 1 and 2 bearing pads from 0° to 180° are loaded, whereas Nos 3 and 4 bearing pads from 180° to 360° are unloaded. The oil flow in No. 1 pad has similar characteristics to No. 2 pad because of the load angle between the pads. Thus, the main characteristics of the oil flow can be obtained from the simulation results of the loaded No. 2 pad.

Experimental film pressure at 3000 r/min and under 180 kN loading. 22
The simulated pressure distribution of the laminar model with oil backflow is compared with the experimental pressure distribution along the centerline of No. 2 pad (Figure 5). The centerline is in the middle of the axial direction of the bearing (red line in Figure 5).

(a) Pressure distributions of No. 2 pad along the centerline and (b) pressure distributions of No. 2 pad.
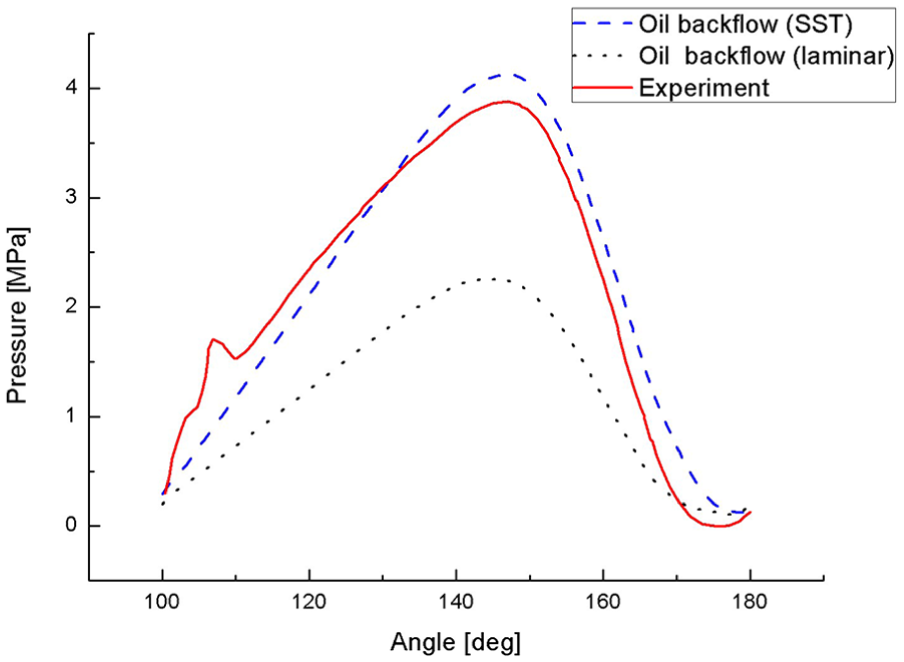
The highest simulated pad-side pressure is 2.25 MPa at 144° from the inlet, which is 42.0% lower than the highest measured pad-side pressure of 3.88 MPa at 147.0°. The error for the highest pressure value cannot be neglected. Thus, the laminar model with oil backflow cannot catch the hydrodynamic characteristics accurately and is unsuitable for the bearing simulations.
Apart from the pressure distribution, the mechanical loss is also one of the most important characteristics in bearing designs. The simulated mechanical loss of the laminar model with oil backflow is shown in Table 6.
Simulated mechanical loss (W).

From the table, the mechanical loss simulated by the laminar model with oil backflow is nearly 48.99% lower than the experimental data. Thus, the simulated lubricant flow of the laminar model with oil backflow is not in accordance with the real working conditions.
In summary, the traditional numerical method, using the laminar model with the oil backflow, cannot obtain the pressure distribution and mechanical loss accurately. The traditional numerical method is unsuitable for the bearing simulations, and the corrections for the traditional numerical method are necessary.
Flow model
Different flow models can lead to various CFD simulation results. Thus, a suitable flow model for the bearing simulations is important. Various corrections for the general Reynolds equation have been performed on the basis of mixing length theory and law of wall.18–20 Thus, the turbulence effect should be considered in the bearing simulation. Therefore, the SST model with low-Re correction and laminar model are compared with the experimental data in the bearing simulations.
Along the centerline of No. 2 pad, the simulated pressure distributions of the SST model with low-Re correction and laminar model are shown in Figure 6.
Pressure distributions along the centerline of No. 2 pad.
As shown in Figure 6, the highest simulated pad-side pressure of the SST model with low-Re correction is 4.12 MPa at 147.18° from the inlet, which is 6.19% higher than the highest measured pad-side pressure of 3.88 MPa at 147.0°. In comparison with the laminar model, the errors of the SST model with low-Re correction for the highest pressure value and angle are lower and acceptable for bearing simulations. Hence, the SST model with low-Re correction is suitable for the simulations of the whole tilting-pad journal bearing. Based on the difference between the SST model with low-Re correction and laminar model, the turbulence effect should be considered in the bearing simulations.
Considering the pressure distributions are 3D, the pressure contours on the pad-side wall and the rotor-side wall are shown in Figure 7 for the 3D analyses.
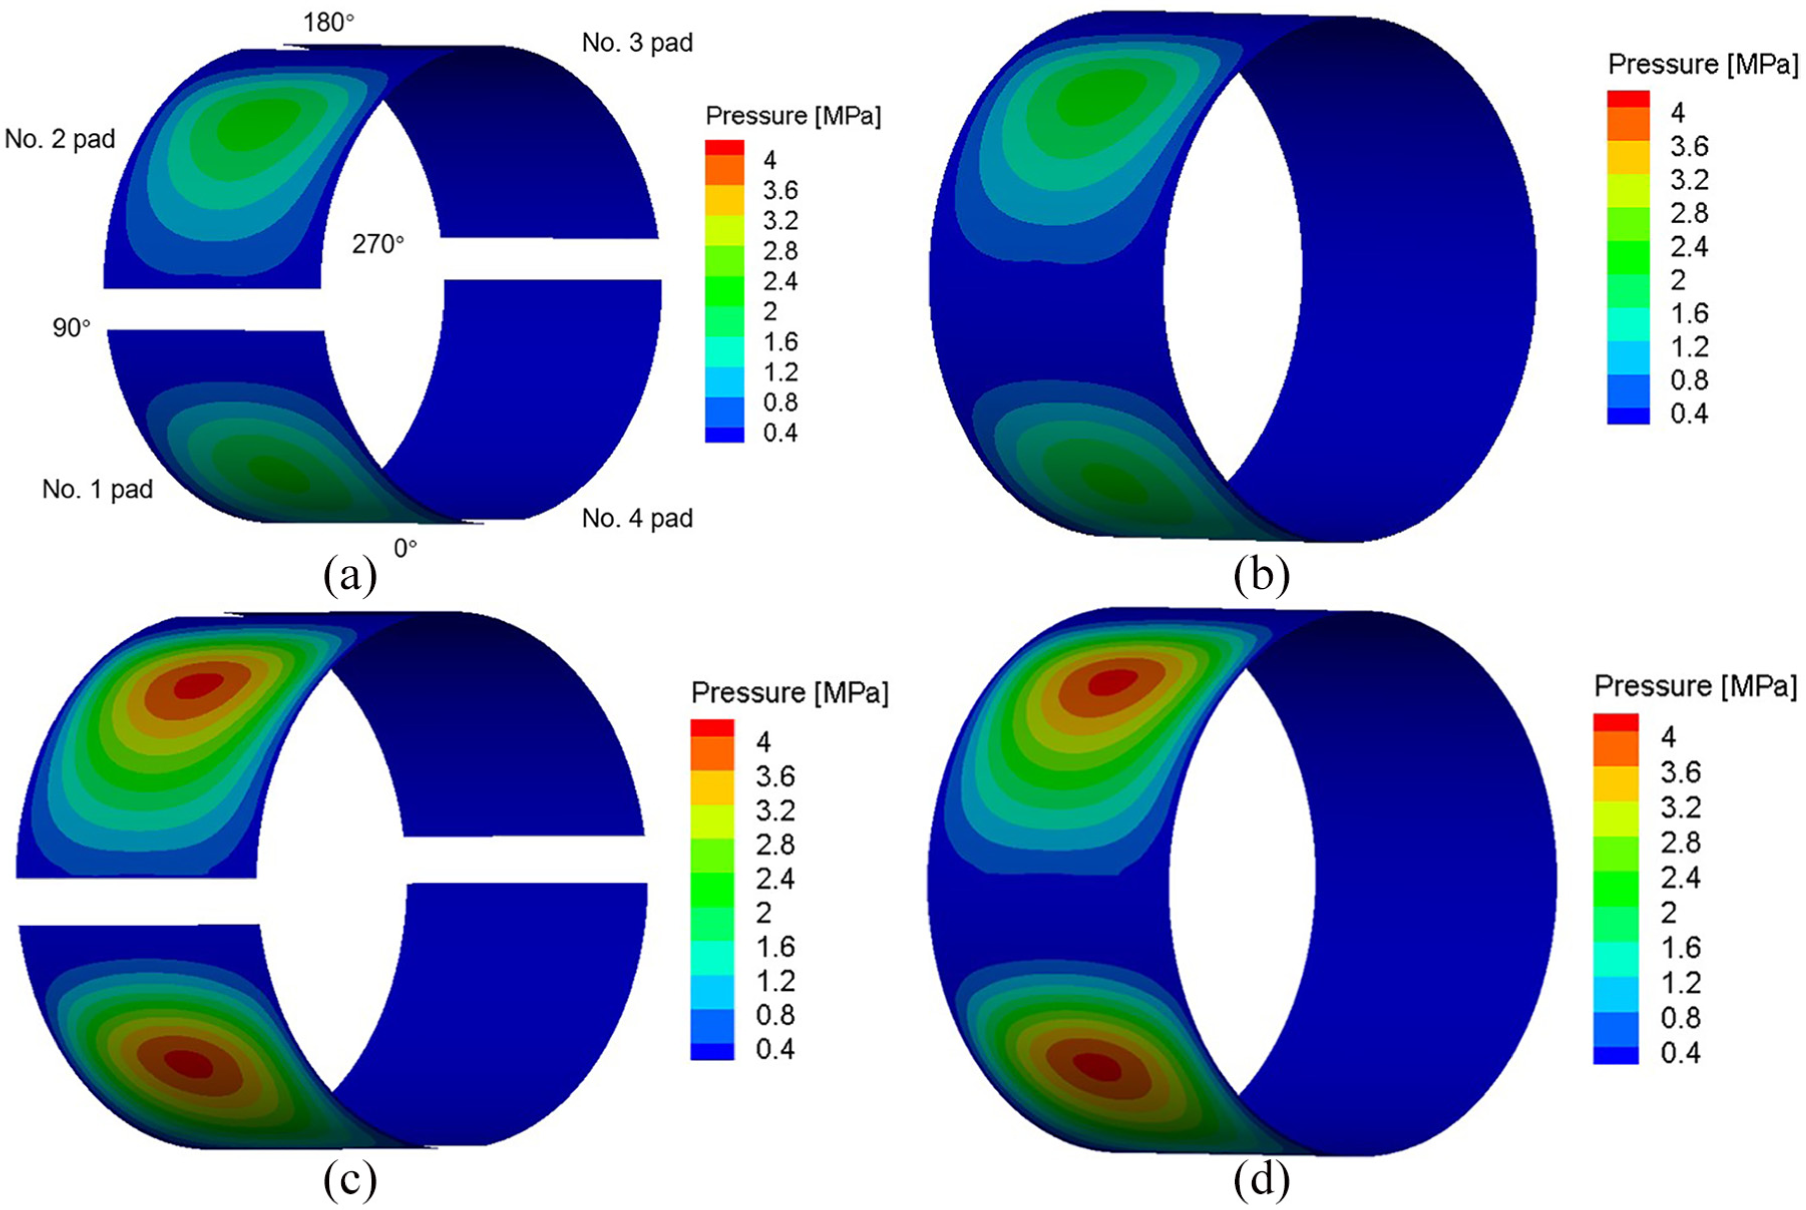
Pressure contours simulated by (a) the laminar model with oil backflow on the four pads, (b) the laminar model with oil backflow on the rotor-side wall, (c) the SST model with low-Re correction and oil backflow on the four pads, and (d) the SST model with low-Re correction and oil backflow on the rotor-side wall.
As shown above, the pressure distributions on the four pads are the same as the rotor-side wall. It indicates that the pressure along the radial direction keeps constant. Thus, the characteristics of the 3D pressure distributions are mainly in the circumferential direction. In the axial direction, the pressure distributions are symmetrical, and the highest pressure values exist in the centerline. This finding indicates the importance of the pressure distributions along the centerline. In the unloaded area, the pressure of the laminar model is as low as that of the SST model. As for the loaded area, the pressure difference of the laminar model and the SST model with low-Re correction is evident. Therefore, the proceeding analyses of the pressure distributions along the centerline of the loaded area are necessary.
Apart from the pressure, the temperature results should also be investigated. As shown in Figure 8, the average inlet temperatures of No. 1 pad and No. 2 pad are 314.2 and 315.5 K, respectively. It indicates that the inlet oil temperature becomes higher in the flow direction of the loaded area, which is caused by the effect of “hot oil carry-over.” In the unloaded area, the temperature distribution is almost uniform, different from the increasing tendency along the flow direction in the loaded area.

Temperature contour on four pads simulated by the SST model with low-Re correction and oil backflow.
For a detailed analysis of the bearing flows, the turbulent viscosity ratio profile of No. 2 pad simulated by the SST model with low-Re correction is given in Figure 9. The turbulent viscosity ratio, which represents the turbulence strength, is defined as the ratio of the turbulent viscosity to laminar viscosity. The laminar model does not take the turbulence effect into consideration. Thus, the laminar model has zero turbulent viscosity ratio.

Turbulent viscosity ratio distributions along the centerline of No. 2 pad.
As shown in Figure 9, the turbulence viscosity ratio is generally larger than 1. It indicates that the turbulence effect cannot be ignored, and the flow in the loaded area should be turbulent. In view of the turbulence effect, the viscosity simulated by the SST model with low-Re correction is higher than that by the laminar model, leading to a higher pressure distribution in Figure 6.
The simulated mechanical losses of the SST model with low-Re correction and the laminar model are compared with the experimental data in Table 7.
Simulated mechanical loss (W).

SST: shear stress transport.
The SST model with low-Re correction has a 137.6% higher simulated mechanical loss than the laminar model and a 21.2% difference with the experimental data. While the simulation results of the SST model with low-Re correction are closer to the experimental mechanical loss than the laminar model, the error of the SST model with low-Re correction is still unacceptable. Combined with the accurate simulated pressure distribution of the SST model with low-Re correction, another correction, the backflow material correction instead of the flow models, should be considered for the bearing simulations.
While the mechanical loss of the loaded area simulated by the SST model with low-Re correction is 153,807 W and 115.1% higher than the laminar model, the mechanical loss of the unloaded area simulated by the SST model with low-Re correction is 85,932 W and 186.9% higher than the laminar model. It indicates that the turbulence effect considered by the SST model with low-Re correction has a more significant influence on the mechanical loss of the unloaded area than the loaded area. Combined with the experimental film thickness in Figure 1, the high film thickness in the unloaded area may promote the turbulent flow to be fully developed, helping the turbulence effect become significant in the unloaded area.
In general, the turbulence effect should be taken into consideration in the bearing simulations, and the SST model with low-Re correction is suitable for the CFD simulations of the tilting-pad journal bearing. However, the simulated mechanical loss by the SST model with low-Re correction and the oil backflow has an unacceptable difference with the experimental data. Another correction, the backflow material correction, should be added for the bearing simulations.
Backflow material
Taking real bearing working conditions into consideration, the backflow materials from bearing outlets can be oil or air and influence bearing flows. As noted in the “Flow model” section, another correction, the backflow material correction instead of the flow model, should be added and this correction may be the backflow material. Therefore, oil and air are set as the backflow materials and compared with the bearing experimental data. As previously mentioned, the SST model with low-Re correction is suitable for the journal bearing simulations and used as the flow model for the following bearing simulations.
Pressure distributions
The pressure distributions of the air backflow and the oil backflow along the centerline of No. 2 pad are shown in Figure 10.

Pressure distributions along the centerline of No. 2 pad.
As shown in Figure 1, the pressure distributions of the air backflow and the oil backflow are the same. The highest pressure value and angle of the air backflow are 4.12 MPa at 147.18° from the inlet, accurate enough for the bearing simulations. It indicates that the backflow material has no relationship with the pressure distributions of the loaded area. In view of the high-pressure value along the centerline, the backflow may not occur in the high-pressure loaded area and the backflow material has no effect on the bearing lubricant flow in the high-pressure area.
For detailed pressure analyses, the simulated pressure contours of the air backflow and the oil backflow are shown below.
As shown in Figure 11, the pressure contours simulated by the air backflow and the oil backflow are the same, in accordance with the simulated pressure distributions in Figure 10. The area-averaged pressures in the loaded area with the air backflow and the oil backflow are 1.47 and 1.48 MPa, respectively. Considering the backflow pressure is set as 0.1 MPa, the area below 0.1 MPa in the loaded pads is small and there should be no evident backflow from the outlet boundaries in the loaded area based on Figure 12.

Pressure contours on four pads simulated by (a) the oil backflow and (b) the air backflow.
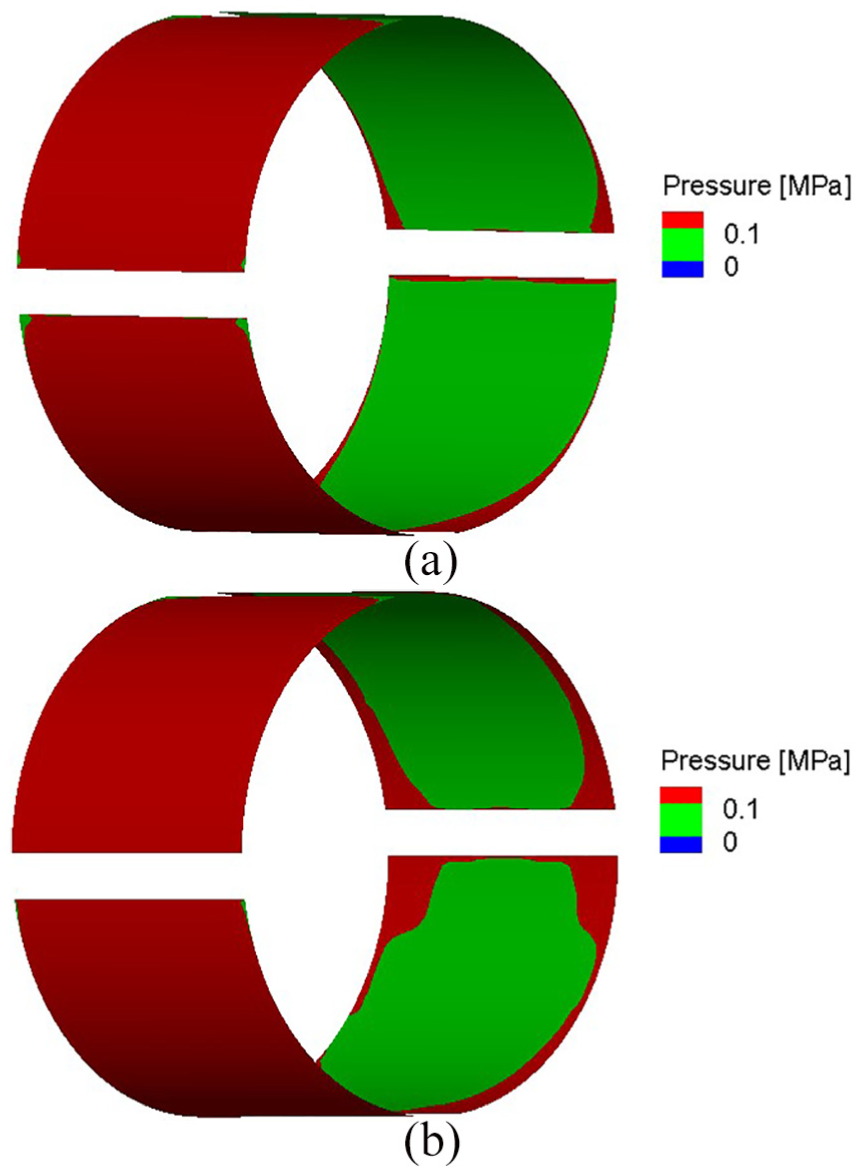
Pressure contours separated by 0.1 MPa simulated by (a) the oil backflow and (b) the air backflow.
Thus, regardless of the backflow material, the pressure distributions simulated by the SST model with low-Re correction are the same in the loaded area and in good accordance with the experimental data.
Mechanical losses
With the SST model with low-Re correction included, the air backflow and the oil backflow are simulated and compared with experimental mechanical loss. The simulation results are listed in Table 8.
Simulated mechanical loss (W).

SST: shear stress transport.
As shown in Table 8, the simulation results of the SST model with low-Re correction and air backflow are closest to the experimental mechanical loss with 2.01% error, accurate enough for bearing mechanical loss predictions. Combined with the simulated pressure distributions in Figure 10, the SST with low-Re correction and air backflow can accurately catch the pressure characteristics of the tilting-pad journal bearing. Therefore, the SST model with low-Re correction and air backflow is suitable for the numerical bearing simulations.
In the loaded area, the simulated mechanical losses of the air backflow and the oil backflow are 142,313 and 153,807 W, respectively. In the unloaded area, the simulated mechanical losses of the air backflow and the oil backflow are 60,192 and 85,932 W, respectively. The difference between the mechanical losses of these two backflow materials in the unloaded area is 30.0% and larger than the 7.5% difference in the loaded area. Therefore, the backflow materials influence the mechanical loss of the unloaded area more than the loaded area.
The bearing mechanical loss is the product of the shear stress and the area on the rotor-side wall. For a further analysis, the simulated shear stresses on the rotor-side wall are averaged along the axial direction, and the distribution of the average shear stresses is shown below.
The simulated average shear stresses of air backflow and oil backflow from 0° to 180° are 8364 and 9086 Pa, respectively. From 180° to 360°, the simulated average shear stresses of air backflow and oil backflow are 3484 and 5086 Pa, respectively. While the simulated average shear stresses of oil backflow and air backflow in the loaded area have an 8.63% difference, the simulated average shear stress of oil backflow in the unloaded area is 46% higher than that of air backflow. Thus, in comparison with the loaded area from 0° to 180°, the backflow material has a more significant effect on the shear stress of the unloaded area from 180° to 360°, in agreement with the mechanical losses in Table 8. Combined with the pressure contours in Figures 11 and 12, the backflow in the low-pressure unloaded area is more than that in the high-pressure loaded area, leading the backflow material to affect the unloaded area more.
Four peaks of the simulated average shear stress distributions are observed in Figure 13 and they are in the same position as four oil inlet holes. The average shear stresses of these four peaks simulated by the air backflow and oil backflow are 6768 and 9352 Pa, respectively. Considering that the air volume fraction of inlet material is zero, this high shear stress near the oil inlet holes may be related to the low air volume fractions in the supplied lubricant. The mechanical loss and shear stress may have a relationship with the air volume fraction in the bearing lubricants.

Distributions of average shear stresses along the axial direction on the rotor-side wall.
Therefore, taking the real bearing working conditions into consideration, the air backflow can help obtain the accurate bearing mechanical loss and is more suitable than the oil backflow for the journal bearing simulations.
Simulated air volume fraction
The entire viscosity of the mixture material has a negative linear correlation with air volume fractions in equation (6). Based on the relationship between viscosity and shear stress (equation (15)), the shear stress on the rotor-side wall is linearly related to the viscosity. Therefore, the mechanical loss has a negative linear correlation with the material fractions, and a detailed research on the material fractions is shown below

For detailed analyses of the air volume fraction distributions, the air volume fraction contours are shown in Figure 14.

Contours of air volume fraction on the pad-side wall with (a) the oil backflow and (b) the air backflow.
In the center area, regardless of the backflow material is, the air volume fraction distributions are similar. In the loaded area, the air volume fraction simulated by the air backflow is higher than the oil backflow from 100° to 110°. The high air volume fraction leads to a low shear stress from 100° to 110° in the loaded area, in good agreement with the shear stress distribution in Figure 13.
For the unloaded area, the simulated air volume fraction of the air backflow is higher than the oil backflow, especially around the bearing outlets. Compared with the oil backflow, the air backflow takes more air into the low-pressure unloaded area from the bearing outlets than the oil backflow. The high air volume fraction of the air backflow decreases the shear stress and mechanical loss to be closer to the experimental mechanical loss, in consistence with the simulation results in Table 8 and Figure 13.
Moreover, the air volume fraction around the bearing outlets with the air backflow in the unloaded area is much higher than the loaded area. It indicates that the backflow in the low-pressure unloaded area is more than that in the high-pressure loaded area.
In general, the SST model with low-Re correction and air backflow is more suitable than laminar model with oil backflow for simulation of the large, high-speed and high-load tilting-pad journal bearing. The air backflow boundary considers the real air environment around the outlet and leads the air volume fraction to be sufficiently high during the simulation.
Conclusion
In this study, a 3D model with a structured mesh for a tilting-pad journal bearing is constructed. With the suitable gaseous cavitation model based on air solubility included, the SST model with low-Re correction and the air backflow, SST model with low-Re correction and the oil backflow, and laminar model with the air backflow are used for the bearing simulations. In comparison with the experimental data, the conclusions drawn from this work are summarized as follows:
For pressure characteristics, the SST model with low-Re correction performs better than laminar model and is more suitable for simulation of the large, high-speed and high-load tilting-pad journal bearing. With the turbulence effect considered, the highest pressure value of the No. 2 pad simulated by the SST model with low-Re correction is higher than the laminar model and has a 6% difference with the experimental data, accurate enough for journal bearing simulations.
For mechanical loss, the air backflow is closer to the experimental data than the oil backflow and in good accordance with the real working condition. Thus, the air backflow is more suitable to be used in the journal bearing simulations than the oil backflow.
The backflow is more prevalent in the unloaded area than the loaded area. Thus, the backflow material has a significant influence on the air volume fraction in the unloaded area, which results in the change of mechanical loss in the unloaded area.
Footnotes
Appendix 1
Handling Editor: Elsa de Sa Caetano
Declaration of conflicting interests
The author(s) declared no potential conflicts of interest with respect to the research, authorship, and/or publication of this article.
Funding
The author(s) received no financial support for the research, authorship, and/or publication of this article.