
Abstract
In this article, we first research on the relationship between joint damage evolution and peeling stress distribution of carbon fiber reinforced plastic π adhesive-bonded joints by finite element method. According to the damage form of carbon fiber reinforced plastic π adhesive-bonded joints, we established its progressive damage finite element model based on the two-dimensional Hashin failure criterion and cohesive zone model. Then, based on the fiber Bragg grating reflectance spectra at the debonding part during the damage evolution process obtained by simulation analysis, the distribution of peeling stress at the debonding area is reconstructed using the hybrid artificial fish swarm and frog leaping algorithm. The results show that the convergence of the artificial fish swarm and frog leaping algorithm is improved significantly in the early stage, the time consumed in getting out of the local convergence and finding optimal solutions is obviously shortened, and the reconstructed stress distribution is in high agreement with the ideal stress distribution corresponding to numerical simulation, which verifies the feasibility of this method in the damage detection of carbon fiber reinforced plastic π adhesive-bonded joints.
Keywords
Introduction
Carbon fiber reinforced plastic (CFRP) π adhesive-bonded joints have become the principal joint for mutually orthogonal components in aerospace vehicles because bonding does not cause stress concentration resulted from drilling and does not destroy the fiber structure of adherends, and are characterized by a small number of parts and strong design flexibility.1–3 However, the performance of adhesive-bonded joints is affected by the physical properties of materials, newly added bonding interfaces, and environmental factors, and its failure forms are more complicated than the mechanical connection. Therefore, it is of great significance to detect the internal damage of joints with appropriate and effective methods for the structural safety of aerospace vehicles.4–6
Fiber Bragg grating (FBG) is very suitable for the damage monitoring of CFRP π adhesive-bonded joints because of its small volume, lightweight, excellent capability for distributed measurement, and good compatibility with composite materials. 7 R Jones and S Galea 8 used FBG sensors to monitor the structural health status of composite joints and demonstrated the feasibility of using FBG to monitor damage. The distorted reflection spectrum of the FBG will recover its original shape after releasing the nonuniform strain. Based on this phenomenon, S Minakuchi et al. 9 proposed using FBG sensor to monitor the debonding condition of honeycomb sandwich structure. Based on the appearance of new peak in the reflectance spectrum, S Takeda et al. 10 indicated that the debonding phenomenon and the peak strength increase with the debonding length. The debonding length of the composite patch was monitored by the spectral changes of the FBG sensors. Palaniappan and colleagues11,12 monitored the initiation and evolution of debonding phenomenon of single-lap joint based on the FBG reflection spectra of different debonding lengths. The experimental results are in good agreement with the simulation. C Schizas et al. 13 used FBG sensors to monitor the delamination and debonding of the bonded areas of composites. In their research, the distribution of strain was determined by the wavelength shift of FBG to determine the delamination and debonding of composites. Q Chang et al. 14 found that FBG sensors could be applied to the structural health monitoring of aerospace materials and accurately measure the location and degree of structural damages. X Ning et al. 15 introduced a crack detection method based on the longitudinal strain distribution measured by embedded FBGs to estimate the cracks that occurred at the adhesive interface of the single-lap joints. S Jiang et al. 16 proposed a method to measure the elastic modulus of CFRP based on FBG reflectance spectrum analysis. C Song et al. 17 calculated the reflection spectrum of FBG for reconstructing the adherend strain profile of FBG sensing area with the dynamic particle swarm optimization algorithm. H Haixiao 18 used the spectral distortion of built-in FBG sensors to monitor the damage of the adhesive-bonded joints to speculate the debonding length of the joints, but could not predict the damage. The first peak and the last peak of reflectance spectrum show a linear relation. Based on this phenomenon, A Trilaksono et al. 19 studied the relationship between the change of FBG reflectance spectrum and debonding damage evolution of bonded joints. P Xiao et al. 20 arranged FBG sensors to realize the real-time monitoring of initiation and expansion of debonding in the interface but did not consider the impact of unequal strain on the spectrum.
In summary, the existing studies based on FBG sensing for damage detection focus on the debonding of adhesive-bonded joints and mainly judge the debonding through the changes of the central wavelength of FBG reflection spectrum while ignoring the gradient information of the stress distribution at the damage parts. Thus, the information of damage evolution cannot be accurately obtained. This article, by establishing the progressive damage model of CFRP π adhesive-bonded joints, sums up the relationship between damage evolution and peeling stress distribution changes, and, based on the hybrid artificial fish swarm and frog leaping algorithm (AF-FLA), reconstructs the peeling stress distribution in the FBG sensing zone of CFRP π adhesive-bonded joints, which verifies the feasibility of this method in the damage detection of the CFRP π adhesive-bonded joints.
Progressive damage model
The damage of CFRP π adhesive-bonded joints mainly includes the damage of the adherends and the adhesive layer. Therefore, the progressive damage model of joints should consider the damage of the adherends and the adhesive layer.
Hashin failure criterion
The thickness of each adherend is small relative to the length and width, and can be reduced to thin sheets. This article uses the two-dimensional Hashin criterion as the damage criterion for the CFRP bonded parts. Its expression is as below.
Fiber tensile failure

Fiber compression failure

Matrix tensile failure

Matrix compression failure

where
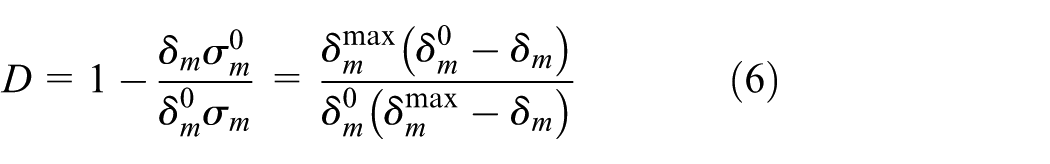
Failure criterion of cohesive elements
Based on the cohesive elements, simulation of the delamination damage and damage of the bonded layer of adherends is conducted, which is generally divided into two steps: generation of initial damage and propagation of damage. In this article, the criterion of secondary stress is used as the criterion for the initial damage of the cohesive elements (unit stiffness starts to degrade), and the energy-based B-K damage propagation criterion is used to judge whether the cohesive elements are degenerate or not. As shown in Figure 1, a bilinear constitutive model is used to describe the stiffness degradation process of the cohesive elements.

Bilinear constitutive model.
The

where
Simulation analysis of the CFRP π adhesive-bonded joint
The CFRP π adhesive-bonded joints consist of web, skin, and π-shaped parts that are bonded. The π-shaped part is formed by co-curing the L-shaped layer, the U-shaped layer, and the horizontal layer. The angle of layer for each CFRP bonded parts is 0°. The structure of adhesive-bonded joints is as shown in Figure 2, and the dimensional parameters of each component are shown in Table 1.
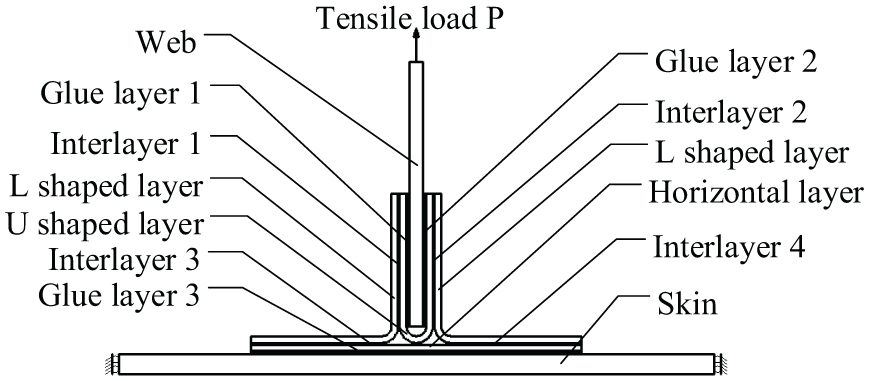
Structure of the CFRP π adhesive-bonded joint.
Dimensional parameters of the CFRP π adhesive-bonded joint.
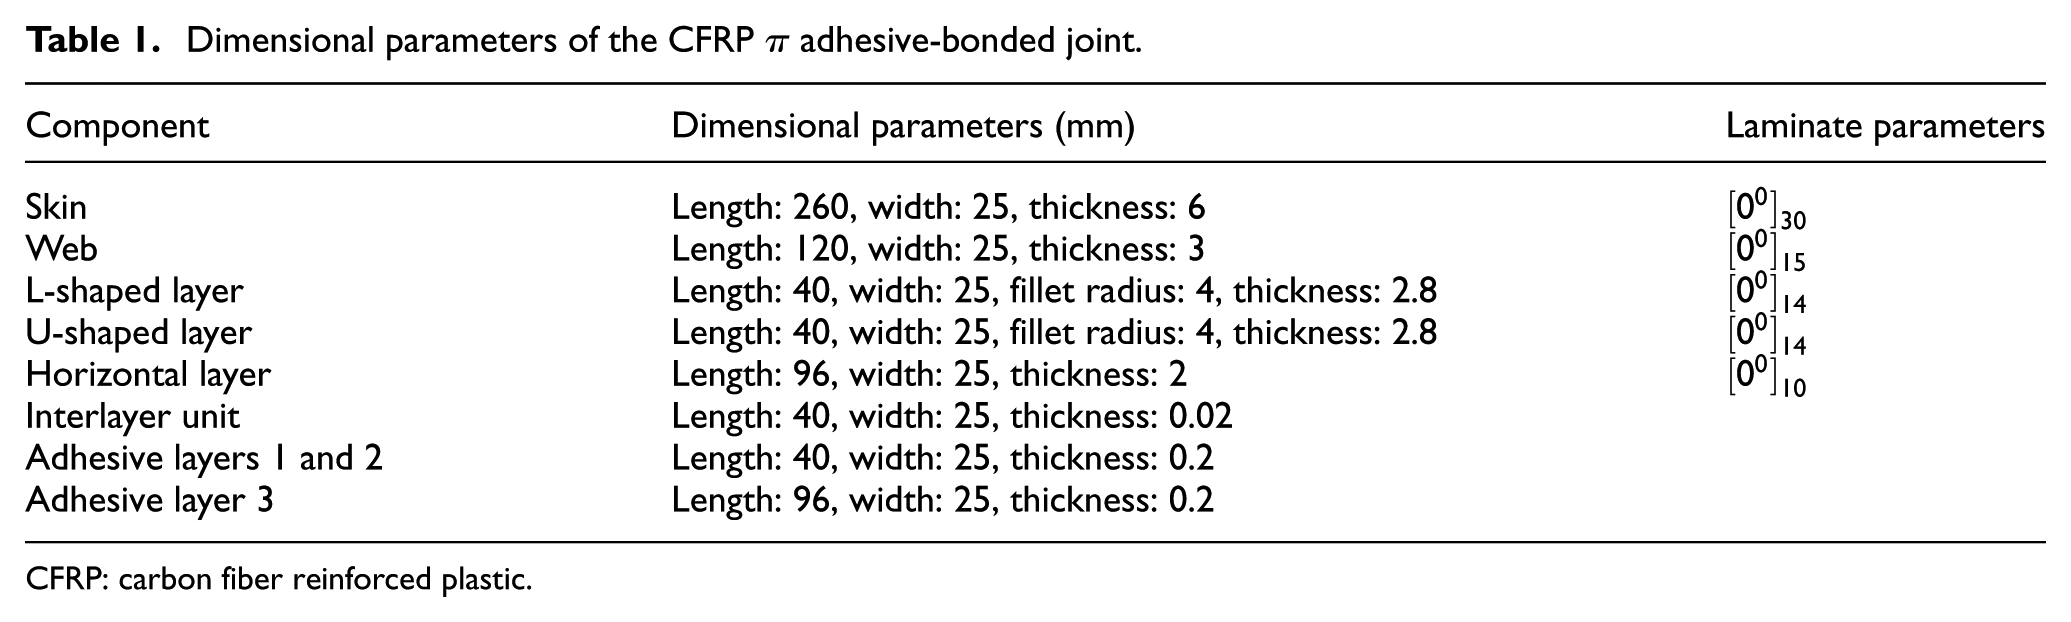
CFRP: carbon fiber reinforced plastic.
Finite element model of the CFRP π adhesive-bonded joint
The three-dimensional finite element model of the CFRP π adhesive-bonded joint in ABAQUS/CAE and its boundary condition is shown in Figure 3. In this article, the unit type of the CFRP adhesive parts is SC8R, the unit type of adhesive layer is COH3D8, and “Tie” is used as the contact condition in this finite element model. The whole loading process is divided into 50 steps, and the load applied at each step is 200 N. The stiffness degradation exponent scalar stiffness degradation (SDEG) is used to detect initial damage and damage propagation of adhesive layer in this article.
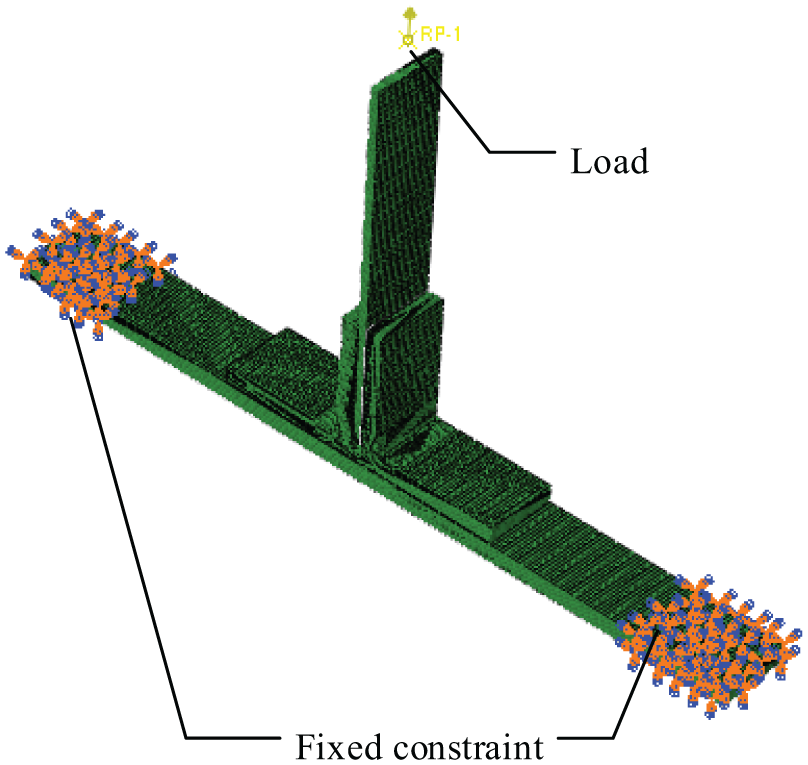
Finite element model of the CFRP π adhesive-bonded joint.
The CFRP adherends are stacked by using the FAW200RC38 unidirectional carbon fiber prepreg of Lianyungang Zhongfu Shenying Carbon Fiber Co., Ltd, http://www.zfsycf.com.cn/. The adhesive type used is Araldite® 2015 with the material properties shown in Tables 2–5.
Material property of Araldite® 2015 adhesive.

Mechanical property parameters of FAW200RC38.

FAW200RC38 interface material parameters.

FAW200RC38 Hashin failure parameters.

Analysis of the numerical simulation results
The simulation results show that under the out-of-plane tensile load, the damage of CFRP π adhesive-bonded joints mainly occurs between the L-shaped layer and the horizontal layer of π-shaped parts. Therefore, the damage evolution of the π adhesive-bonded joints can be characterized by the damage evolution of interlayer units (interlayer unit 3 or interlayer unit 4) between the L-shaped layer and the horizontal layer. For the convenience of viewing the damage evolution process at interlayer, the picking path of the peeling stress is shown in Figure 4.

Peeling stress picking path of interlayer units.
SDEG analysis of stiffness degradation
Figure 5 is the curve of the stiffness degradation index SDEG (SDEG > 0: occurrence of initial damage; SDEG = 1: complete damage) of the first three nodes on the pick path changing with the load. From Figure 5, it can be seen that damage occurring in interlayer elements extends from left end to the right end as the load increases. When the load reaches 2000 N, initial damage at the interlayer units occurs, and complete damage occurs when the load reaches 5600 N.

SDEG curve changing with load.
Distribution analysis of peeling stress
The peeling stress distribution of the interlayer units is shown in Figure 6. It can be seen that when the tensile load is less than 2000 N, the peeling stress increases with the load increase, and the peak value of peeling stress appears at the end of the interlayer; when the load reaches 2000 N, the stiffness of the interlayer units at the end degrades, and the peeling stress gradually decreases. As the tensile load increases, the peak value of the peeling stress gradually shifts toward the other end; when the load exceeds 5600 N, the stiffness at the left end completely degrades, and the peeling stress decreases to 0; as the load increases, the 0 peeling stress region gradually derives from the end to the interior.

Distribution curve of peeling stress.
In summary, the changes in the peeling stress distribution of the interlayer units can be used to describe the damage evolution process of the interlayer units. Specifically, when the peak peeling stress appears at the end of the interlayer and increases with the load, no damage occurs to the interlayer units. When the peeling stress gradually decreases and the position where the peak peeling stress occurs shifts from the end of the interlayer to the interior, the interlayer units are damaged. When the peeling stress of interlayer units decreases to 0, the interlayer units are completely damaged. Therefore, it is possible to detect the damage of interlayer units through the changes of peeling stress by embedding FBG sensors at the damaged parts along the pick path.
Peeling stress reconstruction withAF-FLA
The peeling stress at the damaged parts presents high nonlinearity. The traditional wavelength demodulation method ignores the gradient information of the peeling stress distribution and cannot accurately perform the damage detection of the π adhesive-bonded joints. Therefore, in order to retain the gradient information of the peeling stress field in the damaged area, reconstruction of the peeling stress distribution based on reflection spectrum is of great significance for accurate and effective damage detection of π adhesive-bonded joints.
Calculation of FBG reflectance spectrum under unequal transverse stress
When FBG sensors are in the uniform transverse stress field, the strain of FBG is 21
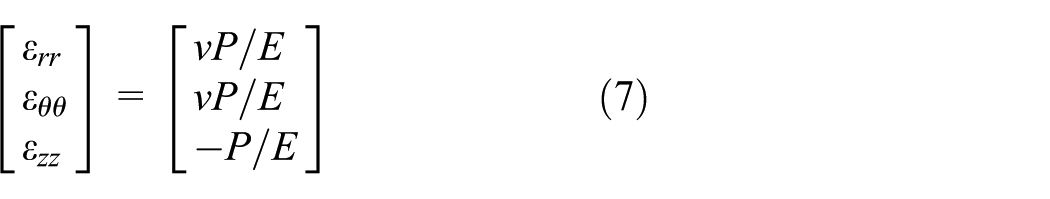
In equation (7), P is the transverse stress of FBG;
The peeling stress of CFRP π adhesive-bonded joints is nonuniform, which results in the unequal strain in the axial direction of the embedded FBG sensors and that it is impossible to use the coupled mode theory directly to calculate the reflection spectrum. According to the structural characteristics of FBG and T-matrix method, it can be seen as a series of segments.
22
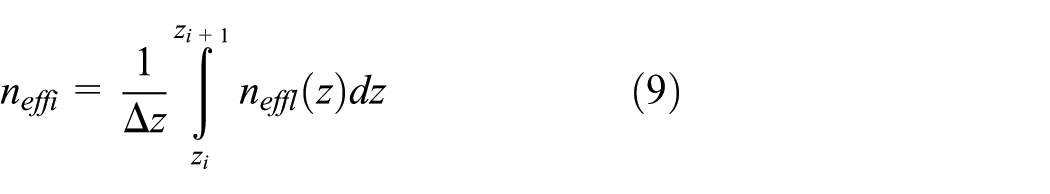
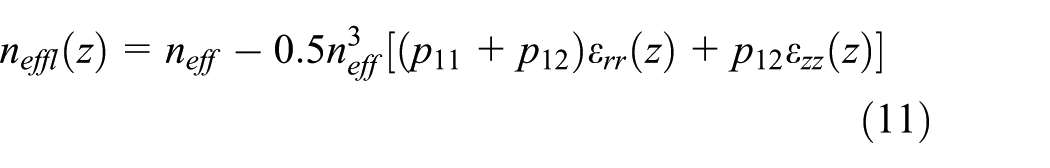
Therefore, the grating with unequal strain can be divided into M segments of sub-gratings. The strain in each sub-grating can be considered as approximately uniform. That is, in each sub-grating segment, the grating has the same period

where

In the formula,
According to the coupled mode theory, the DC self-coupling coefficient


In the formula,
The transmission matrix Qi expression of each fiber grating segment is

where
Since the entire FBG segment is formed by connecting various fiber gratings in series, the transmission characteristics of the entire FBG obtained are as follows

The reflectivity of the entire FBG segment can be expressed as

Reconstruction of peeling stress distribution with intelligent algorithm
Artificial fish swarm algorithm (AFSA) is an optimization algorithm that simulates the fish swarm foraging process. 23 Using the behaviors of foraging, clustering, tailing, and randomness of fish swarm, it achieves the goal of optimization. Clustering and tailing behaviors urge the entire fish swarm to swim toward the global optimal range in the early stage, so the early convergence speed of the fish swarm algorithm is faster; as the optimal range is reached, the tailing and random behaviors avoid overcrowding of the fish swarm, but increase its blind behavior, which hinders the search for optimal solution within the later stage, so the late convergence speed is slow.
Frog leaping algorithm (FLA) is an optimization algorithm that simulates the frogs searching for food. 24 Similar to the AFSA, FLA takes the parameter variable as the coordinate position of the frog, and the optimal solution of objective function as the food coordinate. In the optimization process, FLA conducts local search for the frog swarm by ranking the frogs in the group and partitioning the whole swarm into a series of subpopulations, and implements the overall optimization of the frog swarm by continuously improving the worst frog position in the frog group. Therefore, the frog position update strategy adopted by FLA is more directional, and the local search optimization capability in a small regional space is very strong.
AFSA has a fast search speed in the early stage and can quickly search and lock the global optimum area to be sought. FLA has a strong local search capability. Therefore, by comparing and combining the advantages of both, this article presents a hybrid AF-FLA to improve the overall algorithm convergence speed and optimization accuracy.
To apply the hybrid algorithm of artificial fish swarm and frog leaping to reconstructing the peeling stress in the FBG sensing region, the key lies in the determination of objective function and the organic integration of the two algorithms. Flowchart of the solution process is shown in Figure 7. In terms of algorithm integration, this article integrates the foraging and clustering behaviors of fish swarm algorithm into the FLA to find the optimal region in the early stage. In terms of objective function, the reflection spectrum calculated with the numerical simulation described in the “Calculation of FBG reflectance spectrum under unequal transverse stress” section is used as the ideal spectrum. The difference between the ideal reflectance spectrum and the reflectance spectrum corresponding to the reconstructed peeling stress distribution (i.e. the difference of the corresponding reflectivity) is used as the fitness function. The calculation formula is as follows

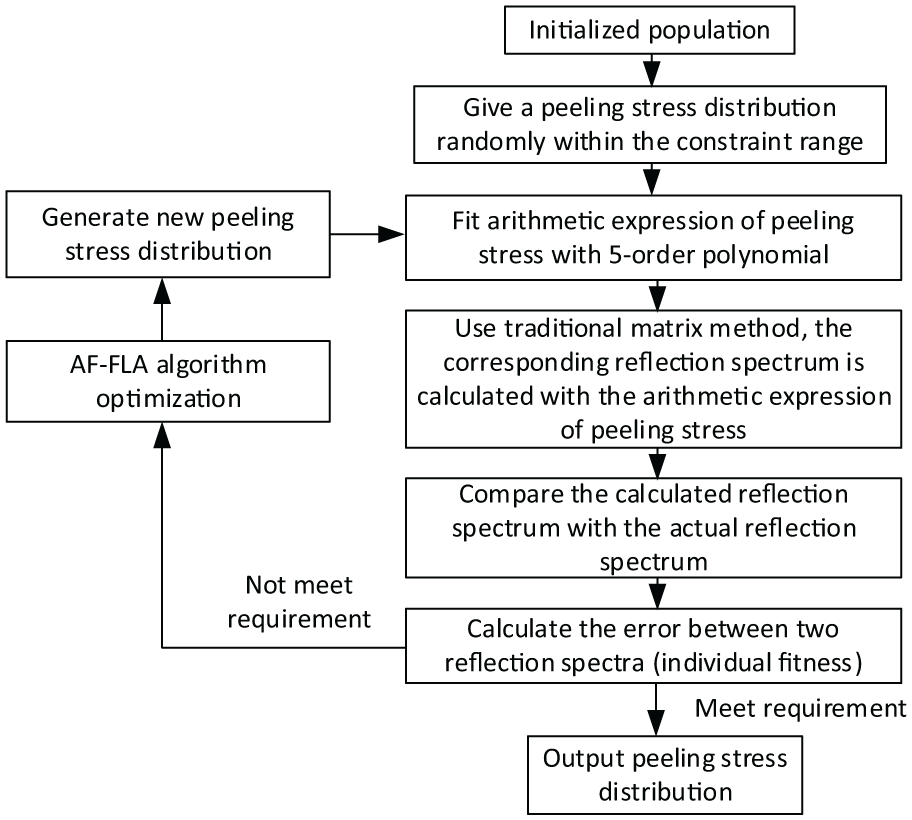
Flowchart of peeling stress distribution reconstruction based on AF-FLA.
In the formula,
Reconstructing result analysis of peeling stress distribution
In this article, the distribution of peeling stress is reconstructed by AF-FLA. The number of variables is set as 21, the number of iterations is 400, and the population size is 20. The peeling stress distribution under the typical loads of 2000, 3000, 4000, and 5000 N is selected to reconstruct. Figure 8 shows the reconstruction results of the peeling stress of CFRP π adhesive-bonded joints. From the figure, we can see that the reconstructed stress distribution curve basically coincides with the ideal stress distribution curve, which well ensures that the inhomogeneity and gradient information of the peeling stress distribution in the FBG sensing region are retained.
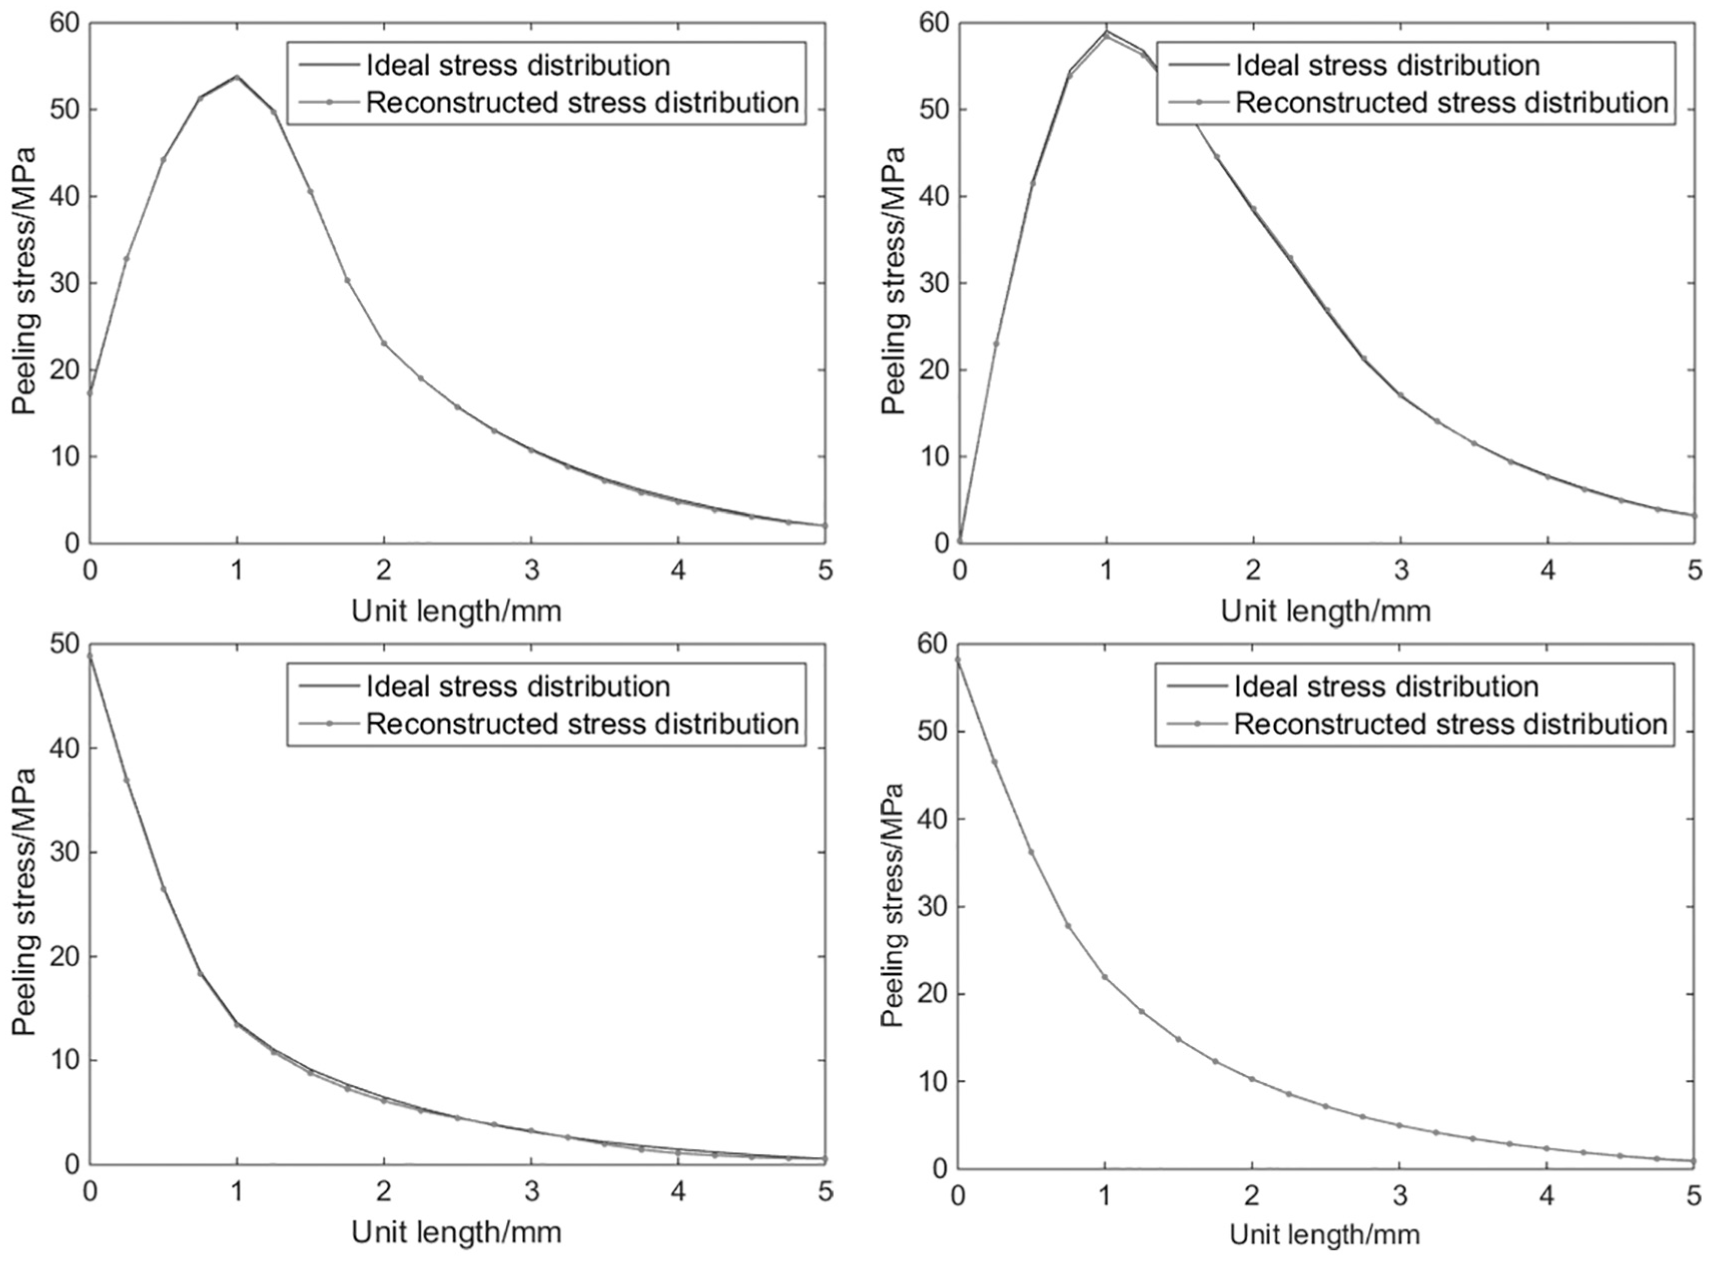
Reconstruction structure of peeling stress in FBG sensing region with AF-FLA.
In order to quantify and measure the accuracy of reconstruction, four precision indexes the same as Zhang et al. 25 are used in this article for analysis. Table 6 shows the accuracy analysis results of strain distribution reconstruction under the action of four different loads. Under the same conditions, the solution quality between FLA and AF-FLA is also compared. Figure 9 shows the best fit of the iterative step size for the FLA and the AF-FLA at 4000 N.
Error analysis of peeling stress distribution reconstruction under typical loads.

CC: correlation coefficient.

Iterative graph of FLA and AF-FLA.
The results in Figure 9 indicate that, compared with FLA, AF-FLA has a significant improvement in its early-stage convergence ability and can quickly get out of the local convergence. Table 6 shows that the correlation coefficient (CC) of the reconstructed stress distribution and the ideal stress distribution under different loads is not lower than 0.99, the root mean square (RMS) does not exceed 0.3084 MPa, and the maximum error (ME) does not exceed 0.6515 MPa. The quoted error (QE) does not exceed 0.8145%. AF-FLA has a good reconstruction effect on the stress distribution reconstructed under different loads. Therefore, with the reconstruction of the peeling stress of FBG sensing region based on the AF-FLA, combining the relationship between the changes of peeling stress distribution and the damage evolution, the damage detection of CFRP π adhesive-bonded joints can be realized.
Conclusion
In this article, the finite element model of progressive damage of CFRP π adhesive-bonded joints is established, and the relationship between the damage evolution of CFRP π adhesive-bonded joints and the changes of peeling stress distribution is summarized. Then, based on the AF-FLA, the peeling stress distribution in the damaged region is reconstructed. The numerical simulation shows that the reconstructed strain distribution has high accuracy and retains its gradient information well, which provides a new method for the measurement of peeling stress unequally distributed in the damaged region of CFRP π adhesive-bonded joints and lays a theoretical foundation for its damage detection.
Footnotes
Handling Editor: Michal Kuciej
Declaration of conflicting interests
The author(s) declared no potential conflicts of interest with respect to the research, authorship, and/or publication of this article.
Funding
The author(s) disclosed receipt of the following financial support for the research, authorship, and/or publication of this article: This work was supported by the National Natural Science Foundation of China (Project No. U1537103) and the Fundamental Research Funds for the Central Universities (WUT: 2018III072GX).