
Abstract
This article reports on an application of the k-nearest neighbours pattern recognition and classification technique to condition monitoring in a full-scale, water-filled siphon that is located beneath the underground. An experimental facility has been designed and constructed at the University of Bradford to study using acoustic waves as excitation to observe the characteristics of pipe sediments and wall damages on an underground sewer siphon. The effects of different amounts of sediment inside the siphon and different size of artificial damage on the pipe wall have been studied. The sound pressure level and acoustic energy were calculated from the acoustic signals which were recorded from three hydrophones under several representative siphon conditions to extract useful features in order that the proposed k-nearest neighbours classification algorithm could be applied. It has been proven that acoustic-based approach is capable of providing sufficient information on the condition of pipes for reliable classification and fault detection.
Introduction
Water distribution systems are key elements of urban water infrastructure. These systems are gradually deteriorating due to their ageing, operational stresses and external environmental conditions. 1 A majority of these assets are hidden underground so that they are difficult to access for routine visual inspection. As a result, there is a need for a robust, remote method of inspection that can be used to detect a critical change in order to optimise their maintenance costs, or ensure timely rehabilitation work. 2 For the inspection of water pipes, a few techniques have been developed and used in the field, for example, closed circuit television (CCTV) and laser scan are well-adopted visual inspection techniques which however are only operational above waterline.3,4 In addition, various geophysical techniques, such as ground penetrating radar (GPR) exist to assess the exterior of pipes.5,6 In recent years, there has been a growing interest in using acoustic technologies for condition monitoring applications such as sonar profiling system, guided wave ultrasound and a number of multi-sensors systems are in development.7–9
Sound waves can propagate through media which is inaccessible to light or electromagnetic radiation. These media include water filled drainage pipes in which the turbidity of water is too high to be able to use conventional CCTV inspection method. 10 The frequency composition, temporal patterns and energy of the sound waves which propagate through a pipe are coloured by the structure conditions of the pipe walls, quality of the pipe joints, wall roughness and by the amount of sediment present in the pipe. 11 This information can be used directly, or after some conditioning, in the pattern classification process. In this process feature, extraction is a critical step as we desire to extract only those features representing the characteristics of this process by separating them from various unwanted disturbances. There are a large number of signal processing methods available to extract meaningful features from the recorded sounds, such as Short-Time Fourier Transform (STFT), Wavelet Transform (WT), Mel-Frequency Cepstral Coefficients (MFCCs) and Wigner-Ville Distribution (WVD). 12 Many of these methods have been developed and tested extensively condition classification with acoustic means through hidden Markov models (HMMs), k-nearest neighbours (KNN), decision trees or neural networks. 13 Although these algorithms have been developed and applied successfully in areas like biometrics, no extensive applications were found in the condition monitoring of buried civil facilities. 14 Therefore, it is important to study and reveal the patterns that represent particular condition states, and to discover the relation between acoustic features and a series of patterns labelled by a full-scale model of a hydraulic siphon.
In this analysis, the sound pressure level of the acoustic signals emitted in the siphon were analysed using the Schroeder integration method within a number of different frequency bands. The acoustic energy contained in each of the filter bands was then used as meaningful feature for condition classification. The acoustical signals used in analysis were collected from a hydrophone array. KNN classification method was then trained and applied to determine the structural and operational conditions in the siphon. Although there are many studies for general purpose of sound/speech recognition system in the literature, the available water-filled acoustic signal recognition studies are limited. One example work developed in Yuan et al. 15 using Tikhonov regularisation to establish the optimization objective function. In another study, 16 acoustic signals were modelled by matched field processing in the frequency domain. The proposed KNN classification system is different from the other methodologies by acoustic energy and combines with KNN classifier, it is tested to be reliable under various pipe conditions including sediment and damage with pipe being surrounded by different medium.
Experimental methodology
Experiment setup
A 4.2 m long and 2.0 m high siphon using sections of 450 mm concrete pipes was installed on a 500 mm layer of fine sand in an open top box made of 12 mm plywood as shown in Figure 1. The siphon was filled up with clean water to the level of 900 mm below the top rims of the vertical parts, and the water level remained during all the experiments as reference. The siphon was instrumented with four 25 mm hydrophones (Type SQ31 by Sensor Technology Inc. Canada), hydrophone 1–hydrophone 3 were installed in the left leg of the siphon (The hydrophones are named with capital letter H followed by a number which is addressed to its position in the test rig in the following text). Hydrophone 4 was installed in the right leg of the siphon 30 mm above the speaker and used as a reference receiver as shown in Figure 2. The source was a 50 mm diameter water resistant speaker that was situated in a polyvinyl chloride (PVC) enclosure (Type K50WP by Visaton Germany). The speaker and three hydrophones were securely attached to two aluminium tubes and placed into the opposite legs of the siphon and kept at the same positions in all of the experiments conducted in the siphon. Figure 2 illustrates schematically the arrangement of this experiment.

Experimental siphon constructed in the hydraulics laboratory at the University of Bradford.

Structure of the siphon and acoustic sensors.
The data acquisition system consisted of the following: (1) a computer (with a sound card) installed with WinMLS software; (2) four 8-channel high-pass hydrophones, (3) a B&K Type 2610 measuring amplifier and a dual variable filter Kemo VBF 10M filter and (4) a B&K Type 2708 power amplifier to drive the underwater speaker. In addition, the experiment operators were able to hear and control the quality and the stability of the sound produced by the underwater speaker using a stereo amplifier and headset.
Laboratory data collection
Three different siphon conditions were simulated in the laboratory. They were as follows: (1) clean siphon with no damage, (2) siphon with variable amount of sediment and (3) siphon with six different artificial cuts. The sediment was simulated with acoustically transparent bags filled with fine sand. A maximum of 10 bags were used in this experiment, each bag weighted approximately 1 kg. The maximum cross-sectional dimension of one sandbag corresponded to approximately 20% of the pipe cross section. Several bags at a time were tied to a 9 m rope separated by a 300 mm distance, the number of bags deposited in the horizontal section of the siphon by these means varied from 1 to 10. Wall damages were created on the horizontal section of the siphon, the first type being a lateral cut of size 50 mm long. Its length was then increased to 100 and 200 mm to study the effect the extent of damage had on the quality of the pattern recognition algorithm. Another type of damage was a 55 mm longitudinal cut located at 1.5 m on the right of the lateral cut. The length of this type of cut was subsequently increased to 150 mm and was eventually converted into a 120 mm × 70 mm hole. These conditions are illustrated in Figure 3(a)–(d).

Siphon conditions simulated in the laboratory: Sandbags (a) and damages: lateral cut (b), longitudinal cuts (c) and manhole (d) on the pipe wall.
Signal pre-processing
Acoustic impulse response
WinMLS software controlled the sound card which generated a 10 s sinusoidal sweep (chirp) in the frequency range of 100–6000 Hz. Sinusoidal sweep (chirp) is widely used excitation signal to measure the transfer function. Chirp-based measurements are considerably less vulnerable to the deleterious effect of time variance, and they are best suited for outdoor measurements in presence of dynamically rough water surface. 17 The signal was repeated eight times and averaged to increase the signal-to-noise ratio. The sounds received on the four hydrophones were digitised at 22,050 Hz sampling rate and recorded on the PC.
Examples of the typical signal recorded in the clean siphon and in the siphon with two sandbags on the hydrophone array are given in Figure 4(a) and (b), respectively. Original acoustic signals received on hydrophones H1–H3 were de-convolved using the convolution theorem

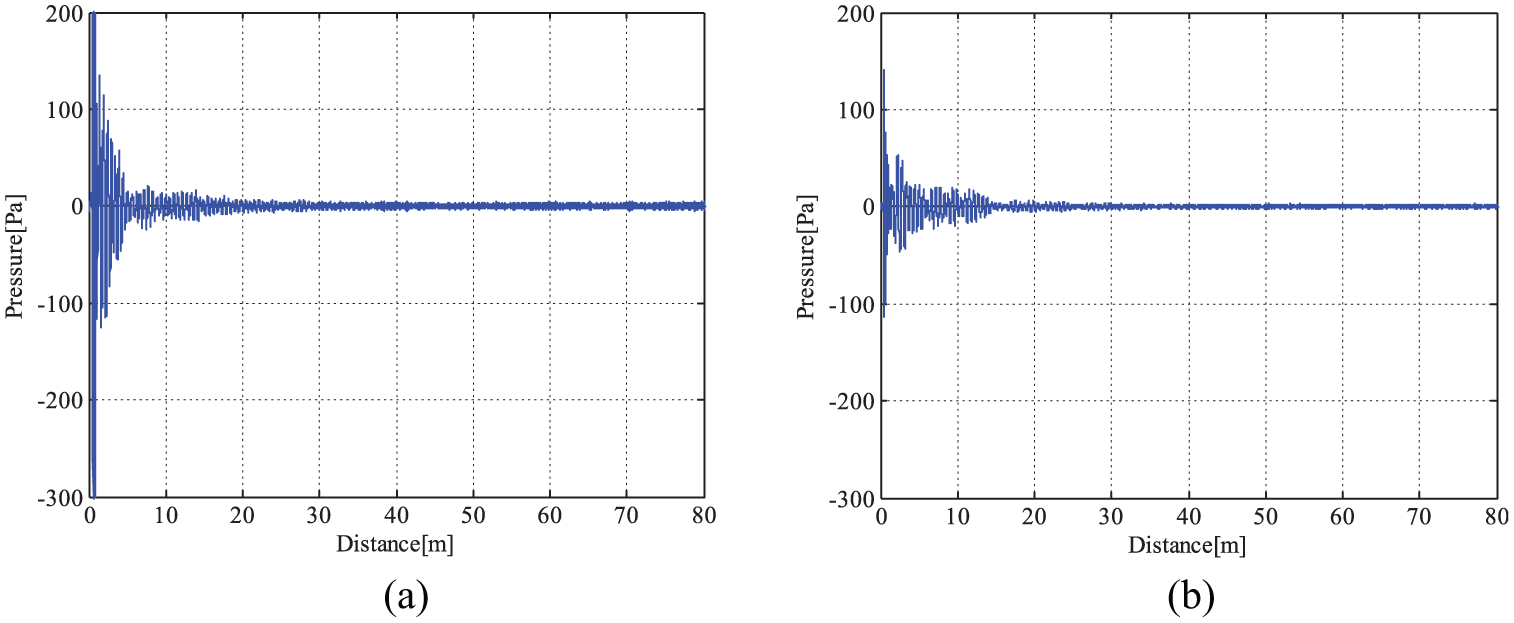
Acoustic pressure impulse response of clean siphon (a) and two sandbags in the siphon (b).
To obtain acoustic pressure response
The signals recorded on the three hydrophones were filtered in five filter bands. In the case of the blockage condition, these five 600 Hz bands split equidistantly in the 100–3000 Hz frequency range. It was found that the sound pressure did not depend on the amount of blockage beyond 3000 Hz. In the case of the siphon with damage, the recorded signals were filtered in five 1000 Hz bands in the 100–5000 Hz frequency range. In this case, the sound pressure was found to be relatively insensitive to a change in the amount of damage at frequencies above 5000 Hz.
Sound pressure level
The impulse response obtained from equation (1) was then used to determine the sound pressure level as a function of time according to the Schroeder integral 18

where

Sound pressure level of clean siphon, two sandbags and six sandbags in the siphon at frequency band 600–1200 Hz (a) and 1200–1800 Hz (b).

Sound pressure level of undamaged siphon, 200 mm slit and 200 mm slit + 1 manhole on the pipe wall at frequency band 1000–2000 Hz (a) and 2000–3000 Hz (b).
Feature extraction
Energy calculation
The feature extraction process was based on the estimation of the acoustic energy in the impulse response at a given instant. The acoustic energy 19 was calculated as

where the times
Data tensor construction
Training data used in this work relate to a set of meaningful features that reflected the behaviour of the acoustic energy. These data were extracted from the acoustic signals collected from a range of known siphon conditions and used to provide criteria to compare against new data. The new data, or testing data, were collected from unknown siphon conditions. These data were used to study the performance of the classification algorithm, which was based on the KNN algorithm. The acoustic energy calculated for a range of known conditions was used to construct a four-dimensional (4D) training data table or 4D tensor

Table 1 presents an example of such data set for a range of blockage conditions. This table was constructed using the impulse response recorded on hydrophone 1 for 11 blockage conditions which are listed in the form of 11 rows and 6 columns (time windows). One particular frequency band (100–600 Hz) was used in the analysis. These data can be organised in the form of the following energy matrix
The acoustic energy as a function of time and amount of porous sediment measured in the frequency band of 100–600 Hz.
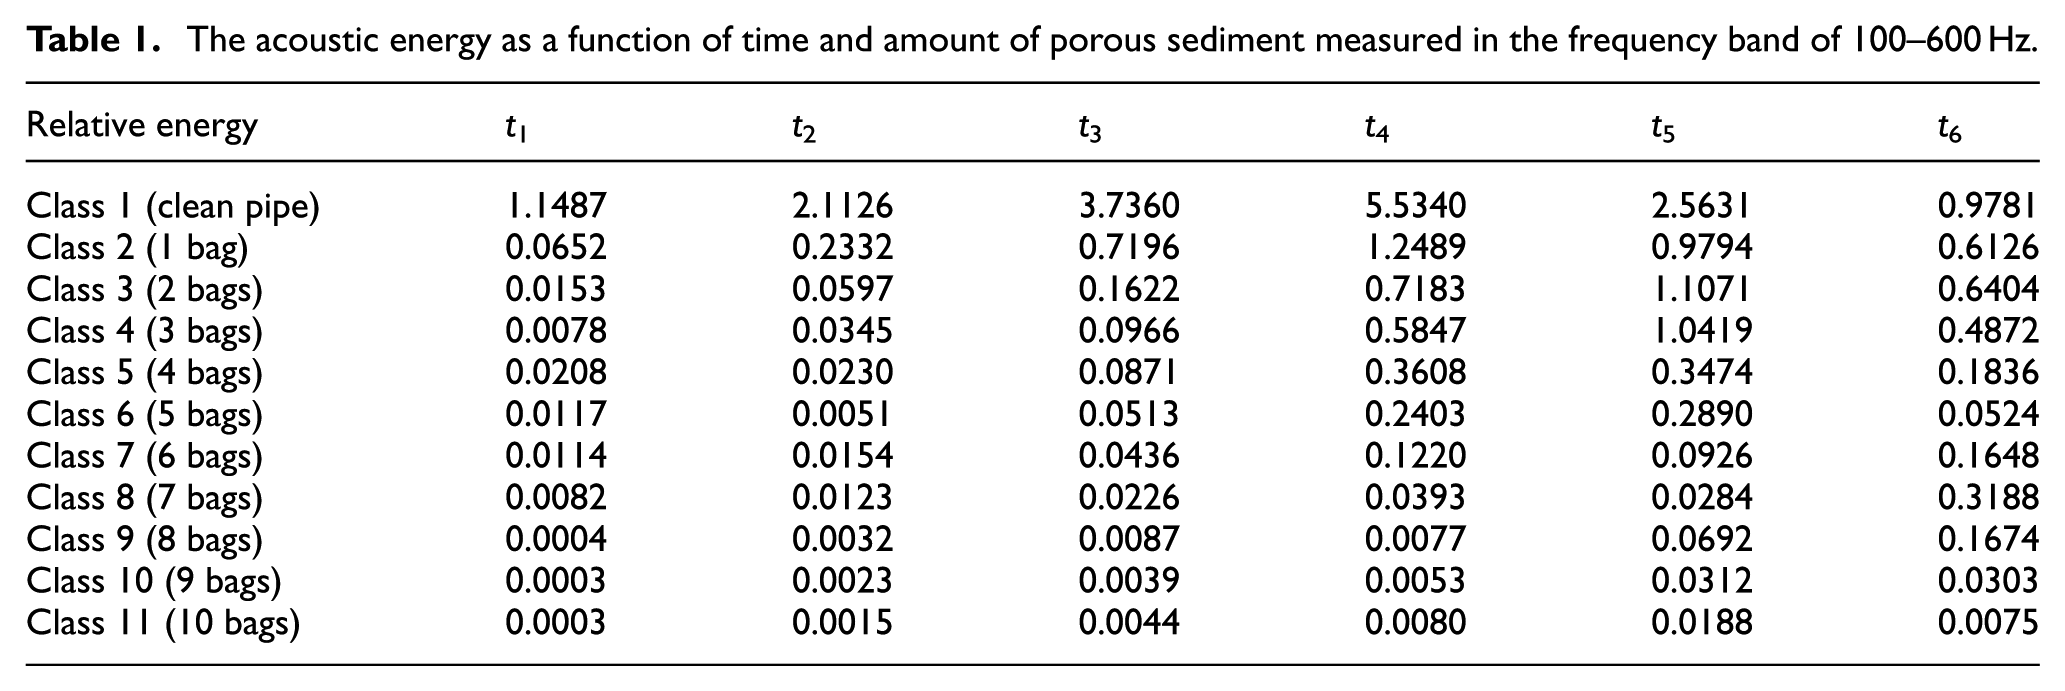
The acoustic energy training data matrix in Table 1 clearly illustrates that increasing the amount of porous sediment in the siphon results in a noticeable decrease in the calculated acoustic energy in all of the six time intervals. This decrease is particularly dramatic as the condition changes from one to four sandbags. A clear pattern in the behaviour of the acoustic energy as a function of the time interval can also be observed. The acoustic energy measured in the time interval
The damage condition training data tensor was created in the same manner. The elements in this tensor are the acoustic energies calculated using a different data set obtained independently in an experiment when controlled damage was inflicted to the siphon. The 4D of this tensor here correspond to the number of siphon damage conditions, six time windows, five frequency bands and three hydrophone channels. Table 2 presents an example of the damage condition training data matrix which was constructed using the signal recorded on hydrophone 1 and filtered in the frequency range of 100–1000 Hz.
The acoustic energy as a function of time and amount of porous sediment measured in the frequency band of 100–1000 Hz.

Testing data were used to extract features from signals collected from unknown siphon conditions. Each of these data sets was organised in the form of a tensor using the procedure similar to that discussed in the previous paragraph. We used five sets of testing data recoded in the siphon with a blockage and five sets of data recorded in the siphon with some damage. For each unknown condition, a
Condition classification
KNN algorithm
KNN is a commonly used classification method which is based on the use of distance measures.
13
Given an unlabelled test data

where

where the 3D condition number tensor
In general,
Decision making
Majority vote is a decision rule used in KNN classification method that normally select the number appearing more than half out of all numbers, 13 but if there are more than two classes that the numbers can be divided among, then the number which has the highest times of appearance would make it the majority vote. The majority rule can stand even if there is only one more appearance for this number.
This section presents the majority vote which was applied progressively to 1D, 2D and 3D condition number tensor
Example applications of the majority vote analysis to blockage and damage test data.

1D: one dimension; 2D: two dimensions; 3D: three dimensions.
A stands for ‘ambiguous result’, that is, when no certain decision can be made based on MV.
Majority vote was applied to each row of
The probability distribution was also calculated for 2D and 3D condition numbers using the following equation

where N is the number of all condition estimations and
The statistical probability for the correct classification was calculated as the proportion of the correct classification instances observed in the 3D index tensor
Proportion of the correct condition estimations from the index tensor

MV: majority vote; 1D: one dimension; 2D: two dimensions; 3D: three dimensions.
The probability of the correct classification for the algorithm based on the 3D index tensor
Figures 7 and 8 present the probability as a function of the condition number of all five test data sets for the blockage and damage conditions, respectively. Each of these graphs shows a maximum which corresponds to the condition number that occurs most often in the test data set. In the blockage experiment, the amplitude of this maximum tends to reduce with the increased amount of sediment deposited in the pipe. In the damage experiment, the amplitude of this maximum is relatively unaffected by the extent of the damage inflicted on the siphon. In both experiments, the maximum in the probability data remained sufficiently distinct to be used for condition classification.

The probability density functions for the blockage condition estimation based on five sets of test data: 2D (left) and 3D (right).

The probability density function for the damage condition estimation based on five sets of test data: 2D (left) and 3D (right).
The results of damage classification are less ambiguous than the results of blockage classification. One explanation for this difference is that the positions of acoustic source and hydrophones were undisturbed when more damage was inflicted to the pipe. On the contrary, the position of the source and receive array were disturbed each time when more sediment was added to the siphon to simulate the blockage evolution. In this way, the recorded acoustic impulse response was affected in the blockage experiment. This phenomenon relates to the multi-modal nature of the sound field in the siphon and strong variations in the sound field as a function of the sensor position. It was noticed that using acoustic energy as a feature to discriminate between damaged siphon conditions by applying KNN algorithm and majority vote wisely can achieve more accurate results. The results of the 1D classification analysis suggest that unfiltered acoustic data can provide sufficient information to correctly identify various damage conditions.
Summary
Acoustic signals were collected from a range of typical blockage and damage siphon conditions which were recreated in the laboratory. The sound pressure level was calculated so that the acoustic energy as a function of time could be determined and used as a feature in the classification analysis. Original broadband signals recorded on hydrophone 1 were used for 1D analysis, and these signals were then filtered by Chebyshev type I digital filter in several narrow frequency bands and used in 2D analysis. More acoustic data recorded on hydrophones 2 and 3 were added to the analysis to make it 3D.
KNN was used as classification method to classify the siphon conditions. The acoustic technique and the adopted KNN classification system are proved to be capable of discriminating different siphon conditions collected under blockage and damage conditions were used to provide training and testing data for classification. For blockage conditions, acoustic data in the lower frequency bands contain more useful information than those filtered through the higher frequency bands. Therefore, 2D and 3D data analysis yielded better a classification than 1D data. Majority vote improved the performance of the classification algorithm by removing some uncertainty from the data. Damage classification results cannot be improved by increasing the number of the index tensor dimensions used in the analysis. This suggests that the acoustic energy calculated from data collected under damage conditions are less frequency dependent than in the blockage condition case. The recorded acoustic impulse response is sensitive to the sensor position and this effect needs to be taken into account computationally or through improving the procedure for these experiments.
Footnotes
Acknowledgements
The author was very grateful to Professor K.V.H. from The University of Sheffield (UK) for constructing the experimental facility in the Hydraulics Laboratory at the University of Bradford (UK) and his supervision on this work.
Handling Editor: Pietro Scandura
Declaration of conflicting interests
The author(s) declared no potential conflicts of interest with respect to the research, authorship and/or publication of this article.
Funding
The author(s) disclosed receipt of the following financial support for the research, authorship and/or publication of this article: This research is supported by the National Natural Science Foundation of China (No. 61563024 and No. 61663017).