
Abstract
Having great impacts on machining precision, thermal error is one of the main error sources for heavy-duty computer numerical control machine tools. Thermal error compensation using prediction models with temperature field is an effective way to improve machining precision of computer numerical control machine tools. The accuracy and robustness of thermal error prediction models depend considerably on the selection of temperature measurement points. Too many temperature measurement points will increase the complexity of thermal error prediction models and incur over-fitting problems. To improve the complexity and performances of prediction models, a selection method of key temperature measurement points based on density peaks clustering is presented in this article. This method is able to cluster massive temperature measurement points quickly and select the key temperature measurement point which characterizes the common feature of each cluster automatically. It is verified on the ZK5540A heavy-duty computer numerical control gantry drilling machine tool. Six key temperature measurement points are selected from the total 222 temperature measurement points with this method. Then, the back propagation neural network optimized by genetic algorithm thermal error model with the six key temperature measurement points is built and the accuracy and robustness of the model are analyzed. The results show that the model has high prediction accuracy and strong robustness.
Keywords
Introduction
Machining precision is one of the most critical performances for computer numerical control (CNC) machine tools. 1 There are different types of errors which have negative impacts on the machining precision of CNC machine tools, such as geometrical error, kinematic error, and thermal error.2–4 Thermal error has accounted for 40%–70% of these errors.5, 6 The internal and external heat sources of a machine tool cause the change of its temperature field and then incur its thermal deformation and a relative displacement of its cutting tool, namely, thermal error.7, 8 Thermal error compensation with thermal error prediction models is a valid way to improve the precision of CNC machine tools.9–11
The data-driven modeling method is usually used to build a thermal error prediction model with the monitoring data of the temperature field of a CNC machine tool. The compensating result, to a great extent, relies on the accuracy of the prediction model. The thermal error prediction model is actually a fitting function between temperature measurement points (TMPs) and the thermal error, of which TMPs are input variables and the thermal error is permissible output. 12 The more accurately the temperature field of the CNC machine tool is measured via TMPs, the more precisely the thermal error is predicted. To monitor the temperature field of a CNC machine tool, a plenty of temperature sensors are mounted on it. Although massive TMPs distributed on CNC machine tools can provide comparatively comprehensive temperature field information for thermal error prediction models, over-fitting problems may occur because plethoric TMPs make the prediction models complex. 13 To overcome this problem, the key TMPs which can characterize the temperature field variation should be selected from all TMPs.14–17 And, thermal error prediction models are built based on these key TMPs.
In recent years, the selection of TMPs has been paid attention to by the academic and industrial fields. Fuzzy C-means clustering method and fuzzy iterative self-organizing data analysis techniques algorithm are used to select key TMPs of a CNC machine tool. 15 Fuzzy clustering theory is employed to select TMPs of a coordinate boring machine and a CNC boring and milling center. 18 Grey system theory is applied to reduce TMPs of a CNC turning center from 16 points to 4 points. 16 A combination of Grey correlation and Kohonen network is presented to select the TMPs of a CNC gear grinding machine. 19 Grey correlation analysis method is utilized to select the key TMPs to build the thermal error prediction model for the spindle of a machining center. 20 A comprehensive analysis method combining fuzzy clustering, Grey correlation and stepwise regression determination coefficient is proposed to select TMPs of a CNC machining center. 14 R pattern clustering based on stepwise regression analysis is employed to filter TMPs of the servo system. 21 The partial correlation analysis is used to select key TMPs of a CNC machine tool. 22 All results of these methods are useful to build thermal error prediction models. However, most of them are used for small or medium machine tools with linear correlation analysis. The total number of TMPs mounted on these machine tools is usually less than 50. Compared with small or medium machine tools, heavy-duty CNC machine tools need a great number of TMPs to monitor their temperature field because of their huger size, larger surface, longer travel, heavier workload, and more complex heat sources. For the above-mentioned methods, it is difficult to determine the number of clusters artificially and it will cost plenty of time to calculate when the key TMPs of heavy-duty CNC machine tools are selected from plenty of TMPs. Furthermore, high linear correlation key TMPs selected by these methods may lose partial temperature field information which perhaps influences the thermal error prediction of heavy-duty CNC machine tools. Hence, these methods cannot resolve the selection of key TMPs of heavy-duty CNC machine tools effectively.
In the rest of sections, a selection method of key TMPs based on density peaks clustering for heavy-duty CNC machine tools is presented first. Then, this method is used to select the key TMPs of the ZK5540A gantry drilling machine tool. Finally, to verify the effectiveness of this selection method, thermal error prediction models based on back propagation neural network optimized by genetic algorithm (GA-BP) are built and analyzed. The results show the model has high prediction accuracy and strong robustness with the six key TMPs selected by the method.
The method of TMPs selection
Density peaks clustering, which was proposed by Rodriguez and Laio 23 in 2014, is a method used to classify elements by their mutual distances. 24 Density peaks clustering has advantages for classifying massive elements because it does not need complex iteration and gradient calculation like other clustering methods, such as k-means clustering, fuzzy clustering, and Grey clustering. What is more, density peaks clustering is insensitive to the number and centers of clusters, so the cluster centers need not to be determined before classifying. It is an effective method to select key TMPs for a heavy-duty CNC machine tool which needs a large number of TMPs to monitor its temperature field. Because distances between TMPs are the basis of density peaks clustering, exact mutual distance of TMPs need be calculated before clustering. Due to time lags of heat conduction, temperature variations of different TMPs are non-synchronous, but they have similar variation tendencies. It means temperature variables from different TMPs have similar shapes with different phases. Frequently used distance measures, like Euclidean distance, cannot characterize exactly the similarity of two TMPs, because they calculated the distance based on “point to point” at the same time rigidly. Dynamic time warping (DTW), which was proposed by Itakura in 1975, is a better way to calculate the distance between two TMPs by realigning their data sequences in light of “feature to feature.” In other words, DTW recognizes the similarity of two TMPs even if feature points of their data sequences do not align strictly on the time axis. In this section, distances between each two TMPs are computed by DTW, and all TMPs are clustered by density peaks clustering based on their DTW distances.
DTW method
DTW is a typical optimization algorithm to compare similarities of two data sequences via calculating cumulative distances between similar feature points.25, 26 It has earned its popularity by being extremely efficient as the data sequences similarity measure. DTW minimizes the effects of shifting and distortion in time by allowing “elastic” transformation of data sequences in order to detect similar shapes with different phases. For example, A and B are two similar temperature variables from two TMPs in Figure 1, but there is a slight deviation of their shapes. In Figure 1(a), it is obvious that the feature of point a and point c is more similar than the feature of point a and point b. As a result, traditional methods based on “point to point,” like Euclidean distance, cannot calculate the distance between A and B very well. While DTW is able to get the exact distance by warping and aligning data sequences based on “feature to feature” as shown in Figure 1(b).

The distance between two TMPs: (a) point to point and (b) feature to feature.
Suppose A and B have the same length n


To align A and B by “feature to feature,” a

Each element of D stands for the alignment between


There are three constraints, including boundary, continuity, and monotonicity, for finding the warping path P:
Boundary: the warping path P should start from a corner of matrix D and end at the opposite corner, namely,
Continuity: the warping path P must be continuous. If there is
Monotonicity: elements in P need be monotonic. If there is
There are many selections of warping path P under its definition and the above constraints. Cumulative distance

In equation (6),
Density peaks clustering method
Density peaks clustering method provides an efficient and succinct solution of classification by fast searching and finding of density peaks. Based on distances between elements and densities of them, density peaks clustering gets the proper number of clusters fast. Cluster centers, which are able to characterize common features of all members in the same clusters, are elements with local maxima in the density.
Density peaks clustering is achieved on two assumptions that the central element of a cluster has a higher density than elements surrounding it and has a relatively large distance from central elements of other clusters. To cluster elements using density peaks clustering, the local density

in which

In equation (7),

where

According to equations (9) and (10), if TMP
After
Moreover, cluster core and cluster halo are defined in light of density to recognize noise in clusters. If the distance between a TMP and the center in a cluster is larger than
Finally, TMPs which belong to cluster halo are excluded and TMPs which are cluster centers are selected as key TMPs.
A case study
Measurement of temperature field and thermal error
The selection method mentioned above is used on the ZK5540A heavy-duty CNC gantry drilling machine tool (see Figure 2). This heavy-duty gantry drilling machine tool mainly consists of spindle, beam, two columns, and two guide rails.

The ZK5540A heavy-duty CNC gantry drilling machine tool.
In order to monitor the temperature field of ZK5540A, fiber Bragg grating (FBG) temperature sensors are applied because of their tiny size, lightweight, and anti-electromagnetic interference (see Figure 2). A total of 222 FBG temperature sensors are mounted on spindle, beam, columns, and guide rails of ZK5540A to measure the temperature field (see Figure 3). There are 90 and 24 FBG temperature sensors on the spindle ram and spindle bottom, respectively; 20 FBG temperature sensors on the front and back of the beam; 48 FBG temperature sensors on two columns; and 40 FBG temperature sensors on the left and right guide rail. The deployment of FBG temperature sensors is shown in Table 1.
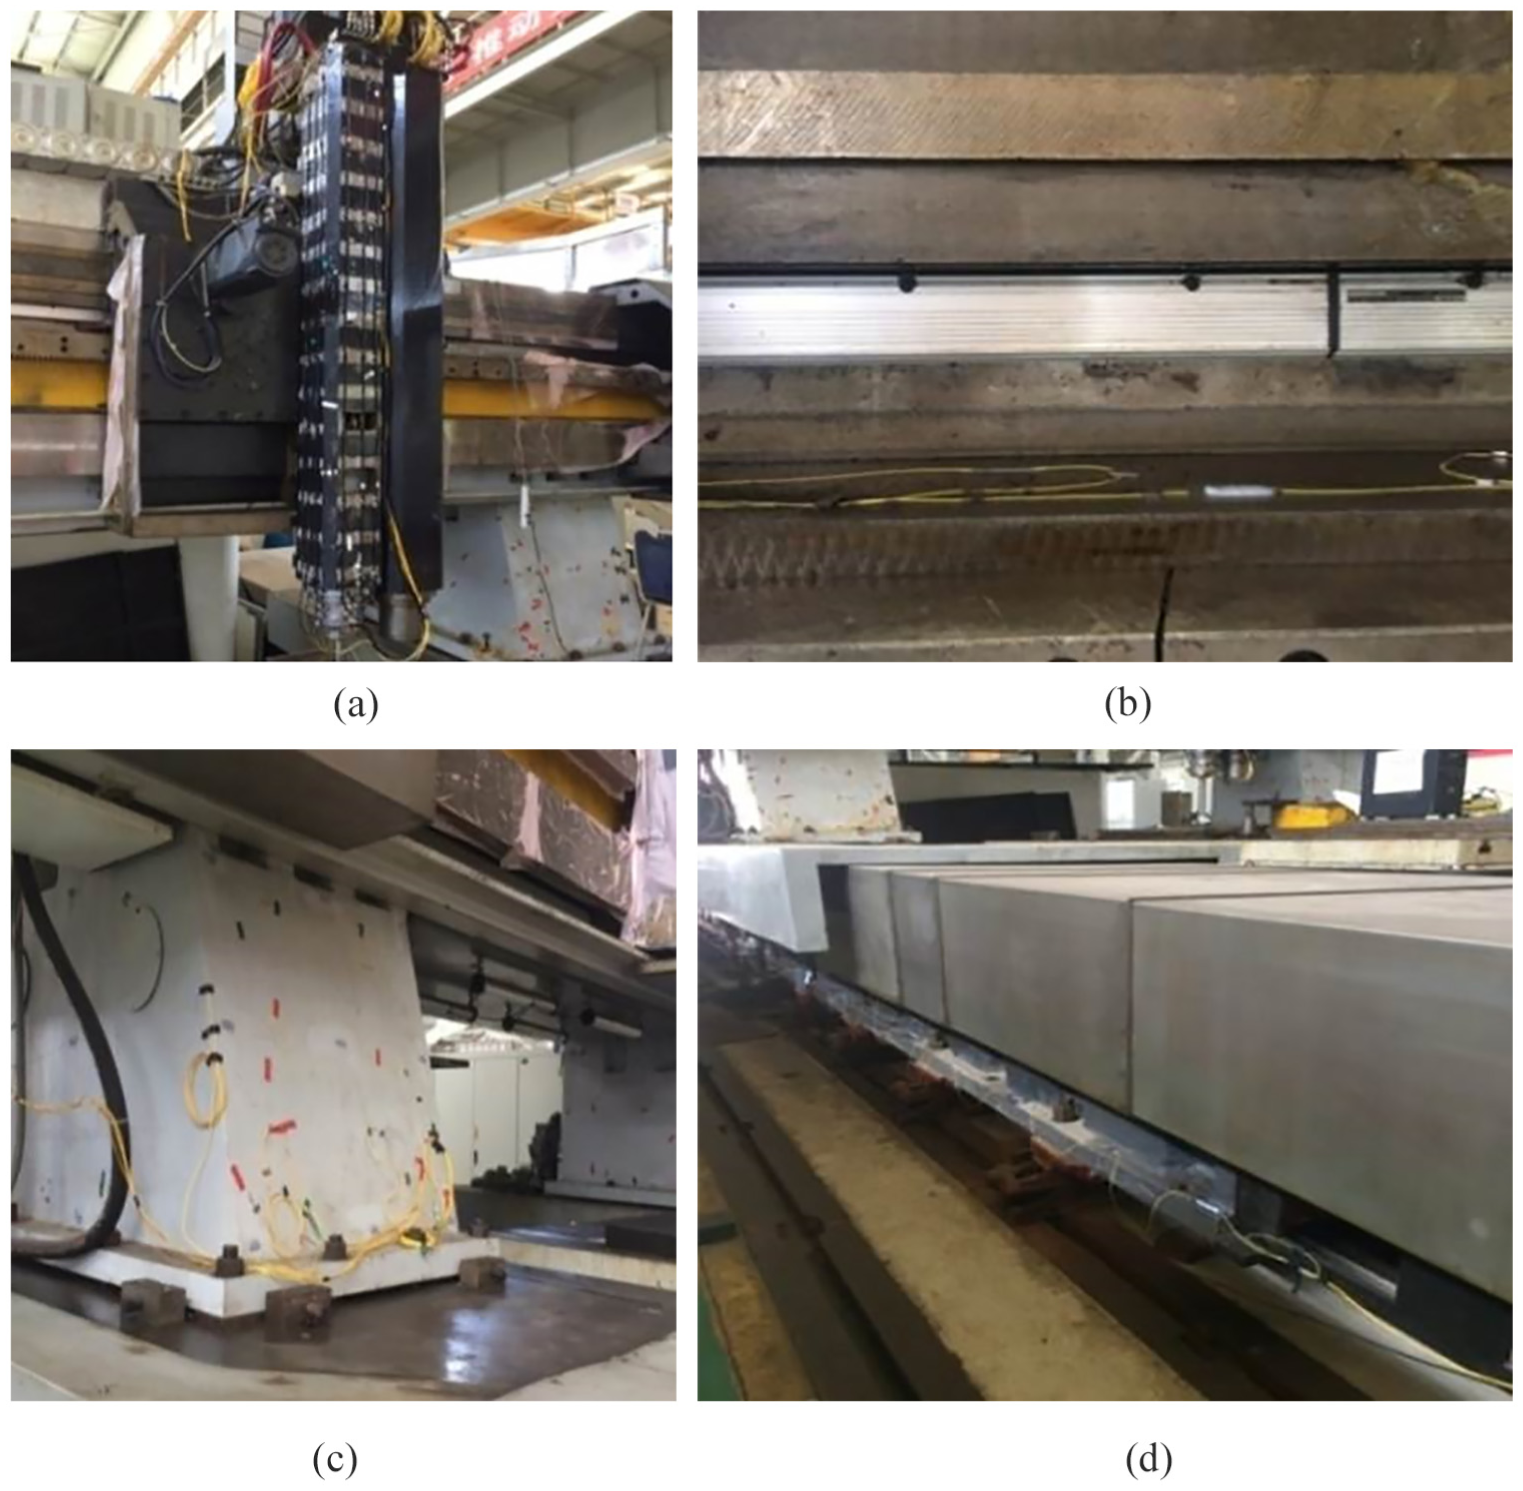
The mounting of FBG temperature sensors: (a) spindle, (b) beam, (c) column, and (d) guide rail.
The deployment of FBG temperature sensors.
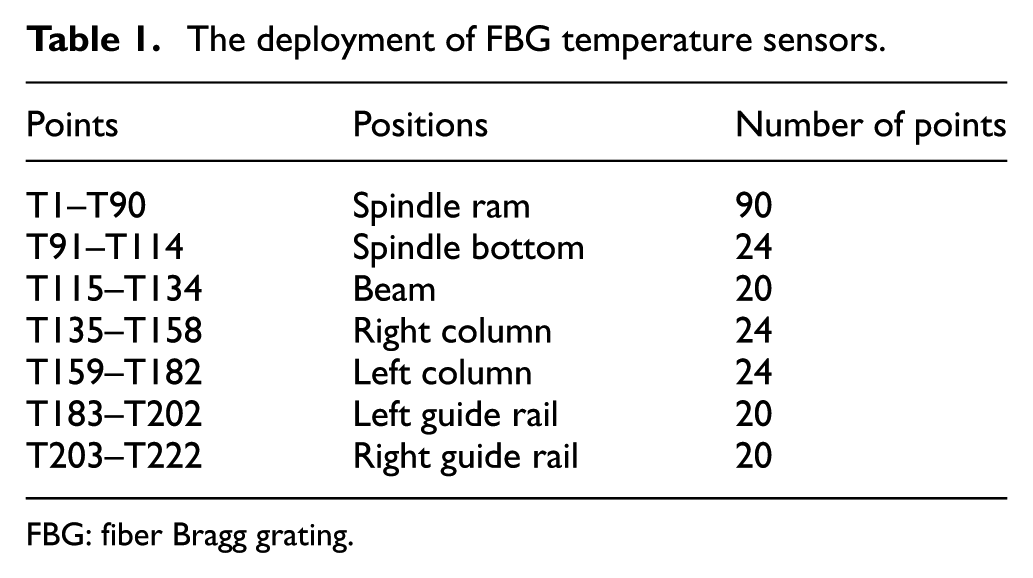
FBG: fiber Bragg grating.
To measure the thermal error of ZK5540A in three different directions (X, Y, and Z directions), its cutting tool is replaced by a test bar. A charge-coupled device (CCD) laser displacement measurement system is used to measure the displacements of the three directions because of the changes of the temperature field of the machine tool (see Figure 4).

The measurement of thermal error.
A data acquisition system is developed for collecting the data every minute from FBG temperature sensors and the CCD laser displacement measurement system on the ZK5540A.
Selection of key TMPs
Temperature field data and thermal error data of ZK5540A are collected under air cutting conduction. Figure 5(a) and (b) shows thermal error variation of ZK5540A and the temperature variation of eight TMPs selected randomly from different components in 72 h in spring. During these 72 h, that is, 3 days, the spindle of ZK5540A keeps running at 500 r/min for 8 h in the daytime every day, but no workpiece is really cut. Meanwhile, the coolant flows. In the rest hours, the machine tool keeps static. This group of data in these 3 days is used as sample data for key TMPs selection. It can be seen from Figure 5 that thermal error and temperature of ZK5540A have similar variation trends. Because of nonlinear relationship between them, their variation trends are not completely same. What is more, temperature variations in these 3 days are also not same due to different ambient temperatures. Compared with the thermal error in other two directions, the thermal error in the Z direction is the most distinct, so it is researched in this article.
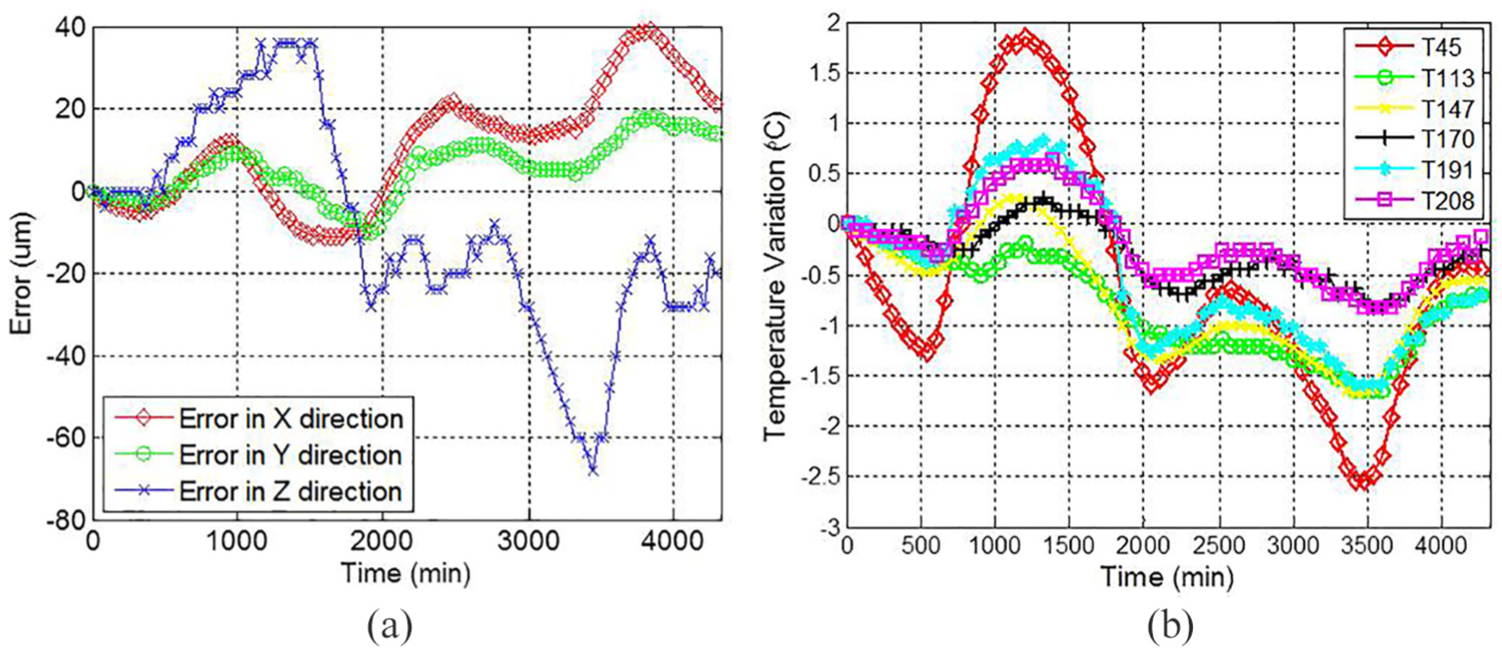
The data variation in 72 h: (a) thermal error variation and (b) temperature variation.
Based on DTW and density peaks clustering method, key TMPs are selected by following the steps below:
Distances between each two TMPs are calculated based on DTW. At first, DTW distance

where
The cut-off distance
The local density
The relative distance
Cluster centers are selected. Based on the local density
The rest of TMPs are assigned to six cluster centers. Distances between each TMP and six center TMPs are compared and the shortest distance is found. This TMP is assigned to the cluster center which has the shortest distance with it.
Halo and core of each cluster are recognized based on the cut-off distance

The decision graph of density peaks clustering.
222 TMPs are classified into six clusters and the center points of six clusters are selected as key TMPs. The result is shown in Table 2, and the temperature variation of these six TMPs is shown in Figure 7.
The result of selection.


The temperature variation of six key TMPs.
The key TMPs testing
To verify the validity of the key TMPs selection method presented by this work, thermal error prediction models are built and their performances are analyzed. In recent years, many error prediction models for machine tools have been proposed by scholars, like multiple linear regression (MLR) model and neural network model.27, 28 Although MLR is easy and calculation workload is low, it lacks autonomous learning ability and error feedback mechanism. Error prediction accuracy and robustness could not be guaranteed very well when MLR is used. Neural network is one of the most useful methods for mapping the relationships between multivariable inputs and outputs. What is more, it has good performance on fitting nonlinear functions. The relationship between temperature and thermal error of machine tools is nonlinear. 29 Hence, GA-BP, which is a kind of commonly used neural network model, is used to predict the thermal error of ZK5540A here.
Accuracy analysis
Three groups (Group I, Group II, and Group III) of TMPs are used to build GA-BP thermal error prediction models. Group I is made up of six key TMPs selected above and Group II is made up of other six TMPs (T187, T188, T189, T190, T199, and T207) which have high Pearson correlation coefficient with thermal error in the Z direction. Pearson correlation coefficient is always used as the criterion to finally determine key TMPs after all TMPs are clustered into different groups, and therefore, it is deployed to select a group of key TMPs for comparison. Pearson correlation coefficient between each TMP and the thermal error is defined as

where
For these three groups, data in the first 48 h is used to train models, and the rest is used to verify prediction results. Figure 8 shows prediction results of these three models and performances of residual errors are listed in Table 3. The extremum, absolute mean, and standard deviation of Group I are all less than those of Group II and Group III. It illustrates that thermal error prediction model using the six key TMPs selected by density peaks clustering has higher prediction accuracy than those using other key TMPs selected by correlation coefficient and fuzzy C-means clustering.

Thermal error prediction results of Groups I, II, and III: (a) model based on the Group I, (b) model based on the Group II, and (c) model based on the Group III.
Performances of residual errors.

Robustness analysis
As a matter of experience, accuracy of thermal error prediction models will change in different seasons due to ambient temperature if the robustness of them is low. Hence, the GA-BP thermal error prediction model which is built based on the six key TMPs in the previous section is utilized to predict thermal error in the Z direction of 24 h in summer and other 24 h in autumn, respectively, to verify its robustness. The thermal error variation in the X, Y, and Z direction and the temperature variation of six key TMPs in these two 24 h are shown in Figure 9.

The data variation in 24 h in different seasons: (a) thermal error variation in summer, (b) temperature variation in summer, (c) thermal error variation in autumn, and (d) temperature variation in autumn.
Figure 10 shows thermal error prediction results in the Z direction. The extremum, absolute mean, and standard deviation of the residual errors are 2.86, 0.04, and 1.86 µm and 6.10, 0.24, and 1.78 µm. Results indicate that the GA-BP thermal error prediction model still has high prediction accuracy in the different seasons. Hence, the proposed key TMPs selection method in this working could guarantee robustness of the thermal error prediction model.

Thermal error prediction results in different seasons: (a) prediction result in summer and (b) prediction result in autumn.
Conclusion
In this article, a selection method of key TMPs for heavy-duty CNC machine tools is presented. The method combines density peaks clustering with DTW. Distances between each two TMPs are calculated via DTW. Then, all TMPs are clustered by density peaks clustering and the central point of each cluster is searched with DTW distances. Cluster centers are selected as the key TMPs. In addition, this method is applied on the ZK5540A heavy-duty CNC gantry drilling machine tool, and the six key TMPs are selected from total 222 TMPs. At last, GA-BP thermal error prediction models are established to verify the feasibility of the selection method, and the accuracy and robustness of models are analyzed. The results show the model built with the six key TMPs has high prediction accuracy and strong robustness.
Footnotes
Handling Editor: Jixiang Yang
Declaration of conflicting interests
The author(s) declared no potential conflicts of interest with respect to the research, authorship, and/or publication of this article.
Funding
The author(s) disclosed receipt of the following financial support for the research, authorship, and/or publication of this article: This work was supported by the National Natural Science Foundation Committee (NSFC) of China (grant nos 51475347 and 51475343) and International Science & Technology Cooperation Program of China (grant no. 2015DFA70340), as well as the contributions from all collaborators within the projects mentioned.