
Abstract
The mechanical reliability problem of passenger car cockpit facilities layout is increasingly complex and has potential and uncertain risks for human safety while the number of private cars is increasing. A new system of layout design optimization is proposed to solve this problem. First, the optimization sequences of facilities are determined using a hybrid method of multiple-attribute decision-making and entropy. Second, the degree of feeling crowded in the cockpit layout can be adjusted based on customers’ preference. Third, an adapted particle swarm optimization algorithm is proposed to solve the problem of three-dimensional layout optimization in car cockpit human–machine interface according to the ergonomic principles, and the adapted algorithm called smoothing iteration particle swarm optimization is contrasted with those of other common algorithms to demonstrate its advantages. Finally, the optimized layout is analyzed by virtual simulations and compared with the original layout to show the feasibility and effectiveness of the proposed design system. Analysis results indicate that the optimized layout by the new particle swarm optimization can make the operation easier and safer than the original one to enhance ergonomic reliability.
Keywords
Introduction
With the development of the passenger car in science and technology, more and more new facilities with new functions are needed to be integrated into car cockpit according to the diversification of user demands; thus, there are more stringent requirements on ergonomic safety of passenger car cockpit due to the developing technical and environmental complexity. The conception of the passenger cars considered in this article is based on the definition of GB/T3730.1-2001. 1 Passenger cars take various forms, such as saloons, convertible saloons, Pullman saloons, coupes, convertibles, and hatchbacks. Therefore, more attention should be paid to the problems in terms of mechanical ergonomic reliability of the passenger car cockpit layout which could be adjusted according to the different groups of population. Nowadays, the ergonomic reliability of passenger car cockpit human–machine interface layout is mainly based on the modification evaluations and conclusions on the experience of experts and designers, but this is not a quick method to solve this problem. So, a scientific method for optimizing the layout of passenger car cockpit human–machine interface to improve ergonomic reliability is urgently needed. Nowadays, there have been a number of studies on the evaluation methods for cockpit layouts,2,3 but these have been relatively less studies considering cockpit layout optimization. In recent years, the cockpit layout optimization problem has received increasing attention. 4 However, only ergonomic theory was applied to the cockpit layout optimization, and most of the related research neglects drivers’ affective factors. In addition, most research subjects are non-standard cockpits, such as those of aircraft and submersibles. There are only few effective methods for solving the layout optimization problem of passenger car cockpit. Thus, a design optimization system for the passenger car cockpit layouts to improve ergonomic reliability is clearly needed.
A growing number of subjective methodologies are used to evaluate the reliability and safety of the system.5–8 Multiple-attribute decision-making (MADM) is always used together with entropy to determine the attribute weights. 9 The concept of entropy is extensively used as a quantitative measure of uncertainty associated with a random variable. 10 Entropy can improve the problem of too much subjective influence to weight the assessment effectively in the evaluation system. 11
In recent years, there is some research about different cabin or cockpit layout optimization using artificial intelligence algorithm. The three most common computational intelligence algorithms to solve the problem of this layout optimization are genetic algorithm (GA), ant colony algorithm (ACA), and particle swarm optimization (PSO) algorithm. 12 In 2002, a compartment layout algorithm was proposed based on GA in order to solve the problem of the space layout design in a naval ship. 13 In 2013, a GA was successfully used to solve the layout optimization problem in civil aircraft cockpit. 14 In 2015, GA and ACA were applied to the human–machine interaction interface layout design of drilling rig control room. 15 In addition, in 2007, PSO was proposed for determining the optimal layout of the multi-level warehouse. 16 PSO can also show good performance in solving the problem of layout optimization effectively and efficiently. In 2011, PSO was proposed to solve the facility layout problem with unequal area departments successfully and it was used in relaxed flexible bay structure. 17 In 2017, it was confirmed that the modifications and extensions of PSO could contribute to optimization methods in construction site facility layout problem; 18 therefore, PSO is known to be effectively used in complex engineering layout problem solutions. Although the PSO algorithm has been applied to solve different engineering problems and different industrial fields successfully, there have been comparatively few applications in terms of cockpit or cabin layout design. In 2016, PSO with adaptive weight was applied to solve the problem of constrained two-dimensional layout optimization in satellite cabins. 19 However, the PSO is rarely used to solve three-dimensional cockpit layout optimization problems, especially car cockpit.
The remaining part of this article is organized as follows. In section “Layout design optimization system,” the method of layout design optimization system for passenger cars’ cockpit to improve the ergonomic reliability is proposed. We create a process flowchart to describe how to establish the system first, and then explain the process of determining the attribute weights of facilities in the passenger car cockpit and the optimization importance sequences using MADM and entropy method (MADM-entropy). Next, we describe the principle of the new adapted PSO algorithm with smoothing iteration and analyze its superiority to optimize the layout according to ergonomic reliability theories. In section “Application and examples,” the proposed design optimization system is applied to the passenger car cockpit layout determined by middle-aged and older people describing the implementation of the algorithm. In section “Ergonomic reliability and safety evaluation of the layout optimization by virtual simulation,” the results of virtual simulations are presented to compare the original passenger car cockpit layout with that given by the design optimization system. The feasibility and effectiveness of the proposed technique are demonstrated based on the simulations. In section “Conclusion,” we show the conclusions of this article.
Layout design optimization system
Figure 1 shows the workflow of the design optimization system. The facilities ranking in the order of importance is based on the MADM-entropy analyses. The preference of experts and drivers can determine the degree of crowded car interface. To enhance the ergonomic reliability of the layout design system, the system design solutions must satisfy the interactions between different disciplines. The objection function determining the facilities’ positions is established with the ergonomic constrains based on the users’ preference and ergonomic principles. The most optimized plan is proposed based on the smoothing iteration PSO analyses.

Flowchart of the layout design optimization system.
To make the layout optimization well organized, the cockpit facilities should be classified by experts and customers according to their rich operational experiences. The target level, criteria level, and bottom criteria level were built depending on the classification of cockpit facilities as shown in Table 1.
Selected criteria for layout optimization of passenger car cockpit human–machine interface.

Cockpit facilities optimization sequences and weights determined by MADM-entropy
Because there are so many facilities, not everyone can be arranged in the most proper position. The optimization sequences are determined by the importance of different facilities attributed by different customers, which means the optimization sequences may be different according to different user demands. In terms of facilities’ criteria weights, MADM is used to obtain the subjective weights, meanwhile the entropy method is used to obtain objective weights, and then the subjective and objective weights complement and revise each other by linear algorithm to gain the final weights representing the facilities’ importance which determines the facilities’ optimization sequences. The experts and customers give the scores based on the importance of facilities to build the decision matrix

where σ is the standard deviation and a is the score given by users.
Some scores given by a user have a wide range of difference, which means the user has very different attitudes toward the facilities which will have a greater influence on the final weights and the optimization sequences. Every user gives scores according to different facilities’ importance. The optimal weight vector


where Vj(

which means

Formula (5) is transformed to Lagrange function

The partial derivative is worked out

The optimal solution is

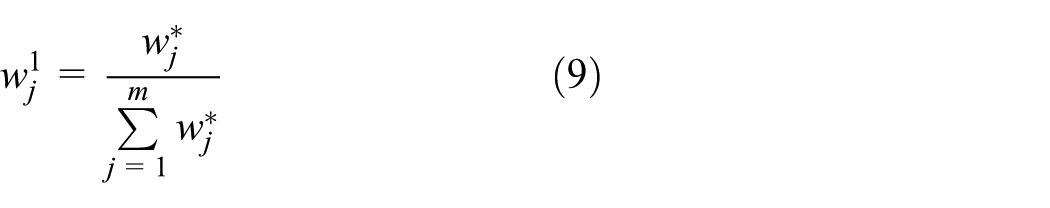
The feature weight of the jth index analyzing ith facility is

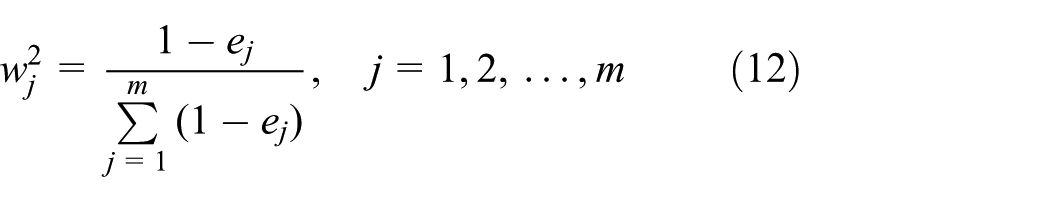
The entropy of the jth index is

The weight of each index is
The importance weight of the facilities is
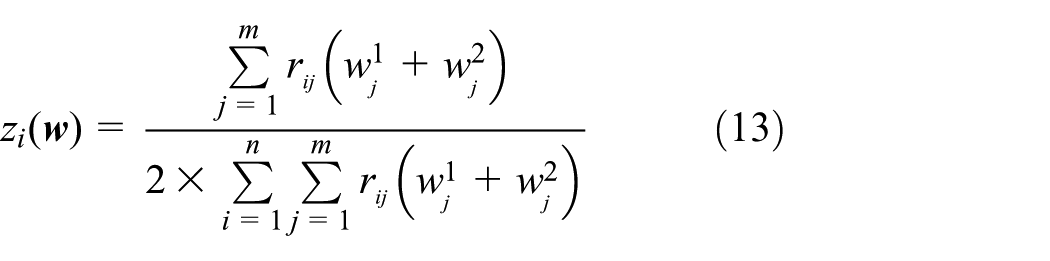
The facility optimization sequences can be confirmed by zi(
Human–machine interface layout optimized by the adapted PSO with smoothing iteration
There have been some PSO variants solving the interface layout optimization problems, such as linear decreasing weight PSO and inertia-adaptive PSO. The method of linear decreasing weight was introduced to improve the performance of classic PSO with an initial value and an adjusted final value. The effective outcome can be presented if the parameters are set properly. However, the problem of premature convergence occurs when linear decreasing weight PSO is used to solve complex optimization problems such as multi-peak function. The reason for early convergence is the lack of enough momentum for particles to do exploitation when the algorithm approaches its terminal point. 20 The inertia-adaptive PSO with the adjusted maximum and minimum values of inertia factor has the feature of rapid convergence in the first 1000 iterations, but a slightly worse result is obtained for complex highly nonlinear function, especially Sphere and Ackley’s functions for premature convergence. 21 So, the adapted PSO with smoothing iteration is proposed to avoid the problem of being trapped in local optimum.
Theory of the adapted PSO solution algorithm
Considering m particles consist of d decision variables, the current position of particle i in the solution space is represented by a vector
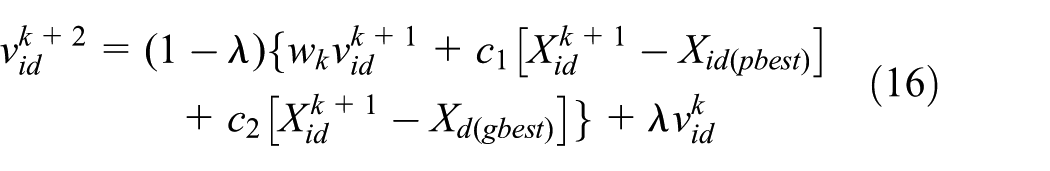
The adapted PSO called smoothing iteration PSO is provided mainly to improve stability, convergence, and efficiency problems. The traditional PSO is just adjusted according to inertial velocity, personal best value, and global best value of the particle itself, but its previous inertial velocity is ignored. Based on the adapted algorithm, the inertial velocity is added and the velocity vector of the particle is updated as follows

The ith particle’s next position vector is

Then

where

where itermax is the maximum iteration number and
Contrasted with the traditional PSO algorithm, the adapted algorithm is added, and it is very different from the traditional one. The velocity update equation of traditional PSO is the first difference equation. The improved equation is the kth-order difference equation. The addition of another velocity element means that the method of (k + 2)th updating velocity of the particle is not only based on the inertial velocity which is the kth newest updating velocity, the global best position, and the personal best position, but also based on the previous inertial velocity which is the kth updating velocity. According to the mathematical representation, the change of fitness function is smoother and the convergence speed is faster than the traditional way in theory. In addition, the value of λ is bigger, and the convergence speed is faster. To make the algorithm much more stable, the method is applied in such a way that the change of inertia factor is smaller and smaller according to the change of iteration times. The weight is smoothed by the low-pass filter during iteration process. To a certain extent, the trajectory of particles is generated smoothly to eliminate the non-convergence to prevent being trapped around local optima.
Establishment of the objective function
The relative positions of cockpit facilities are very complex, and several factors must be considered to build the objective function, the linear weighted sum method is very proper to be applied, so that the function can be written as
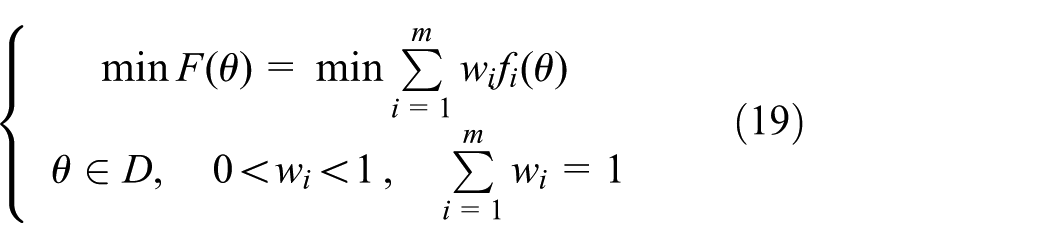
where
Constraints of layout design optimization according to four ergonomic principles
The origin of the coordinates in the proposed framework is at the middle of the driver’s eyes. Actually, according to the standard of the Society of Automotive Engineers, the path of the driver adjusting the driving seat to comfortable position is elliptical, which means the distribution of drivers’ eye positions will form an ellipse when they are relaxing. Hence, to calculate conveniently, the driver has the seat fixed at the center of its adjustable range.
Principle 1: constraints of human eyes field of view
The eyes field of view is formed by two light rays reflected from the two end points of the facility to the eyeballs. The size of this field of view is determined by the distance from the eyeball to the facility and the distance between the two end points of the facility. The angle of view can be calculated as follows
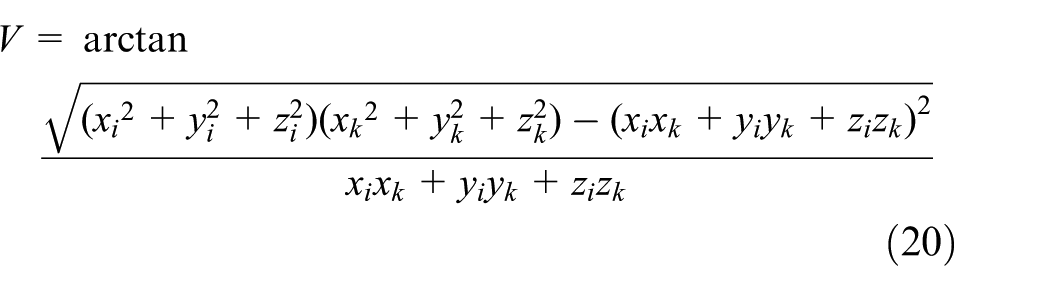
where V represents the angle of view from facility i to facility j.
Principle 2: constraints of hands reachable zones
Most cockpit facilities must be reachable for drivers to ensure driving safety, so the model should make facilities reachable by the driver’s hands. The reachable zones of hands are shown in equations (21) and (22)

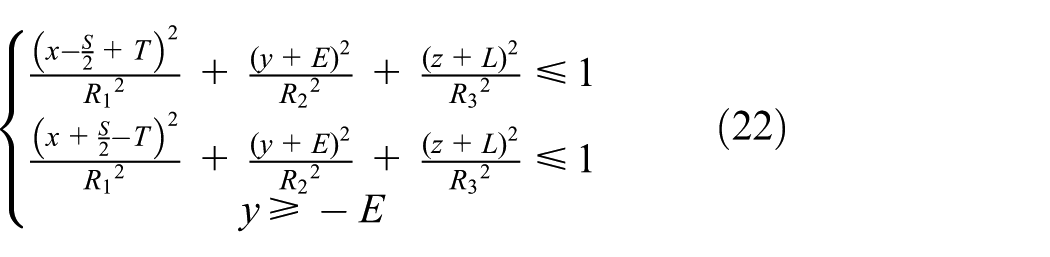
In equations (21) and (22), the origin of the coordinate scheme is the center of the driver’s eyes. S denotes the shoulder width; E is the horizontal distance from the eye to the shoulder along the y-axis; L is the vertical distance from the eye to the shoulder; T is the distance from the outside of the shoulder to the articulatio humeri; r is the radius of the circle formed by human arm’s normal attainable region; and R1, R2, and R3 are the axis lengths of the ellipsoid formed by the human arm’s maximum attainable region in the x-, y-, and z-axis, respectively.
Principle 3: constraints of the facilities with no overlapping of each other
The distance between two central points on two different facilities should be greater than or equal to the half of the sum of lengths, widths, and heights of the two facilities, respectively. Two facilities will have non-interference within each other’s boundary
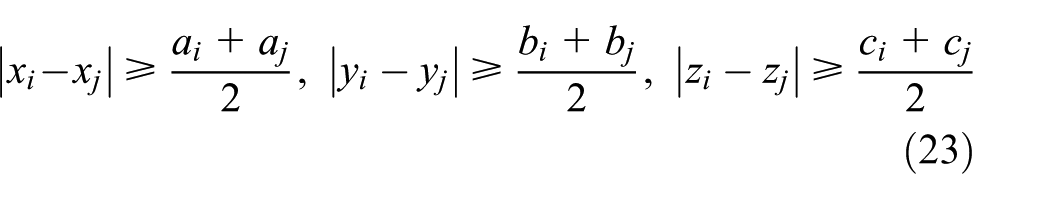
In equation (23),
Principle 4: the inertial force constraints of human in the car
Based on the theory of multi-body dynamics, the inertial force of the human arm is analyzed. By deriving the equation of motion from the Newton–Euler method, all arm bar members in terms of force and momentum balance need to be considered, but the method is simpler and more efficient than others. The computational complexity is proportional to the number of degrees of freedom on the human arm. There are 7 degrees of freedom simplified on the human arm as shown in Figure 2. The human arm moves from point i to point j. The reference frame of

where
in which
Because


Coordination distribution of human arm.
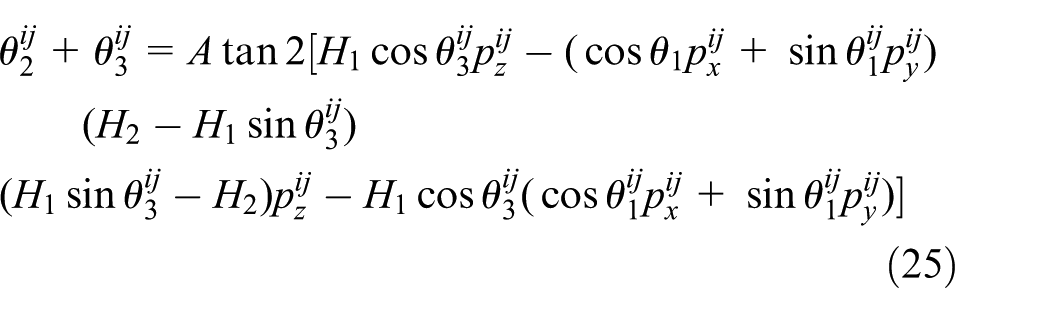
Because the part containing

From formulas (24) and (25), H1 is the length of the upper arm and H2 is the length of the lower arm. According to formulas (24) and (25),
Degree of feeling crowded in cockpit controlled by customers
Researchers can obtain the relationship between the design variables and users’ prediction based on the survey data.26–30 The wide or small space between different cockpit facilities can make driver feel loose or crowded. Human’s mind image of an object spanned between two antonyms could be used to indicate where an opinion would be in the continuum or scale. 31 Therefore, the semantic differential (SD) scale as a linguistic tool is used in our research to measure and record user-centered attitudes toward the degrees of feeling from wide to crowded in the car cockpits. 32 The SD scale is shown in Figure 3. The semantic space is divided into at least three parts ordinarily. To show the human’s feeling of more delicacy and to get better statistical results effectively, the scale divided into eight equal parts is proper due to people spending less time with eight parts than with more partitions obviously, and the scale with symmetric divisions is easier to be understood and used by the people surveyed. The relationship between crowdedness emotions and the SD scale values recorded by customers can then be analyzed by least-squares multiple regression.

Semantic differential scale.
Application and examples
Taking the cockpit layout optimization of the passenger car designed for middle-aged and older people as an example, 25 middle-aged and older people who are from 50 to 70 years of age as shown in Table 2 are invited to give scores for the facilities of cockpit layout. According to function (1), the scores are normalized, and the scores less than 60 points are taken as 0 value. When the scores are greater than or equal to 60, because σ = 9.1602, the normalized figures are between 0 and 1. The normalized making matrix is shown in Table 3.
Information of the middle-aged and older people surveyed.

Normalized making matrix obtained by scores for the facilities of cockpit layout.

Based on the normalized making matrix and MADM-entropy theories, and according to formulas (8) and (9), the optimal subjective weight
The attitudes of customers about the crowdedness in car cockpit were sensitive, so more surveys were organized. A total of 160 questionnaires were sent and collected; of which, 102 effective questionnaires were considered to be usable. According to least-squares multiple regression, the relationship between the degrees recorded by SD scales and crowdedness attitudes of customers can then be analyzed to be

In Table 4 and equation (26), the dependent variable S is the SD scale value given by the experts and customers, and the dependent variable A is the ratio between the customer’s desired distance and the minimum distance among the facilities in the cockpit. The number of observations was 102, F(3, 98) = 70.11, probability > F = 0.0000, and R2 = 0.6821. According to these statistical analyses, the results are ideal.
Least-squares multiple regression results.

p ≤ 0.1; **p ≤ 0.01; ***p ≤ 0.005.
There is the best distance among two different cockpit facilities in ergonomic principles, but not every distance between two facilities can be designed to the optimal positions actually, so some facilities have to be adjusted to make overall layout the most reasonable. The facilities arranged early will determine the positions of those arranged later. In order to simplify the layout optimization problem, the linear scalarization method is applied to convert multi-objective optimization problems into single-objective optimization problems. According to equations (20) and (23)–(25), the objective function

The constraints for equation (27) are given by equations (22) and (23). In equation (27),
When S = 2.5, A = 1.8763; how to fix the position of air conditioner control panel was taken as an example. The coordinates of the multifunction steering wheel, gearstick, display and control panel, and car seat had been known. The optimal values of the air conditioner control panel could be derived using the layout design optimization system. The coordinates of the multifunction steering wheel’s central point are k = (0, 376.6, –275.7) mm. The coordinates of the gearstick when pushed backward to its end point are j1 = (412.2, 243.7, –593.3) mm; the coordinates of the display and control panel’s central point are j2 = (323.5, 406.6, –335.1) mm; and those of the car seat’s central point are j3 = (0, 65.2, –753.4) mm. Based on the importance sequence of the facilities determined by the customer and 10 experts above 50 years of age, weights can be obtained by MADM and entropy (see Table 5).
Weights obtained by MADM-entropy.

To demonstrate the superiority of the adapted PSO with smoothing iteration, the optimum results given by the classic PSO, linear decreasing weight PSO, inertia-adaptive PSO, GA, and ACA were compared with it. The values of parameter set for those algorithms were as follows: in classic PSO, the initial number of particles was 50, the learning factors were set to 2, and the weight values were set to 0.9. In linear decreasing weight PSO, the initial number of particles was set to 50, the learning factors were set to 2, the initial value of weight was 0.9, and the final value of weight was 0.01. In terms of inertia-adaptive PSO, the linear number of particles was 50, the learning factors were set to 2,
33
and the inertia weights recommended from 1.4 to 0 have good performance; thus, the maximum weight was set to 0.9 and the minimum weight was set to 0.01 to ensure satisfactory solutions. In the adapted PSO with smoothing iteration, the learning factors were set to 2, the maximum weight was set to 0.9, the minimum weight was set to 0.01, and the newest and the next newest velocity weights
Optimal solutions and minimum values of objective function optimized by six different algorithms for the air conditioner control panel.

PSO: particle swarm optimization.

Air conditioner control panel values given by different optimizations.
For another example, the optimal values of customized medicine chest can be found by the design optimization system. The coordinates of the point on the center of the multifunction steering wheel surface are k = (0, 376.6, –275.7) mm. The coordinates of the point on the center of the multimedia display and control panel is j1 = (323.5, 406.6, –335.1) mm and those of the car seat’s central point are j2 = (0, 65.2, –753.4) mm. The central point of the storage box is located at j3 = (393.5, –152.6, –587.2) mm; in this case, the coordinates of the medicine chest can be obtained as (310.3036, –44.99846, –500.3793) mm. In Figure 5, ACA is trapped in local optima, and also, the speed of ACA was the slowest among all the algorithms. In addition, the speed of GA is slower than those of the four PSO algorithms. In Figure 5, the minimum value found by smoothing iteration PSO is slightly smaller than the classic, linear decreasing weight and inertia-adaptive approaches, and the efficiency of smoothing iteration PSO is slightly higher than those of others. Thus, the adapted PSO with smoothing iteration is the best method for solving this problem.
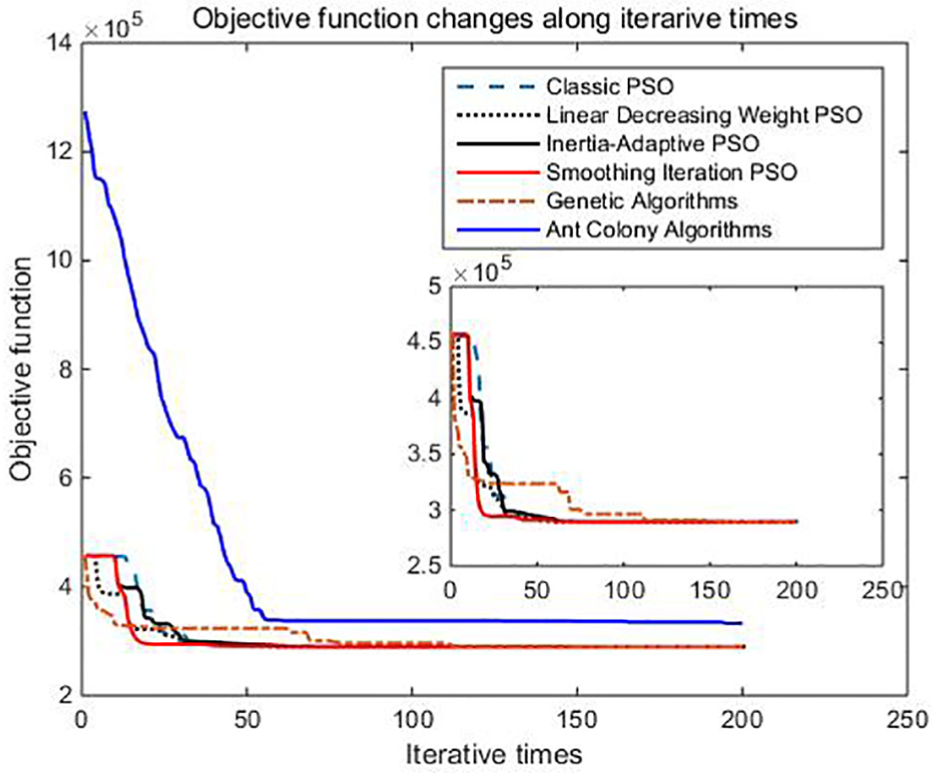
Medicine chest values given by different optimization algorithms.
To show the differences between the 21 optimized positions and the 20 original positions, in Figure 6, the positions of the 21 most important facilities optimized by the design system are represented in red circles and the original positions of the 20 most important facilities are represented in black squares. According to the need of the middle-aged and older people, the medicine chest is added. The positions of ignition switch, air conditioner control panel, and door handle have bigger changers than those of others to match the overall adjustment for enhancing ergonomic reliability.

Original and optimized positions of the most important facilities.
Ergonomic reliability and safety evaluation of the layout optimization by virtual simulation
The process of driving was simulated using the JACK6.1 software. The 1st, 50th, and 99th mass and height percentile ranges of Chinese populations of the same build and stature were built by JACK in addition with the figures of middle-aged and elderly Chinese people who are target customers.
The original layout and the modified layout suggested by smoothing iteration PSO were simulated by JACK according to the advanced scaling of the customers. A fatigue and recovery tool was used to analyze the recovery time that different human models required to finish the same driving process with the two layouts. The driving process was simulated as follows:
Process A. Launch engine → fasten seatbelt → step on the clutch pedal → engage a gear → turn on the left-hand indicator → beep the horn → loosen the handbrake → step on the clutch pedal → change the gear → engage a gear → turn off the indicator → drive for 5 min.
Process B. It is considered as reverse parking and moving from one garage to an adjacent one.
The analysis results are presented in Table 7.
Recovery time analyzed for processes A and B using JACK.
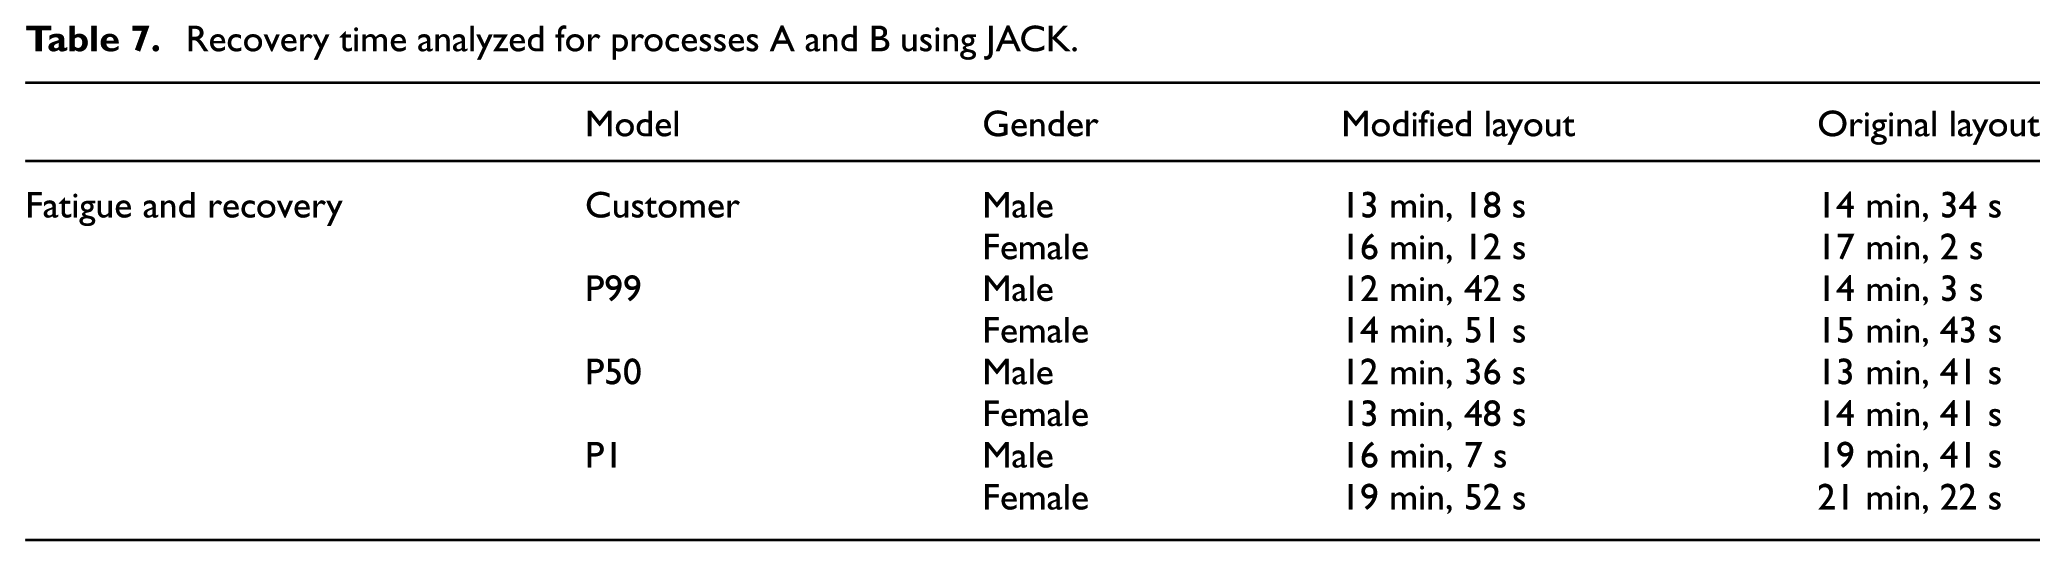
From Table 7, we can see that processes A and B can be performed better with the modified layout than with the original one. The fatigue and recovery time of the modified layout is shorter than that of the original layout, which indicates that the driver is more comfortable and has fewer opportunities under influence of tiredness using the modified layout to achieve greater security during the long-drive process.
Figure 7 shows the optimized layout scheme analyzed by JACK. Human “fifty” represents the 50th mass and height percentiles of Chinese, and the total score of comfort assessment is 4. The higher the score, the more uncomfortable the people feel, so the score of 1 shows the highest comfort. All the results of the 21 most important facilities optimized score 1 which was analyzed by Chinese male and female with the 1st, 50th, and 99th mass and height percentiles in addition with customers, respectively. Because the length of this article is limited, only Figure 7 is shown. In addition, all the car cockpit facilities are in the proper field of view and reachable zones.

Analysis of visual fields, reachable zones, and comfort assessment using JACK.
According to the results of the virtual simulations, the method of layout optimization using the design system is feasible and effective. The ergonomic reliability can be improved meanwhile the customized design of the target customers can be satisfied.
Conclusion
To improve the ergonomic reliability of passenger car cockpit, this article has described a layout design optimization system and takes the design optimization for the middle-aged and elderly people as the example against the background of the growing aging population. It is easier to make mistakes when the old people drive than other ordinary people. Therefore, the ergonomic reliability is especially important to the cars designed for those specific populations.
In the complex layout design optimization process of passenger car cockpit, a combined MADM-entropy process as a subjective and objective weighting method has been proposed to optimize orderly and reasonably. The smoothing iteration PSO algorithm with an added adjustable parameter as a new variant has improved the stability and convergence in computing process which was applied to optimize the human–machine interface layout of passenger car cockpit in three dimensions. The calculated results indicate that the new PSO variant proposed has a higher degree of accuracy than conventional PSO algorithms and other competition algorithms used to solve the cockpit layout problem such as GA and ACA. The layout optimized by the smoothing iteration PSO algorithm also shows the superior results analyzed by virtual simulations. Customer data were recorded and stimulations were conducted using the JACK software. The results given by the design optimization system show that the cockpit is suitable, comfortable, and safe for customers. The design optimization system based on the smoothing iteration PSO algorithm combined with MADM-entropy can solve the problems of the passenger car’s cockpit layout in three-dimensional space to improve ergonomic reliability effectively and properly.
Footnotes
Handling Editor: Xihui Liang
Declaration of conflicting interests
The author(s) declared no potential conflicts of interest with respect to the research, authorship, and/or publication of this article.
Funding
The author(s) disclosed receipt of the following financial support for the research, authorship, and/or publication of this article: This research was partially supported by the Guangzhou University Teaching Reform Project of Creative Product Design in Interactive Experience (09-18ZX0304) and the Guangzhou University Teaching Reform Project (09-18ZX0309).