
Abstract
Evaluating corrosion of steel bars within concrete cross section was the major task for durability of reinforced concrete structures. Although plenty of steel bars with various boundary condition caused huge computation load in numerical simulation, most of them were in different geometric locations while their other configuration was similar, such as temperature, moisture, and concrete composition. In this article, shape-based estimation approach was introduced for simplifying assessment of durability of concrete structures regarding numerical simulation. Based on the same penetration condition and diffusing media, the similarity of geometric configuration was the primary consideration of shape-based estimation and a mathematic model regarding the length of involving outline within a circular region with given radius was proposed. The crossbeam of an aged reinforced concrete arch bridge in coastal area was assessed, based on which shape-based estimation was proved to be applicable by comparing with finite element analysis. An evaluating tools called Weighed Corrosion Index in terms of corrosion degree of rebar in the whole concrete section was proposed and discussed in the application on degradation of concrete members. Moreover, for the purpose of modeling and post-processing, designed rebar within concrete section might not be exactly occupied by the nodes of meshed section and thus, content of aggressive agent cannot be directly obtained. An approach for identifying of rebar position and interpolating the content at rebar position was introduced.
Introduction
Since durability is always the major consideration for long-term service of reinforced concrete bridges, decisions regarding the future integrity of a structure or its components, relating to the type, cost, and possible rehabilitation strategy, depend upon an accurate assessment of the process of corrosion and the conditions affecting rate of deterioration. 1 Corrosion of rebar was being widely observed in all kinds of concrete bridges exposed to natural environment.2,3 A major reason was proved to be the attack of aggressive agent, such as chloride and acid from seawater, rain, and air pollution. At present, according to a considerable amount of published literature about numerical simulation, the achievement of most researchers contributed to degradation mechanism of material in mesoscale and microscale.4–14 However, there was a growing demand on modeling and assessing approach being suitable for concrete structures constructed by modern technology.
In light of numerically assessing structural performance, durability analysis was suggested to be categorized into mesoscale, macroscale, and structural scale,15,16 as shown in Figure 1:
Mesoscale. In the view of mesoscopic numerical simulation, concrete was recognized as the heterogeneous composite of three phases, including cement paste, aggregate, and interfacial transition zone (ITZ). Exact shape of cross section of corroded steel bar within concrete was also studied. 9
Macroscale. The study in macroscale always focuses on diffusion and degradation within plane cross section, but not the whole structural system. Concrete was expressed in homogeneous and steel bar was studied as an equivalent point within concrete. Content of aggressive agent surrounding steel bar was represented by the mean value and was extracted from the distribution on the whole concrete section according to the centroid of steel bar.17,18
Structural scale. Structural scale (over 10 m dimensionally) has already been studied for decades, but has not been detailed discussed combined with other scales in terms of durability. In structural scale, bridges were always modeling by beam element due to the acceptable modeling complexity and computation loading. However, this simplification caused insufficient description about detail of structures in terms of durability assessment, such as refined boundary condition, relationship of reinforcement and concrete, longitudinal diffusion. In ultimate state, the accurate longitudinal distribution of corrosion degree of each rebar was also studied, which would induce huge computation loading of simulation.
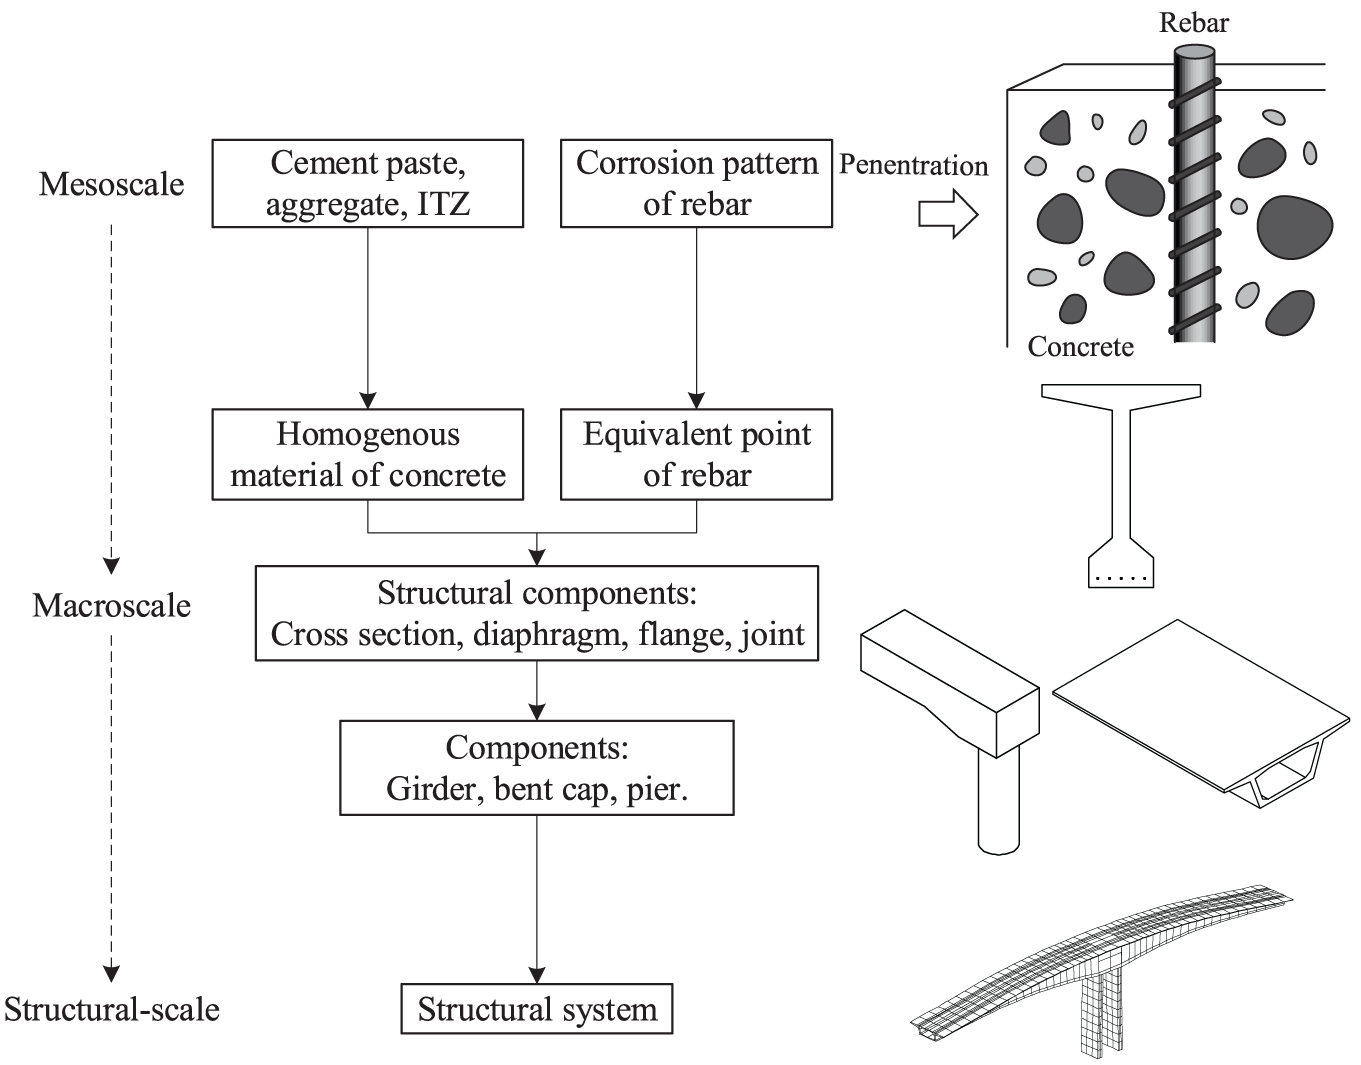
Multiscale modeling of concrete bridges, from mesoscale to structural scale.
Upon recent advance on numerical simulation for durability concrete, researchers always focused on degradation of material in mesoscale and microscale. Nevertheless, few literature talked about the whole cross section or the entire structures. In light of structural numerical simulation, Biondini accomplished a series of fundamental research achievement on time-variant durability analysis approach and studied on simulating the diffusion process by the approach of cellular automata providing the easily grid-meshing of domain and reliable efficiency. However, the choice of solving parameters was critical for further unexpected calculating error while the indispensable requirement of regular meshing causes the lower adaption of domain boundary and furthermore lower accuracy. Biondini et al. 19 presented a general approach for evaluating the degraded performance of concrete bridges regarding reduction of cross-sectional area and ductility of rebar, deterioration of concrete strength, and spalling of concrete cover, which was based on three-dimensional finite element model employed by beam element. Pitting corrosion might induce a significant reduction of steel ductility. According to experimental result, strength and ductility of rebar are significantly weakened by pitting. 20 Biondini summarized the ductility reduction model of reinforcing steel based on previous experimental data describing the relationship between steel ultimate strain and damage index of rebar.6,21
For the matters of evaluation on durability of concrete structures, this article discussed a simplified approach called shape-based estimation. The author addressed the similarity of the geometric configuration of steel bars in various types of boundary condition and location and accordingly, an estimation model for the service life of rebar was proposed. Besides, for the entire cross section, weighed damage index was introduced for overall assessment. Moreover, interpolated coordinate of equivalent point of rebar in one element was studied, which was applied for extracting aggressive agent content at rebar.
Macroscopic simplified assessing approaches
Shape-based estimation of rebar life
Corrosion and service life of rebar was always determined by the content of aggressive agent around it, such chloride ion, which was the principal hazard of concrete structures on coastal area. The factors affecting chloride content around rebar were its corrosion condition, including material properties of diffusing media, boundary condition, temperature, and diffusion period. However, it was widely accepted that assessing corrosion of steel bar regarding various influence factors was complicated and highly consuming on computing loading. Thus, a simplified assessing approach was proposed in this article and was proved to be efficient. Generally, similar atmospheric condition and concrete properties were presented for all rebar within one concrete member. From the viewpoint of design, the fundamental difference of the steel bars within the same concrete member was the location within concrete, while the other factors and corresponding assessing result were related to the location.
The location of each rebar in concrete was determined by two factors, the distance from surface of concrete (depth, d) and the shape of surface around the rebar. The latter one was simply distinguished as corner and arc. For the case of corner, the included angle of two intersected lines and curvature described the shape of the surface. Once the included angle increased to 180 ° or curvature became 0, the shape of straight line was obtained. The above three cases of boundary shape are shown in Figure 2.

Typical boundary shapes for rebar.
In this section, an assessing approach for rebar life called shape-based estimation (SBE) was discussed. As was widely known, modeling and analyzing for numerical assessing corrosion process of rebar was complex and time-consuming. By only assessing the difference of diffusion condition of each rebar, the life of the other rebar in the same concrete member would be estimated by referring to available data of one rebar, accordingly which was a reasonable and appropriate approach. Usually diffusion process of chloride within concrete was described by linear Fick’s second law

where D is the diffusivity of concrete. C denotes the chloride content. Boundary and initial conditions for above equation were defined as

where erf is Gauss error function.
A conventional corrosion environment in eastern coastal region in China was considered. A standard cover thickness of 7 cm for steel rebar was adopted, which was considered as the typical and average value for general design. Diffusivity and chloride content on the surface were Da = 1.837 × 10⁻¹² m2/s and 0.708%. Typical diameter of rebar was
where

where
For the consideration of various shapes of boundary outline, a group of included angles and curvatures were studied. Estimated life of rebar was defined as the time when only 60% of initial cross section remains (

Estimated life of steel bar for the cases of (a) corner and (b) arc.
Since the shape of boundary outline closed to the rebar was irregular, in order to compare its geometric characteristics, a circular region with given radius, the centroid of which exactly located at the rebar, was defined (Figure 4). The total length of boundary outline involved within the defined circular region

Involved boundary outline within circular region: (a) corner, (b) straight line, and (c) arc.
According to the configuration in this article, the relationships of

The relationship of LC to rebar life regarding RC/d: (a) corner and (b) arc.
Besides the shape of boundary condition, diffusivity of concrete, diameter of rebar, and distance from surface of concrete to rebar centroid (thickness of concrete cover) were also the major factor for diffusion in chloride, which is studied and shown in Figures 6 and 7.

Rebar life versus length ratio, on corner: (a) diffusivity of concrete (ϕ = 16 mm) and (b) diameter of rebar.

Rebar life versus distance from surface of concrete to rebar centroid (1.0Da).
Linear fitting laws of length ratio to rebar life were also observed in these cases. All linear regressed lines in a group of slopes intercepted at a fixed point on x-axis (
A clear result from the simulation showed the positive effect of thickness of protective layer on rebar life. Thus, it should be considered as a part of the estimation of rebar life by mathematic way. By means of polynomial regression, a pretty close quadratic polynomial law showed the relationship between the distance from surface of concrete to the centroid of rebar (Figure 7).
By regression of above obtained results, the expression of rebar life

where


Here, d is the thickness of concrete cover (mm).

Based on geometric relationship, calculation of involving length
For corner

For arc

where
Since practical application of the above-simplified estimation might be arguable, additional simplification was introduced. The involving outline around the rebar location should be simplified to standard profile on the conservative side in the following two typical cases simplifications:
Asymmetric profile. Reinforcement would be designed at the location with different distances to both adjacent lines. If any part of the line with longer distance was involved within the involving circle, the very line was moved to a new position with the same distance to the rebar as the other line and thus, the outline for the rebar was converted into symmetric type regarding the shorter layer thickness, as shown in Figure 8(a).
Concave profile. The concave profile case is simply converted into the straight line case. The distance to the imaginary line is equal to the distance from the rebar to the vertex of concave corner (Figure 8(b)), which is equal to the shortest concrete protective layer thickness and the imaginary line is perpendicular to the connect line of rebar and vertex.
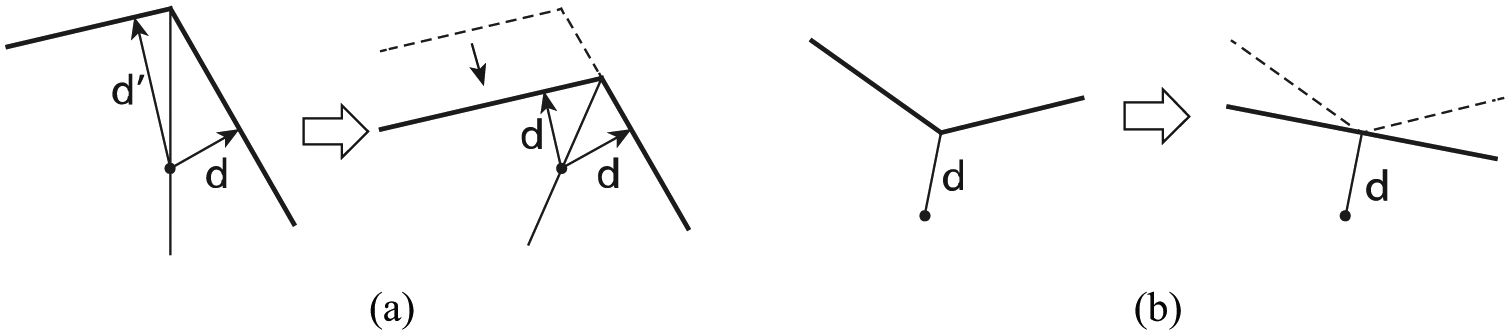
Two simplification cases of involved boundary outline for shape-based estimation: (a) asymmetric convex corner and (b) concave corner.
For the design of multiple layers of reinforcement in concrete, the rebar embedded at the deeper location in concrete was always considered to be safer compared with outmost set due to thicker protection layer and accordingly lower chloride content. Thus, it was reasonable to suppose that, the rebar set outside of the chloride diffusion zone edge was considered to be absolutely safe from corrosion. Here, diffusion zone edge was defined as the dividing line where its chloride content was low enough that cannot cause significant corrosion of rebar.
Furthermore, there is still some limitation of SBE. Corrosion of rebar was complex and still affected by many factors, such as temperature, moisture, and concrete composition, which were always different for places even within the very single concrete member or cross section and were not considered in SBE. Thus, SBE was considered to be applicable for rebar set in similar condition, such as the same exposed surface of concrete.
Weighed evaluation for corrosion of rebar
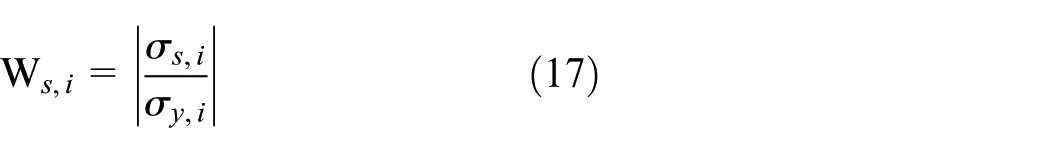
In order to guarantee ultimate structural capacity and ductility of concrete structures, a large number of steel bars were always configured for reinforced concrete section. Therefore, it was considered to be highly work-loaded to handle the huge amount of available data and summarize useful and significant result for researchers and engineers, which was provided by detail information from finite element method (FEM) program. Besides, in most service states of bridge structures, only a part of entire steel rebar played an important role for requirement of ultimate and sustainable service. However, structural stiffness and ultimate strength can hardly clearly reveal the state of these components. Thus, an additional categorization of the rebar is necessary. Upon these reasons, weighed capacity index (WCI) was defined for describing the remaining effective degree of a corroded reinforced concrete section based on corrosion and weighing of all rebar. WCI is expressed as follows

where the area reduction of the ith rebar,

For tensile rebar only
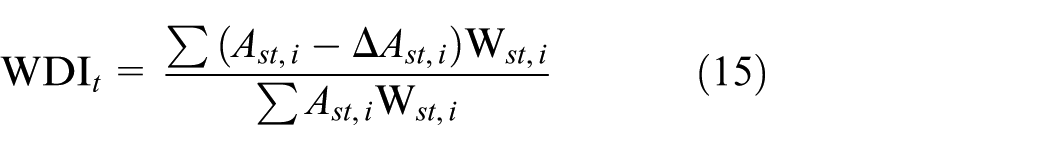
Upon the definition of WCI, weighing of each rebar was the major factor for consideration. Describing steel bar’s vulnerability and its role in the whole section, the value of

Regarding the loading status and importance of each rebar located within concrete section, weighing of each rebar could be improved by its in-service stress

The content in section ‘Capacity of reinforced concrete section’ discussed the application of WCI in evaluation of concrete structures.
Interpolation of rebar position in quadrilateral element
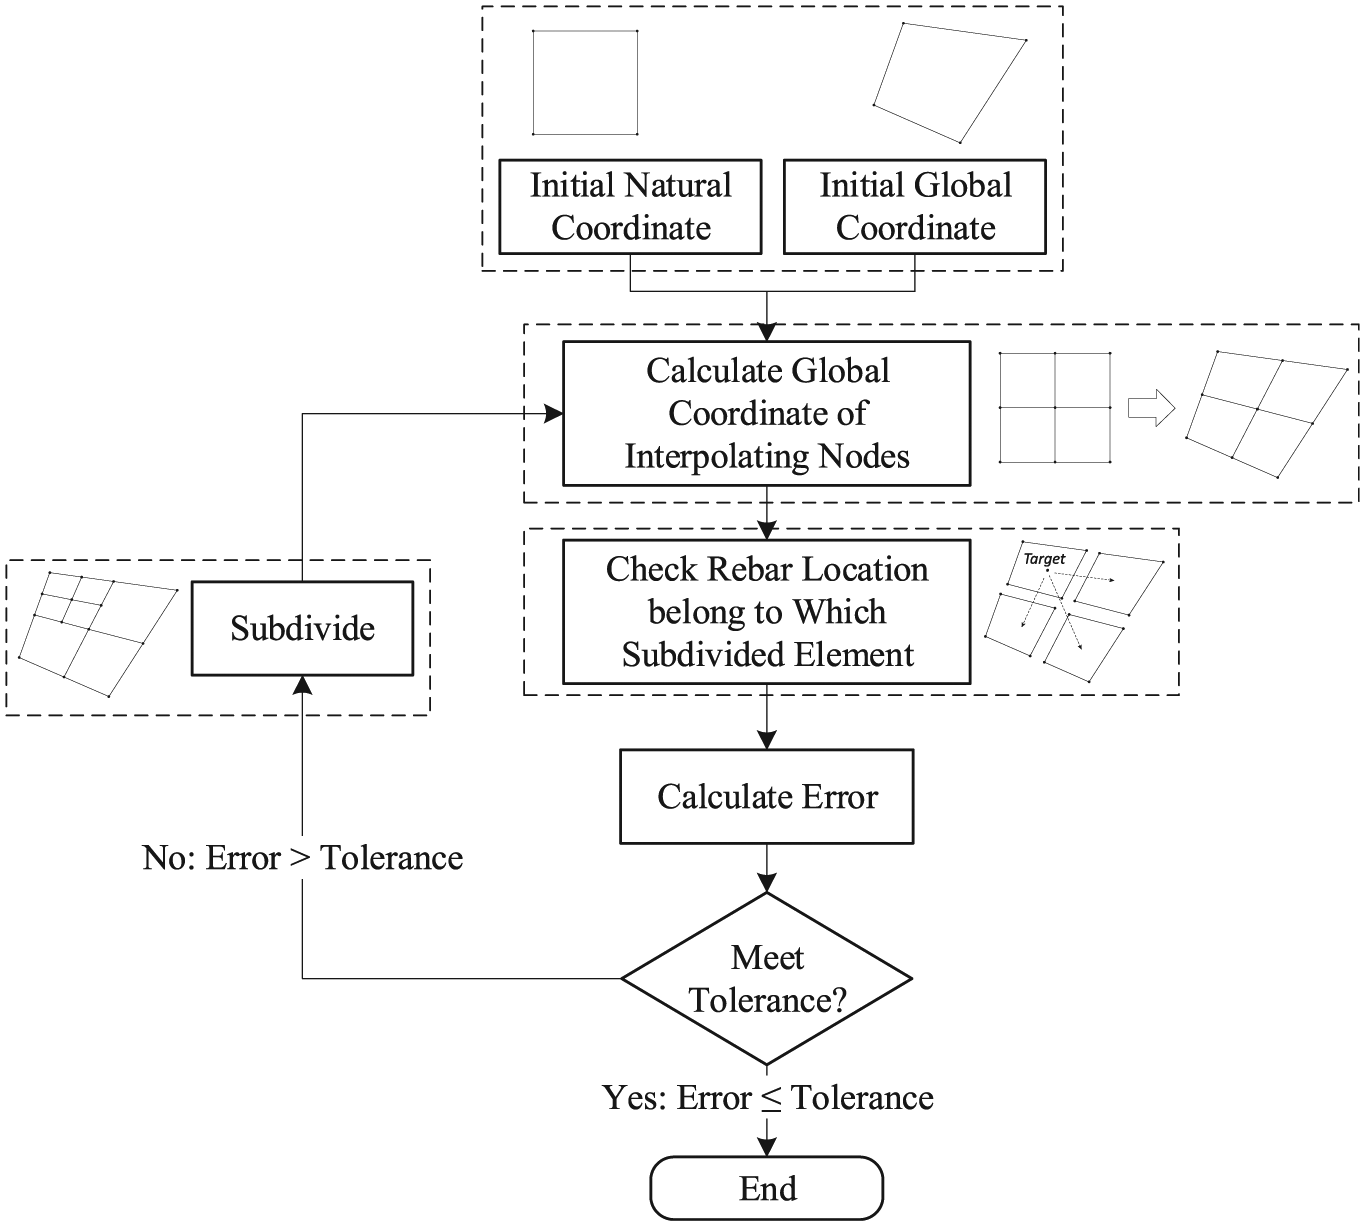
In macroscopic simulation of diffusion in concrete, girder cross section was always meshed into four-node quadrilateral elements or eight-node elements, which was considered to provide acceptable precise with fine enough meshing grid. However, there were some problems about the relationship between rebar and meshing grid of cross section. First, regarding the configuration and spacing of rebar within concrete, in most cases it was impossible to create a meshing grid providing all nodes exactly occupying each rebar and most rebar might locate in interior or on the edge of the elements composing the whole section. Second, it can hardly directly deduce the precise solution in element’s natural coordinate by global coordinate. Third, there might be careless input data resulting wrong location of rebar. A typical error is that rebar is located outside of the whole concrete section. Thus, an interpolating algorithm need to be developed for identifying geometric relationship between rebar and the meshed grid, which was demonstrated in Figure 9.

Illustration about rebar located inside or on edges of elements and not occupied by nodes.
Regarding modeling for durability analysis, a simple and effective approach was introduced in this article for identifying the quadrilateral element which the target rebar belongs to and calculating their mathematic relationship by nodal values and weighing parameter of four neighboring nodes. This procedure includes two steps: (1) check the location of rebar regarding concrete section and determine the involved element; (2) calculate the interpolating relationship with neighboring nodes. With the interpolating relationship, the content at rebar can be directly calculated by the nodal values of the involved element.
For the first step, the involved elements for the given rebar are determined. The location of rebar regarding concrete section is judged by the relationship of rebar and involved elements. The principle of determining the location of point related to a quadrilateral was introduced first. Then, the procedure of determining location of point related to the whole section was discussed. In the end, an approach of calculating the interpolation of the content at rebar by neighboring nodal value was introduced.
Point related to quadrilateral element
Once the relationship between the given rebar and each element is determined, the relationship between the given rebar and the whole section can also be judged. An applicable algorithm based on cross product of vectors was introduced in this article regarding the time-consumption induced by huge number of meshed elements.
The location of target point related to the referred element (quadrilateral) produced the signs of a group of vectors composed by the target point and four nodes. As was known, nodal numbering of convex elements generated by standard meshing technique was definitely in counterclockwise order. Four side vectors composed by the four sides of the quadrilateral was marked as

where
Position of target point (k) regarding one element and the signs of cross products generated by target vectors and side vectors.

Rebar related to section
Although the relationship of point (rebar) related to every element was judged, the relationship of point related to the whole section was still arguable, which was the major consideration for checking input data of rebar location. There are three kinds of locations for a specified point related to a region, Inside, On-Boundary, and Outside. Considering meshing grid with quadrilateral elements, eight kinds of location would be detected for program determination, as shown in Figure 10.
Cases of location describing point related to section.
A group of specified location counters were assigned for indicating the total number of the corresponding case’s occurrence for all elements, described in Table 2.
Accumulation determiners of location relationship and their description.

By checking the relationship of target point (rebar) and every element, four types of location for target point (rebar) were counted up and a combination of location counter was obtained. For every kind of combination of location counter, the location of target point (rebar) related to a section was further discussed, described in Table 3.
Determining the location of target point referring the section according to location counters.

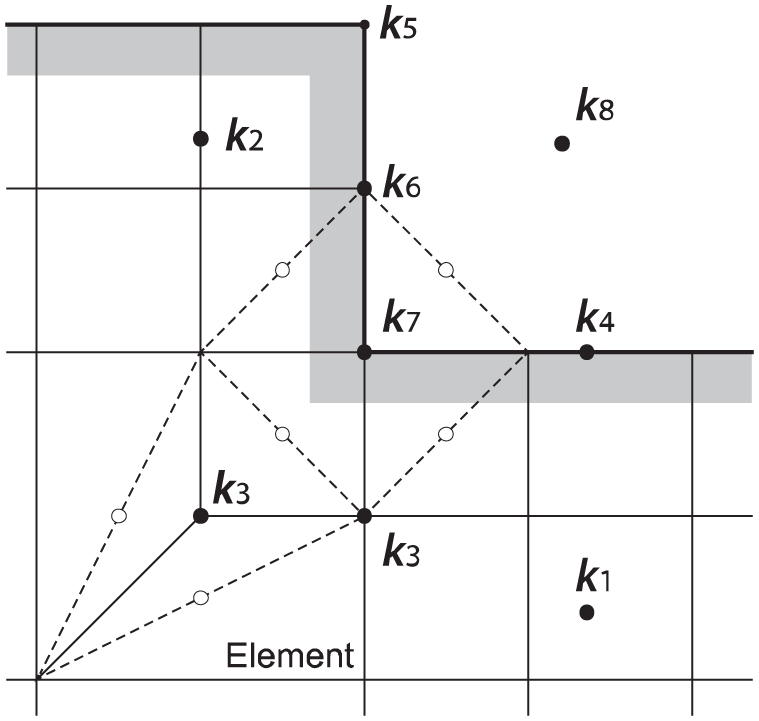
Above all, by identifying the value of location counters, the location of target point (rebar) can be approximately determined except the controversial cases of k3 and k7 (CV ≥ 3) that the target point was located on the common node of over two elements.
For these two cases, there were at least three element sides connecting to the target point. A group of diagonals enclosing the target point (dashed lines shown in Figure 10) were drawn and thus a group of mid-points on the diagonals (white points in Figure 10) were obtained. For case of k7 indicating the target point was located on the boundary, there should be at least one mid-point outside of any element while all mid-points for the case of k3 were inside of elements respectively.
Diffusion content interpolation at reinforcement
The following content discussed the case that rebar located in interior of one element. The element coordinates and element displacement were expressed in the form of interpolations using the natural coordinate system of the element by the procedure of isoparametric finite element formulation. For given point

where


where
A numerical trial method of 2D bisection method was recommended, shown in Figure 11. For the beginning of every trial, the first selected quadrilateral was equally divided into four pieces and four new elements were generated. Meanwhile, five new nodes located at each mid-point of four sides and the centroid of the element were introduced. All new nodes were numbered in right-hand order within every newly generated element. Furthermore, the element of the four new ones where the given point lying inside was determined based on the subroutine developed. With the above process of subdivision, the centroid of the element, which the given point (rebar) was located in, gradually approximated the true location of rebar, demonstrated in Figure 12. By repeating several iterations, the above trial was terminated until the distance from the new centroid to the given point was less than predefined tolerance and natural coordinate of the given point
Process of calculating natural coordinate of target point related to quadrilateral by iteration of 2D bisection method.

Process of obtaining the approximate natural coordinate of target point by iteration of bisection method.
The advantage of 2D element bisection method was that it was applicable for any type of shape function. All vertices for trial quadrilaterals were interpolated by assigned shape function and explicit expression of solution of equations was unnecessary.
Capacity of reinforced concrete section
A reinforced concrete arch bridge in eastern coastal area of China built in 2000 was studied by means of the approach introduced in this article (Figure 13). Recent investigation indicated weakened structural performance of the crossbeam (Figure 14) and it was believed to be difficult to replace the crossbeam compared with deck and suspender. Thus, durability evaluation was considered for further assessment. The approach (SBE) introduced in this article was compared with conventional assessment of entire rebar regarding the penetration of chloride from environment.

Landscape of reinforced concrete arch bridge.

Visible concrete spalling induced by corroded rebar on crossbeam.
Model configuration
The dimension and configuration of crossbeam is shown in Figure 15. It is worth noting that the main tensile rebar on bottom of the cross section was in a combined group composed by three single steel bars. Each rebar was assessed as an individual one and was independent of its adjacent rebar.
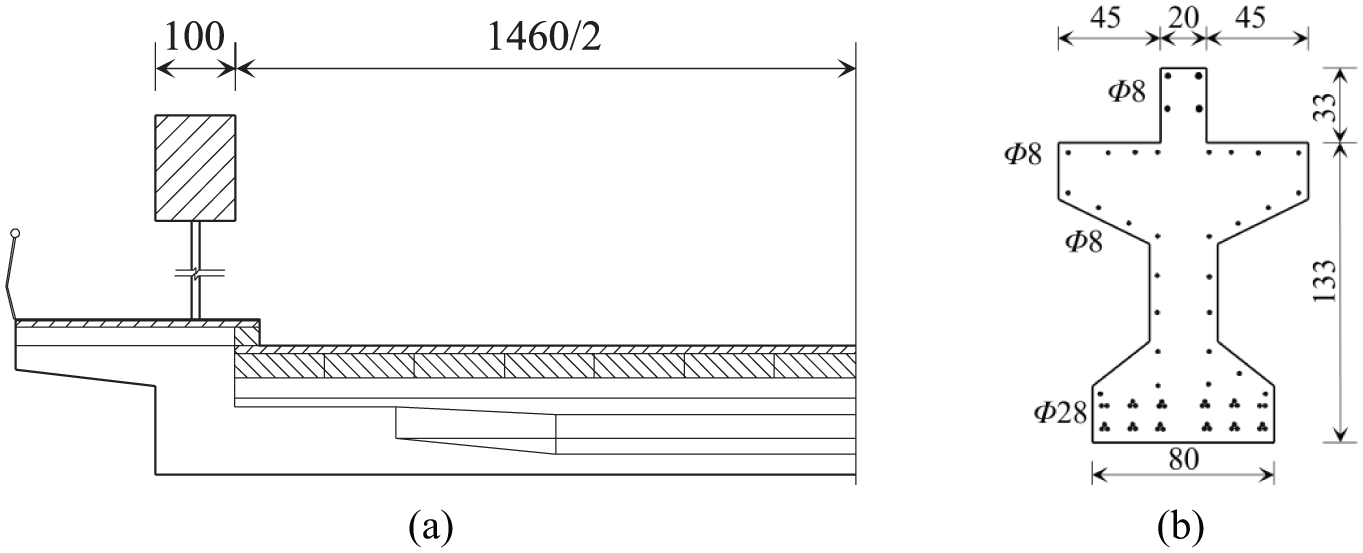
Dimension and configuration crossbeam (dimension in centimeter and rebar diameter in millimeter): (a) plan view and (b) cross section.
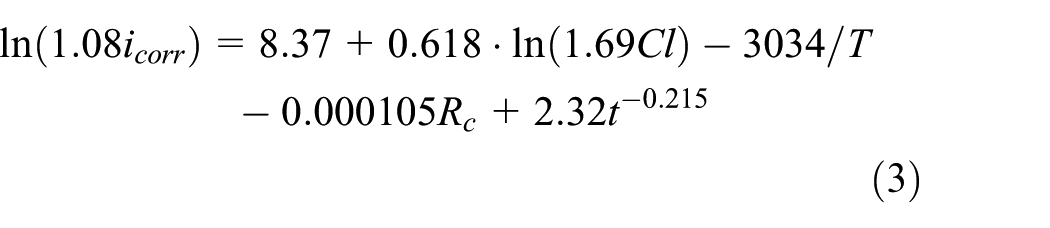
For assessment of corrosion, corrosion process of each rebar with pitting factor (R = 4) 25 was calculated by corrosion model described by equations (3) and (4) according to Liu’s model.13,22 Ductility of rebar was modified in terms of the model introduced by Biondini et al. 6 Degradation of the compressive strength of concrete was analyzed according to the model introduced by Coronelli and Gambarova. 14 Only ultimate strength of concrete cover confining rebar was considered to be weakened with the development of crack led by expansion of rebar corrosion. 26
Content on surface of concrete member and diffusivity of chloride ion were referred from the section ‘Macroscopic simplified assessing approaches’. For crossbeam, both lateral sides and bottom side were exposed. The ingression of chloride ion was ignored at its upper side due to its combination with deck slab and pavement. Environmental temperature was controlled by the model from Bastidas-Arteaga et al. 27 Higher and lower limit of annual temperature was referred to the record of local weather station.
For structural analysis, the stress–strain diagram of the concrete is shown in Figure 19(a). The branch in compression was described as follows 28

where
Degradation of structural capacity
Sectional distribution of chloride content of crossbeam at 100 years was obtained by numerical simulation. The contours of sectional chloride distribution are shown in Figure 16.

Sectional distribution of chloride content of each member, 100 years of exposure (Unit: kg/m3).
As shown in Figures 17 and 18, there were totally 21 individual longitudinal steel bars within one half of the symmetric section. Wherein, 14 unique types of location were categorized and marked according to involving outline profiles upon the simplification approach discussed in section ‘Macroscopic simplified assessing approaches’. Rebar marked with ⑫, ⑬, and ⑭ were located in the region sealed by adjacent concrete decks and thus were ignored for further analysis. Rebar marked with ④, ⑤, and ⑥ were located in the core of concrete, which was ignored of corrosion throughout the service life.

Typical locations of longitudinal rebar in crossbeam section (Dashed: Neutral axis).

Meshing of cross section combined with centroid of rebar.

Diagram of constitutive law for concrete and reinforcement.
According to the assignment of boundary condition of the section, each rebar was in the uniform condition of environmental penetration and thus, SBE was applied. Upon the shape of the cross section, only the case of Arc was identified for all rebar in this cross section. Geometric information of each type of rebar with simplification was summarized and listed in Table 4. Length ratio
Outline category and involving length for rebar location.

SBE: shape-based estimation; FEM: finite element method.
d denotes the least perpendicular distance from centroid of rebar to concrete surface.
Assuming 60% as the limit of safety operation of each rebar, service life
With the life ratio of SBE and FEM, the corrosion process of each typical rebar was simply scaled along time-axis by referring rebar (Figure 20). Besides, time-variant ultimate bending capacity of the section within 100 years was analyzed regarding the corrosion degree of all corroded rebar from the results of SBE and FEM. Ultimate bending capacity,

Corrosion process of rebar at numbered typical location.

Remaining capacity of crossbeam over 100 years of exposure.
Weighed corrosion assessment
The time evolution of structural capacity showed the overall degradation law of the section combined with all corroded rebar, but it did not reveal the distribution of degradation interior to the cross section. The following content discussed the application assessment by means of Weighed Corrosion Index (WCI) regarding the studied case above.
Stress distributions resulted by external bending moment including 0.2

Evolution of WCI for crossbeam section regarding corrosion of rebar: (a) weighing by stress and (b) weighing by rebar life.
The obtained diagrams of WCI described corrosion history of rebar within concrete. The dashed line in the figures indicated that the rebar within compression zone entirely corroded down. Ather that, the red line then showed the remaining uncorroded compressive rebar. WCI fully weighed and WCI in only tension were close due to larger weighing of tensile rebar. Thus, the diagram showed tensile rebar was identified as the mainly operating components. The deviation between three loading states in the diagram of weighing by stress showed the yield of tensile rebar and a stress redistribution. An interesting phenomenon was worth noting that in the diagram of weighing by stress, WCI in uniform weighing (Pink line) significantly deviated with WCI fully weighed at 100 years, which could be recognized as accelerating corrosion occurred on tensile rebar. Accordingly, the pattern of WCI curve played as a useful tool for inspecting the detail of degradation of reinforced concrete structures, which was the base for decision of future maintenance.
Conclusion
SBE approach was introduced in this article for simplifying assessment of durability of concrete structures regarding numerical simulation, which was studied by assessing the crossbeam of an aged reinforced concrete arch bridge and was proved to be applicable. Based on the same penetration condition and diffusing media, the similarity of geometric configuration was major consideration of SBE and was appropriate for evaluation on plenty steel bars.
The diagrams of Weighed Corrosion Index (WCI) indicated degradation of structural performance and described detailed information compared with evolution of ultimate structural capacity. The case studied in this article showed corrosion history of rebar within concrete in terms of boundary condition, service life, and operating stress.
The application of interpolation on rebar location was an important tool for assessing rebar within meshed concrete section. The relationship between a given point (rebar) and one element was able to be determined according to the sign of cross product of vectors, which helps locating rebar regarding concrete section. With the trial method of 2D bisection method, precious natural coordinate of a given point within an element can be calculated and helps generate the weight of each node for further interpolation of content at rebar.
Footnotes
Handling Editor: Grzegorz Golewski
Declaration of conflicting interests
The author(s) declared no potential conflicts of interest with respect to the research, authorship, and/or publication of this article.
Funding
The author(s) disclosed receipt of the following financial support for the research, authorship, and/or publication of this article: This article was sponsored by National Key Research and Development Program of China (2016YFC0701202), project supported by the National Natural Science Foundation of China (51508053), project supported by the National Natural Science Foundation of China (51608069), and project support by the Fundamental Research Funds for the Central Universities (106112014CDJZR200016), which were greatly appreciated by the authors.