
Abstract
Bulk shipping transport is an important part of ocean transportation. One of the most important aspects for bulk ship owners is to make choices about the ship’s operational area for the next planning period. In this article, based on the Baltic Supermax Index and historical decision data of different companies, the support vector machine model is used to predict the dry bulk carrier route selection, which provides a solution to this problem. The numerical results show that the model and the algorithm proposed in the paper can well work and can achieve good precision. Via comparative analysis, we prove that the model we proposed in this article has better performance than some other common methods in the research area. The proposed model would support dry bulk shipping company in route choice so as to balance the profit and potential opportunity when making choice for ships’ route selection.
Introduction
Dry bulk shipping market is a derivatives market of the global trade. It has a seasonal and cyclical fluctuations year by year. Figure 1 shows how dry bulk shipping market level changes in recent 1 year. For example, in North American continent, during grain harvest time, market is usually at a relatively high level. And during the Christmas and Chinese New Year time, as people usually reduce production and operation activities, market is then on a relatively low side. Some countries and regions that have fixed exports of bulk minerals, coal, grain, and imported commodities have formed some fixed routes for many years. In the absence of war, serious natural disasters, and other force majeure, the supply on some routes has remained cyclical throughout the year. Relative to the seasonal and periodic rules, the most basic normality of the market is volatility and uncertainty. Therefore, we believe that the development trend of dry bulk shipping market in a year may be a repeat of a similar situation in recent history. How to effectively combine the two characteristics of the shipping market, portray the mathematical model closest to the actual situation and optimize the operation of the fleet in the short term (3–6 months) in the future. Especially, for the uncertainties in the various links of a fleet’s short-term voyage task scheduling, how to accurately deal with the actual situation, to provide decision-makers with systematic optimization, decision-making scheme is the research focus of this article.

Baltic Dry Index summary (data from tradingeconomics.com).
For a non-scheduled fleet of ships operated by a particular ship owner, generally in a short–medium term decision-making, the decision-makers will allocate the fleet resources to different operational areas at the end of the planning period and ensure the ships through subsequent selection of diversity. The team can have a relatively stable income level in the follow-up operations. The shipping market is affected by many uncertainties such as trade, shipping cycle, season, geographical environment, politics, and war. Therefore, most fleet operators will combine their own sources of supply, the operation experience, and judge the future market. Other factors will put capacity into the route with expected supply and high market returns. However, in order to balance operating income with market risk, it is also necessary to invest part of the ships in other sea areas with less temporary supply, or in the area that is conducive to subsequent voyage arrangements. This balanced allocation of ships can reduce the risk of potential loss by market prejudgment errors or market mutations. Also, it can make the fleet grow steadily. After determining the final specific location of each ship, the decision-makers will then perform voyage task scheduling on a case-by-case basis for each ship based on market information, forecast data, and operational experience.
This article mainly introduces how the ship owners will arrange their tonnage in the spot market and continue to operate. How to formulate the shipping routes of the fleet according to historical experience and current market level and what proportion of the ships they control will end at the planning period. It is configured to operate in different ocean areas.
For shipping companies, the choice of ship operation area is one of the most important aspects of fleet management, but various factors affecting decision-making are interrelated and difficult to analyze through general mathematical methods. In the route selection of historical ships, the route decisions of other shipping companies in the market are mostly correct and can bring profits to the shipping companies. Behind these long-term and large-scale historical decision-making results, there are actually potential rules. The decisions of most of the participants in the market are made based on huge historical data. There are many participants in the dry bulk market. In most cases, the ship owners will make the decision of most participants in the market at similar market levels in the recent period as a reference for their own choice. According to the characteristics of the decision-making process of the ship owner, the author collects the ship’s track data of the market for a period of time as a reference for the basic data of the forecast of the future ship operation area of the market participants under the current market level.
Literature review
The choice of ship operation route belongs to the research of fleet planning. In this field, Xie and colleageues1,2 are equivalent to the late 1980s and early 1990s. A series of methods were proposed.3–8 Yang et al. 9 introduced a new method in 2014. Some effective methods on route choice and operation area can be found in these literatures. Yao et al. 10 introduced an improved particle swarm optimization for a vehicle routing problem (VRP). Yu and colleagues11–13 used ant colony model worked on some routing problems. The fleet planning method in complex environments, but the research on the selection of specific routes for ships is still relatively small. Bakkehaug et al. 14 proposed a new multi-stage stochastic programming formulation for strategic fleet renewal in shipping . The new formulation explicitly handles uncertainty in parameters such as future demand, freight rates, and vessel prices. The uncertain parameter is hard to predict which is quite similar as in our problem. Wang et al. 15 presented an operational network representation of a liner shipping network. Based on the network, an integer linear programming model is formulated to obtain container paths with minimum cost. Finally, they added constraints to the integer linear programming model, excluding those paths already obtained, so as to find all the container paths. Their paper shows an innovate method to solve fleet route selecting problem. MW Ng 16 visited a class of liner fleet deployment models. He pointed out an implicit (and unnecessary) assumption in the class of models that can lead to fleet deployment plans that employ more vessels than strictly necessary.
Accurate route selection prediction is difficult. Time series model, artificial neural network, and support vector machine (SVM) model are the most important predictive research methods. For the application of prediction methods, Stephanedes et al., 17 DeLurgio 18 respectively gave different directions for discussion. The time series model has obvious lag in prediction, and the similarity between future information and historical information is highly dependent. The change of historical average data will have a great impact on the prediction results. 19 And recent years, some literatures can be found the well prediction result basis short-term traffic condition.20–22 Guan et al. 23 also use SVM model to get well prediction result on shipping index. The neural network simulates the function of the human brain nervous system based on the neurons of the human brain. The ultimate goal is to develop an artificial system with intelligent information processing functions such as learning, association, and memory. Its advantage is its unique nonlinear adaptive information processing capability, but there are also problems of structure determination, over-learning, under-learning, and local convergence.24–26 The main research method of SVM27–30 is to extract the laws that cannot be obtained by principle analysis from the finite observation data (sample). And then use it to analyze objective objects, predict and judge unknown data or new phenomena that cannot be observed.31–33 SVM is easy to balance the degree of fit and generalization, and the generalization ability is obviously superior to neural network. This is also the choice of SVM to predict the selection of bulk carrier routes.
According to the research of Lu and Chen 34 and Chen and Zhao, 35 it can be determined that the dry bulk shipping index has a clear guiding role for future market trends. In Lu and Chen’s paper, 34 a null means stationary series is reached which matched autoregressive moving average auto regression moving average (ARMA) model after removing the long-term tendency, cyclical fluctuating, and seasonal fluctuating one by one from Baltic Freight Index. And in the papers of Lu et al. 34 and Chen and Zhao, 35 we clearly got that the Baltic Dry Index (BDI) number has effective information for market player to make decision. Ruan et al. 36 examined cross-correlations between BDI and crude oil prices. Alizadeh et al. 37 investigated the effect of vessel specific and market variables on the probability of scrapping dry bulk ships with an index dataset from 2012 to 2015. Some bilateral effects are found in Dai et al.’s paper, 38 showing that lagged variances could affect the current variance in a counterpart market, regardless of the volatility transmission. All in all, from above, we can conclude that Bulk dry index has clear guiding role. In this article, a Supermax bulk carrier is taken as an example. The Baltic Supermax Index (BSI) of the four routes currently selected by the fleet is an input variable, and the final unloading of the ships at the end of the planning period corresponds to the beginning of the planning period. The position change is predicted for the output variable. This method provides a new perspective for the choice of ship operation area and also expands the application range of the SVM model.
Bulk ship fleet route selection prediction model
SVM model construction
The basic practical idea of SVM model prediction is to map sample data to high-dimensional space. The original problem is to solve the problem of regression hyperplane. SVM model transforms it into solving quadratic programming problem and solves complex nonlinearity problem with simpler linear regression method.
Given a sample with unknown relationship (

In order to determine the regression coefficient


The first item of equation (2) is called a regagrangian operatoularization term, which makes the function flatter to improve generalization ability. The second term of equation (2) is the empirical risk functional, which is determined by different loss functions. Constraint C > 0 controls the degree of penalty for samples that exceed the error
Equation (2) is a convex quadratic optimization problem that needs to be transformed into a dual problem

L is Lagrangian operator,


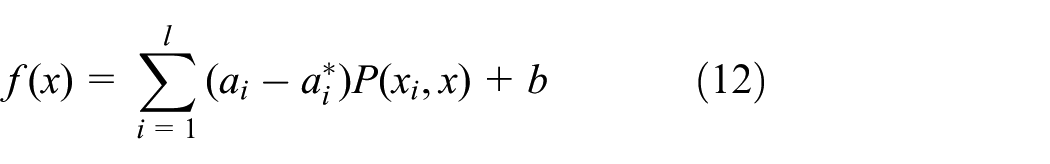
Can be obtained after solving

then

define
Taking the Supermax dry bulk carrier as an example, the BDI is a very important reference for the shipping company to select the route. 39 The specific index of the Supermax dry bulk carrier is the BSI. The main routes of the four Supermax dry bulk carriers constitute the comprehensive index of BSI according to their respective importance and proportion in the market, reflecting the actual price level of daily transactions in the market, which is important for the ship owner’s market decision-making behavior.
The basic idea of SVM model prediction is to map sample data to high-dimensional space. The original problem is to solve the problem of regression hyperplane. SVM model transforms it into solving quadratic programming problem and solves complex nonlinearity with simpler linear regression method problem. The SVM model is very suitable for solving some complex or nonlinear problems. The principle is to map the input data to a high-dimensional feature space through the kernel function. The route selection prediction problem proposed in this article is nonlinear. The SVM model in this article is used to map the relationship between the output of four routes and the input (four-route BSI index), so as to predict the decision making behavior of other participants in the market as the ship’s next fleet scheduling reference.
In this article, the average relative error (MAPE) is used to judge the validity of the model

n is the number of test samples,
MAPE is the most intuitive comparison of the prediction results and the true value deviation. The percentage of prediction error can be clearly stated. At the same time, the application of this indicator can also be used to measure the prediction results of different models based on the same input data. It enables the application of different methods in this field to clearly compare with each other.
Parameter calibration
The accuracy of the prediction model is determined by the selection of the kernel function and the calibration of the parameters. This article determines the parameters
Implementation and numerical results
Application of SVM to predict dry bulk fleet route selection
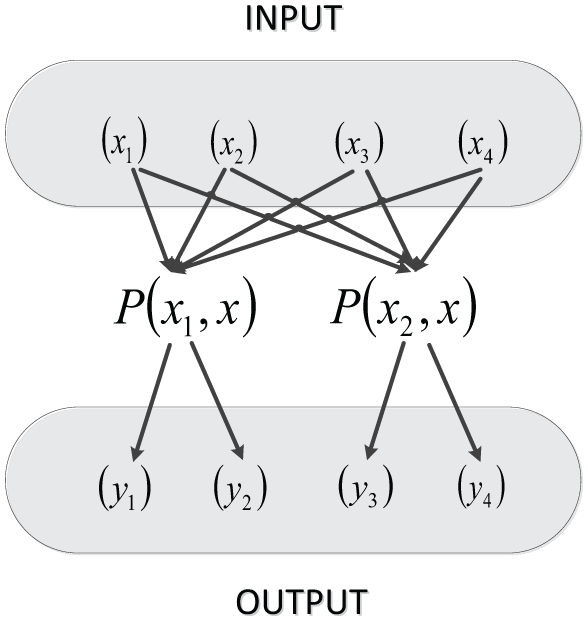
Figure 2 shows the structure of the SVM model presented in this article. There are four input variables: BSI value for the internal round-trip route of the Atlantic
Prediction model of line choice.
As shown in Figure 3, a shipping company has two routes to choose from in the Pacific Ocean. You can choose the Pacific to Atlantic route, or choose the Pacific internal round-trip route. Similarly, ships in the Atlantic also have two routes to choose from, you can choose the Atlantic to Pacific route, or choose round-trip routes within the Atlantic Ocean. In the vast market, most dry bulk shipping players are very experienced and mature companies. The shipping company uses the BSI value as an important reference indicator when making decisions. When we made a decision, we knew what the decision of most ship owners is when it is similar to the current market index in a certain period of time. Then it can be used as a reference for decision-making.

Four lines of Supermax bulk carriers.
As of the end of 2014, there were approximately 5200 Supermax dry bulk carriers being operated on the market, excluding some special-purpose vessels and old vessels. The operational data of more than 4000 vessels can be used as a database sample of the SVM model, with an average of voyages per vessel. The operation is 40–50 days of calculation, so that an average of 80–100 ships per day in the market will make decisions for the execution plan of the next voyage. In order to verify the validity of the model, we collected the BSI and ship navigation trajectory data from October 2014 to August 2015 for a total of 10 months. Using the above data, we can verify the effectiveness of the SVM model to predict the ship route selection model.
Assumptions
All ships only perform a single voyage mission. In actual operation, the ship owner’s ship may perform a single voyage, or a longer period until the long-term charter. Due to the complexity of the problem, this article only discusses the assumption that the market ships are all performing a single voyage mission.
Regardless of the ship’s need to perform a specific voyage for reshipment or docking (in the case calculation, the data are corrected according to the proportion of the ship obtained from the sample survey data).
Regardless of the ship’s execution of its own cargo (in the case calculation, the data are corrected according to the proportion of the ship obtained from the sample survey data).
For the sake of calculation, it is assumed that each voyage has a sailing period of 30 days (same ocean area) or 60 days (cross-ocean area).
Make a route selection decision 5–10 days before the ship sails.
Data collection
According to the name of the ship and the ship’s own deadweight tons, construction year, captain, and other attributes, the ship’s port record is collected in the sequence of natural dates, so as to obtain the ship’s driving track information. Import data were put into MAPINFO11.0 software to visually see the trajectory of each ship. Based on this information and the characteristics of the operation of the Supermax ships, the direction of execution of the ship’s voyage mission during a specific period of time is judged. Take Figure 4 as an example. A ship visited to eastern India on 26 December 2014. Then she called Australia on January 10 and returned to China at the end of January. Judging from this, the ship’s mission for the voyage should be decided around December 20, and the ship’s decision on the ship’s navigation will be left in the Pacific. Search for daily ship route selections and calculate the percentage of each route selection.

Ports a vessel had called during end 2014 to early 2015.
We have collected actual observation of 320 ship sample results from June 2014 to August 2015. Also we have collected BSI data from June 2014 to August 2015.
Numerical results
When the shipping company makes a decision, there are two options for pre-empty ship routes in the Atlantic, that is, the round-trip route inside the Atlantic and the transit-trip route from the Atlantic to the Pacific. The situation is similar for the ships pre-empty in the Pacific Ocean. Therefore, it is assumed that the proportion of pre-empty ships on the Atlantic route choosing the internal round-trip routes of the Atlantic Ocean is q. Then the proportion of pre-empty ships choosing the internal transit-trip routes is
According to the actual observation of 320 ship sample results, a total of 62 ships made decisions in February 2015. There are a total of 25 ships in the Atlantic. 10 ships are unloaded in the Pacific region after 2–3 months, and 15 ships are unloaded in the Atlantic region after around 1 month. There are a total of 37 ships in the Pacific Ocean, of which 14 ships are unloading in the Atlantic region after 2–3 months, and 23 ships are unloading in the Pacific region after around 2–4 weeks. Using the SVM model, the 4 months BSI data before 1 February 2015 is used as the learning database, combined with the average BSI calculation within 10 days of the decision period in the case. We got 13 pre-empty ships in the Atlantic, 1–2 months after the final unloading of the port in the Atlantic. Eventually, twelve of them choose to be unloaded in the pacific and 25 ships would open the pacific ocean. After 2–4 weeks, the final port is unloaded in the Pacific Ocean. And few months later, 12 final ports are selected in the Atlantic.
Validity analysation
To verify the validity of the model, we compare the linear regression and K-nearest neighbor models with the SVM model. The results are shown in Table 1. We can see the numerical difference among the three methods according to the actual result. It is quite clear that the SVM model shows best accuracy comparing with the actual result.
Route choice results of the three models and actual result.

SVM: support vector machine.
From Figure 5, it can be seen that for SVM, the average relative error (MAPE) of route selection for pre-empty Atlantic and Pacific ships are 8.0% and 5.4%, respectively. For ships which are pre-empty in the Atlantic, the K-nearest neighbors’ prediction results are similar to those of the linear regression, which is much worse than the SVM results. For ships which are pre-empty in the Pacific Ocean, the SVM prediction results are similar to the linear regression prediction results, which are far superior to the K-nearest neighbors. Overall, the results on the data of SVM are slightly better than the linear regression and far better than K-nearest neighbor method.

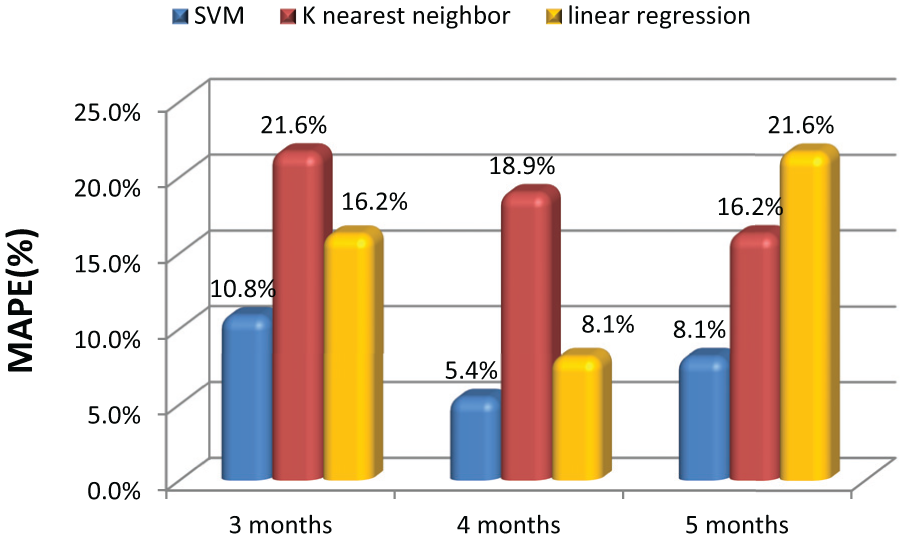
MAPE of SVM, K-nearest neighbor, and linear regression.
In order to test the prediction effect of the model under different input data volumes, we test the prediction accuracy of SVM with the learning database of the BSI of 3, 4, and 5 months before 1 February. The result is shown in Figures 6 and 7.

Comparative analysis of different input data for ships staying in the Atlantic Ocean.
Comparative analysis of different input data for ships staying in the Pacific Ocean.
Figures 6 and 7 shows the prediction error obtained from different input database training data. The results are shown when using the data of the last 4 months before the decision date as the input database training data to predict, the accuracy is relatively good. This may be because the data of the first 3 months of input, the amount of data is relatively small which may affect the accuracy. And the data of the first 5 months be entered are too far from the predicted time node, which may brings the model interference. Therefore, the accuracy is not as good as the prediction of the data we chose for 4 months. With 4 months of data support, the input data choosing is more appropriate.
Conclusion
Dry bulk ship owners have many factors to consider when making fleet operation decisions. One of the most important aspects is to make choices about the ship’s operational area for the next planning period. In this article, based on the BSI index (please refer to Appendix 1) and historical decision data of different companies in similar environments, the SVM model is used to predict the dry bulk carrier route selection, which provides a solution to this problem. The typical character of dry bulk shipping market is fluctuation and randomness. Therefore, it is quite hard for ship owners to make decision how to assign their ships in future. With the combination of historical BSI data and other market player’s actions in the model, we can conclude some reference idea for ship owners. In similar basis similar BSI situation, the other shipowner’s actions is of great help to decision makers in choosing ship routes. SVM does not require function form, its generalization ability is very strong, and it can also well map the relationship between input and output of nonlinear or time-varying systems. This article also proves the good prediction results of the model. Therefore, using the SVM model to construct an effective route selection model can provide reference for the shipping company’s route selection. After determining the proportion of the fleet in each route, the number of ships in each oceanic area at the end of the planning period can be obtained as a basis for how to schedule the tasks of each ship.
Footnotes
Appendix

| BSI | S1A | S2 | S3 | S4A | TC Avg BSI | |
|---|---|---|---|---|---|---|
| 2014/8/1 | 728 | 10,356 | 8,025 | 6,792 | 8,822 | 7,608 |
| 2014/8/4 | 740 | 10,421 | 8,121 | 6,810 | 8,944 | 7,739 |
| 2014/8/5 | 753 | 10,529 | 8,164 | 6,840 | 9,144 | 7,878 |
| 2014/8/6 | 767 | 10,771 | 8,171 | 6,860 | 9,300 | 8,024 |
| 2014/8/7 | 785 | 11,107 | 8,189 | 6,905 | 9,531 | 8,208 |
| 2014/8/8 | 804 | 11,679 | 8,207 | 6,970 | 9,783 | 8,406 |
| 2014/8/11 | 819 | 11,964 | 8,236 | 7,030 | 10,028 | 8,564 |
| 2014/8/12 | 829 | 12,064 | 8,271 | 7,100 | 10,194 | 8,673 |
| 2014/8/13 | 845 | 12,286 | 8,321 | 7,140 | 10,394 | 8,839 |
| 2014/8/14 | 861 | 12,521 | 8,429 | 7,195 | 10,678 | 9,004 |
| 2014/8/15 | 877 | 12,621 | 8,557 | 7,270 | 11,244 | 9,170 |
| 2014/8/18 | 889 | 12,729 | 8,693 | 7,310 | 11,689 | 9,298 |
| 2014/8/19 | 902 | 12,986 | 8,793 | 7,330 | 11,978 | 9,432 |
| 2014/8/20 | 912 | 13,121 | 8,871 | 7,410 | 12,178 | 9,537 |
| 2014/8/21 | 925 | 13,236 | 9,000 | 7,480 | 12,350 | 9,674 |
| 2014/8/22 | 937 | 13,314 | 9,121 | 7,570 | 12,494 | 9,797 |
| 2014/8/26 | 944 | 13,357 | 9,193 | 7,570 | 12,756 | 9,871 |
| 2014/8/27 | 952 | 13,414 | 9,250 | 7,590 | 13,050 | 9,954 |
| 2014/8/28 | 963 | 13,486 | 9,371 | 7,640 | 13,328 | 10,068 |
| 2014/8/29 | 970 | 13,564 | 9,414 | 7,660 | 13,533 | 10,140 |
| 2014/9/1 | 977 | 13,625 | 9,482 | 7,690 | 13,706 | 10,220 |
| 2014/9/2 | 983 | 13,629 | 9,629 | 7,720 | 13,828 | 10,283 |
| 2014/9/3 | 988 | 13,629 | 9,696 | 7,735 | 13,973 | 10,328 |
| 2014/9/4 | 993 | 13,636 | 9,871 | 7,750 | 14,067 | 10,384 |
| 2014/9/5 | 997 | 13,621 | 9,933 | 7,785 | 14,258 | 10,425 |
| 2014/9/8 | 995 | 13,600 | 9,875 | 7,763 | 14,328 | 10,407 |
| 2014/9/9 | 1,001 | 13,579 | 9,921 | 7,820 | 14,648 | 10,468 |
| 2014/9/10 | 1,003 | 13,529 | 9,979 | 7,875 | 14,806 | 10,493 |
| 2014/9/11 | 1,000 | 13,457 | 9,961 | 7,830 | 14,983 | 10,457 |
| 2014/9/12 | 1,006 | 13,471 | 9,918 | 7,830 | 15,617 | 10,519 |
| 2014/9/15 | 1,016 | 13,736 | 9,954 | 7,900 | 16,106 | 10,627 |
| 2014/9/16 | 1,028 | 14,129 | 9,918 | 7,870 | 16,861 | 10,750 |
| 2014/9/17 | 1,031 | 14,379 | 9,814 | 7,790 | 17,439 | 10,785 |
| 2014/9/18 | 1,030 | 14,393 | 9,750 | 7,710 | 17,806 | 10,772 |
| 2014/9/19 | 1,029 | 14,400 | 9,671 | 7,620 | 18,300 | 10,764 |
| 2014/9/22 | 1,032 | 14,421 | 9,671 | 7,630 | 18,583 | 10,794 |
| 2014/9/23 | 1,041 | 15,036 | 9,658 | 7,619 | 18,783 | 10,886 |
| 2014/9/24 | 1,045 | 15,558 | 9,639 | 7,570 | 18,756 | 10,926 |
| 2014/9/25 | 1,046 | 15,743 | 9,600 | 7,510 | 18,783 | 10,935 |
| 2014/9/26 | 1,053 | 16,250 | 9,571 | 7,480 | 18,681 | 11,009 |
| 2014/9/29 | 1,054 | 16,458 | 9,543 | 7,450 | 18,619 | 11,016 |
| 2014/9/30 | 1,051 | 16,871 | 9,514 | 7,400 | 18,278 | 10,989 |
| 2014/10/1 | 1,045 | 17,364 | 9,483 | 7,350 | 17,567 | 10,928 |
| 2014/10/2 | 1,033 | 17,571 | 9,358 | 7,263 | 16,956 | 10,802 |
| 2014/10/3 | 1,028 | 17,857 | 9,300 | 7,200 | 16,456 | 10,745 |
| 2014/10/6 | 1,017 | 17,786 | 9,242 | 7,175 | 15,672 | 10,634 |
| 2014/10/7 | 1,007 | 17,793 | 9,208 | 7,150 | 14,839 | 10,527 |
| 2014/10/8 | 993 | 17,729 | 9,086 | 7,060 | 13,950 | 10,384 |
| 2014/10/9 | 980 | 17,571 | 8,993 | 6,980 | 13,394 | 10,250 |
| 2014/10/10 | 970 | 17,314 | 8,936 | 6,930 | 13,206 | 10,147 |
| 2014/10/13 | 959 | 17,036 | 8,800 | 6,969 | 13,078 | 10,030 |
| 2014/10/14 | 952 | 16,914 | 8,668 | 6,950 | 13,050 | 9,959 |
| 2014/10/15 | 944 | 16,693 | 8,600 | 6,880 | 12,989 | 9,873 |
| 2014/10/16 | 933 | 16,314 | 8,543 | 6,840 | 12,806 | 9,761 |
| 2014/10/17 | 923 | 16,050 | 8,464 | 6,790 | 12,644 | 9,651 |
| 2014/10/20 | 916 | 15,857 | 8,407 | 6,720 | 12,589 | 9,579 |
| 2014/10/21 | 911 | 15,771 | 8,357 | 6,690 | 12,556 | 9,529 |
| 2014/10/22 | 907 | 15,729 | 8,300 | 6,650 | 12,594 | 9,488 |
| 2014/10/23 | 906 | 15,621 | 8,236 | 6,630 | 12,667 | 9,471 |
| 2014/10/24 | 900 | 15,429 | 8,150 | 6,620 | 12,683 | 9,412 |
| 2014/10/27 | 899 | 15,129 | 8,107 | 6,730 | 12,700 | 9,404 |
| 2014/10/28 | 898 | 14,950 | 8,071 | 6,730 | 12,789 | 9,393 |
| 2014/10/29 | 896 | 14,650 | 8,068 | 6,740 | 12,861 | 9,366 |
| 2014/10/30 | 891 | 14,100 | 8,061 | 6,750 | 12,900 | 9,315 |
| 2014/10/31 | 892 | 13,964 | 8,074 | 6,782 | 12,944 | 9,326 |
| 2014/11/3 | 889 | 13,867 | 8,100 | 6,694 | 12,900 | 9,300 |
| 2014/11/4 | 888 | 13,779 | 8,100 | 6,685 | 12,900 | 9,286 |
| 2014/11/5 | 888 | 13,729 | 8,121 | 6,665 | 12,894 | 9,288 |
| 2014/11/6 | 886 | 13,571 | 8,193 | 6,720 | 12,622 | 9,269 |
| 2014/11/7 | 881 | 13,357 | 8,236 | 6,740 | 12,267 | 9,209 |
| 2014/11/10 | 879 | 13,329 | 8,250 | 6,745 | 12,122 | 9,190 |
| 2014/11/11 | 876 | 13,257 | 8,264 | 6,740 | 12,006 | 9,160 |
| 2014/11/12 | 873 | 13,221 | 8,257 | 6,739 | 11,906 | 9,131 |
| 2014/11/13 | 873 | 13,314 | 8,257 | 6,740 | 11,828 | 9,132 |
| 2014/11/14 | 875 | 13,307 | 8,329 | 6,760 | 11,772 | 9,149 |
| 2014/11/17 | 875 | 13,233 | 8,357 | 6,760 | 11,719 | 9,146 |
| 2014/11/18 | 881 | 13,233 | 8,357 | 6,750 | 12,281 | 9,216 |
| 2014/11/19 | 904 | 13,293 | 8,386 | 6,710 | 14,061 | 9,449 |
| 2014/11/20 | 926 | 13,379 | 8,489 | 6,885 | 15,272 | 9,687 |
| 2014/11/21 | 942 | 13,407 | 8,729 | 6,945 | 15,967 | 9,848 |
| 2014/11/24 | 956 | 13,536 | 8,967 | 7,081 | 16,367 | 9,992 |
| 2014/11/25 | 970 | 13,614 | 9,150 | 7,320 | 16,678 | 10,142 |
| 2014/11/26 | 980 | 13,607 | 9,379 | 7,460 | 16,889 | 10,246 |
| 2014/11/27 | 984 | 13,533 | 9,507 | 7,520 | 17,056 | 10,291 |
| 2014/11/28 | 986 | 13,500 | 9,571 | 7,560 | 17,138 | 10,310 |
| 2014/11/29 | 1,090 | 18,206 | 11,928 | 6,350 | 12,933 | 11,402 |
| 2014/11/30 | 1,068 | 17,975 | 11,528 | 6,200 | 12,661 | 11,167 |
| 2014/12/1 | 1,047 | 17,781 | 11,189 | 6,100 | 12,433 | 10,948 |
| 2014/12/2 | 1,025 | 17,550 | 10,706 | 6,033 | 12,056 | 10,716 |
| 2014/12/3 | 1,003 | 17,094 | 10,444 | 6,008 | 11,600 | 10,492 |
| 2014/12/4 | 982 | 16,656 | 10,150 | 5,950 | 11,167 | 10,270 |
| 2014/12/5 | 965 | 16,369 | 9,983 | 5,958 | 10,589 | 10,092 |
| 2014/12/6 | 949 | 16,043 | 9,794 | 5,942 | 10,206 | 9,925 |
| 2014/12/7 | 936 | 15,925 | 9,644 | 5,933 | 9,889 | 9,784 |
| 2014/12/8 | 927 | 15,800 | 9,578 | 5,933 | 9,683 | 9,696 |
| 2014/12/9 | 921 | 15,713 | 9,478 | 6,000 | 9,483 | 9,626 |
| 2014/12/10 | 916 | 15,625 | 9,436 | 6,050 | 9,294 | 9,576 |
| 2014/12/11 | 909 | 15,431 | 9,406 | 6,167 | 9,000 | 9,506 |
| 2014/12/12 | 908 | 15,463 | 9,363 | 6,233 | 8,889 | 9,496 |
| 2014/12/13 | 909 | 15,375 | 9,338 | 6,358 | 8,844 | 9,503 |
| 2014/12/14 | 911 | 15,388 | 9,381 | 6,483 | 8,778 | 9,527 |
| 2014/12/15 | 909 | 15,300 | 9,350 | 6,575 | 8,761 | 9,509 |
| 2014/12/16 | 912 | 15,338 | 9,388 | 6,658 | 8,750 | 9,531 |
| 2014/12/17 | 916 | 15,378 | 9,444 | 6,750 | 8,783 | 9,573 |
| 2014/12/18 | 922 | 15,413 | 9,524 | 6,835 | 8,983 | 9,638 |
| 2014/12/19 | 919 | 15,275 | 9,569 | 6,904 | 9,272 | 9,609 |
| 2014/12/20 | 915 | 15,150 | 9,557 | 6,930 | 9,519 | 9,572 |
| 2014/12/21 | 915 | 15,079 | 9,571 | 6,950 | 9,700 | 9,568 |
| 2014/12/22 | 917 | 14,906 | 9,743 | 7,010 | 9,844 | 9,589 |
| 2014/12/23 | 920 | 14,941 | 9,775 | 7,067 | 10,067 | 9,622 |
| 2014/12/24 | 918 | 14,669 | 9,763 | 7,046 | 10,317 | 9,596 |
| 2014/12/25 | 909 | 14,500 | 9,650 | 6,992 | 10,450 | 9,500 |
| 2014/12/26 | 905 | 14,375 | 9,650 | 6,983 | 10,600 | 9,468 |
| 2014/12/27 | 904 | 14,175 | 9,669 | 6,958 | 10,794 | 9,449 |
| 2014/12/28 | 904 | 14,044 | 9,694 | 6,992 | 10,856 | 9,448 |
| 2014/12/29 | 901 | 13,906 | 9,613 | 7,017 | 10,911 | 9,417 |
| 2014/12/30 | 899 | 13,825 | 9,559 | 7,000 | 11,019 | 9,395 |
| 2014/12/31 | 896 | 13,825 | 9,514 | 7,008 | 10,989 | 9,371 |
Handling Editor: Tao Feng
Declaration of conflicting interests
The author(s) declared no potential conflicts of interest with respect to the research, authorship, and/or publication of this article.
Funding
The author(s) disclosed receipt of the following financial support for the research, authorship, and/or publication of this article: This research was supported by 2018–2019 Liaoning Science and Technology Association Science and Technology Innovation Think Tank Project (LNKX2018-2019C22) and Liaoning Provincial Social Science Planning Fund Project (L18BGL026).