
Abstract
In order to understand the relationship between nozzle structure and spray field, the present paper conducts velocity-based parametric study on two types of dust suppression nozzles, focusing on the link among nozzle structure, velocity distribution, and the resulting spray field. The simulation investigation indicates that the increase of flow velocity mainly occurs in the convergence section and the outlet region of a nozzle, with its magnitude dictated by the convergence angle, ratio of inlet to outlet diameter, and the length–diameter ratio of the outlet. Based on the velocity distribution characteristic of axis direction and radial direction near different nozzles’ outlet, one can predict that fluid density is higher in the central axis region and lower in the boundary region in spray field with cylindrical outlet, which can form a “solid cone” shape and stable spray. In the case where the nozzle outlet has “dash” type, one can find that the spray field, which associated with this type of nozzle, is a fan-shaped, with the fluid density fluctuating up and down. The above hypothesis has been corroborated by the spray experiments which have been conducted here. The simulation results concerning the internal flow field in dust suppression nozzles can provide guidance over the nozzle design and the parametric optimization and are of great significance to enhance the atomization quality of spray field.
Keywords
Introduction
The spraying dust-settling is most widely used and it is the most effective dust control measure.1–3 Nozzle is a key component of the spray dust control system, and its atomization capability exerts a direct impact on the practical dust suppression effect. 4 Therefore, the investigation over the various factors affecting the atomization effect is of major importance to the enhancement of spray dust suppression efficiency.
Atomization quality is closed related to the nozzle’s structure and atomizing mechanism. T Charinpanitkul and W Tanthapanichakoon 5 investigate the atomization particle size distribution is associated with various nozzle types and it has corresponding impacts on fall dust rate. FN Kissell 6 shows the airborne capture performance of some common spray nozzle types at different pressures. Hollow-cone sprays are the best choice for practical mining applications because they have larger orifice nozzles and are less likely to clog. Based on the results of the experiment, one way to improve sprays is to raise the water pressure, which has also been confirmed in other studies.7,8 PF Wang and colleagues9,10 adopt the self-designed spray-based dust suppression experimental system to investigate the relationship between the nozzle outlet sizes commonly used in the subsurface and the atomization parameters, that is, spray cone angle, range, and droplet size distribution. M Rashad et al. 11 investigate the impact of the geometries associated with 12 different types of pressure swirl atomizers on the spray cone angle and sauter mean diameter (SMD). In those studies, experimental measurements are conducted to determine the spray field parameters of nozzles. However, these studies lack research concerning the correlation between nozzle’s internal structure and the spray field, which makes it difficult to predict the spray characteristics based on the geometric design of a nozzle. This issue constitutes a major bottleneck plaguing the nozzle design.
In the fuel nozzle research, it is a common practice to employ the numerical simulation techniques so as to study the internal flow fields associate with various nozzle structures, based on which the impact of nozzle structure on the liquid atomization effect can be investigated. JL York et al. 12 indicate that the study of liquid flow within the nozzle is critical for understanding the droplet atomization mechanism. H Mohammadi et al., 13 C Qin and E Loth, 14 and L Wang et al. 15 use numerical simulation as a useful means to guide the modification of nozzle shape parameters, with an effort to optimize the atomization effect. It should be noted that velocity is an important parameter to consider during the simulation of internal flow field. Therefore, A Movaghar et al., 16 JJ López et al., 17 and FJ Salvador et al. 18 all lay particular emphasis on the three-dimensional (3D) velocity streamline of nozzle’s internal flow field as well as the velocity vector at the outlet. As a result, the impact of radial and axial velocity components on the final atomization quality is studied. Following the aforementioned rationale, the present paper, from the standpoint of designing and optimizing the dust control nozzle, uses the numerical simulation software COMSOL to model the internal flow characteristics and the outlet velocity distribution pattern associated with various nozzle structures. The numerical results obtained from the study, combined with the spray experiments conducted here, explains from the microscopic perspective how the nozzle structure affects the spray field. This helps to improve the theory concerning the nozzle atomization mechanism and lays a solid foundation for the ensuing optimization of nozzle structure.
Computational fluid dynamics simulation inside nozzles
Mathematical modeling
The spray field is deemed as an intense turbulent flow field, and therefore, it is needed to employ the
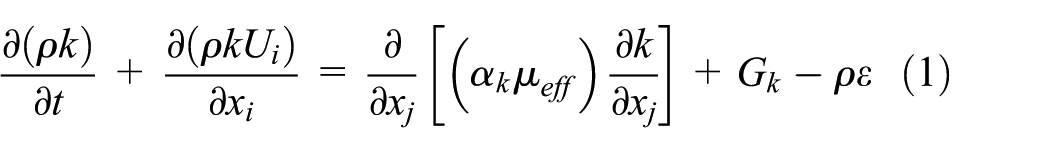

In the above equations,
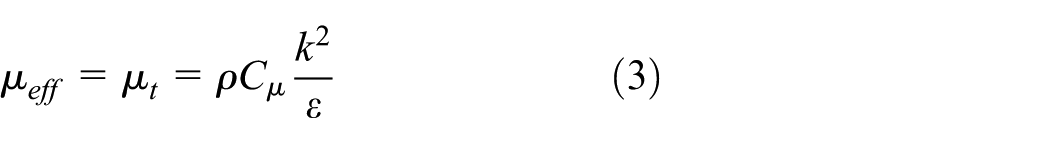
where
The additional term is the main difference between the RNG model and the standard

Here
Physical model and boundary conditions
Physical model
Different operational environments demand different nozzle types. Based on the onsite investigation, the present paper selects two types of commonly used direct jet nozzles to conduct comparative analysis and uses the SolidWorks software to depict the internal structure of the nozzle, as shown in Figure 1.

Simplified schemes of design configurations of the nozzles: type A and type B.
Type A consists of a cylindrical inlet section, a convergence section, and a cylindrical outlet section, while Type B consists of a cylindrical inlet section, a convergence section, and a cylindrical section with a “dash” typed outlet. Table 1 summarizes all the relevant parameters involved here.
Some parameters in the constructed physical model of type A and type B.

Boundary conditions
To simplify the calculation and reduce simulation overhead, the nozzle internal structure is split into two equal halves along its central axis, and only half of the domain is considered. According to the actual conditions of nozzles, the basic boundary conditions were set as follows: boundary type of the front face was set as pressure inlet and the end face of the tunnel was defined as pressure outlet. In addition, the standard atmospheric pressure was set, which was consistent with the operating pressure. And then, the empirical values of the turbulent intensity at the pressure inlet were calculated according to equation (5), and these results were then served as the initial values of the solution. Standard wall function boundary was selected for the walls of nozzle. Since the normal velocity had a very large gradient near the wall surface and the flow field variations in this region were simulated using wall function method, the size of the first-layer mesh should be strictly controlled within the range of 300 < y+< 300. The main parameters required in the solving process are listed in Table 2. The simulation was performed using COMSOL under the following assumptions: (1) the fluid was incompressible, (2) the temperature field remained constant, and (3) the flow in the domain was fully turbulent. Turbulence intensity can be calculated by

where
Major parameters in numerical simulations.
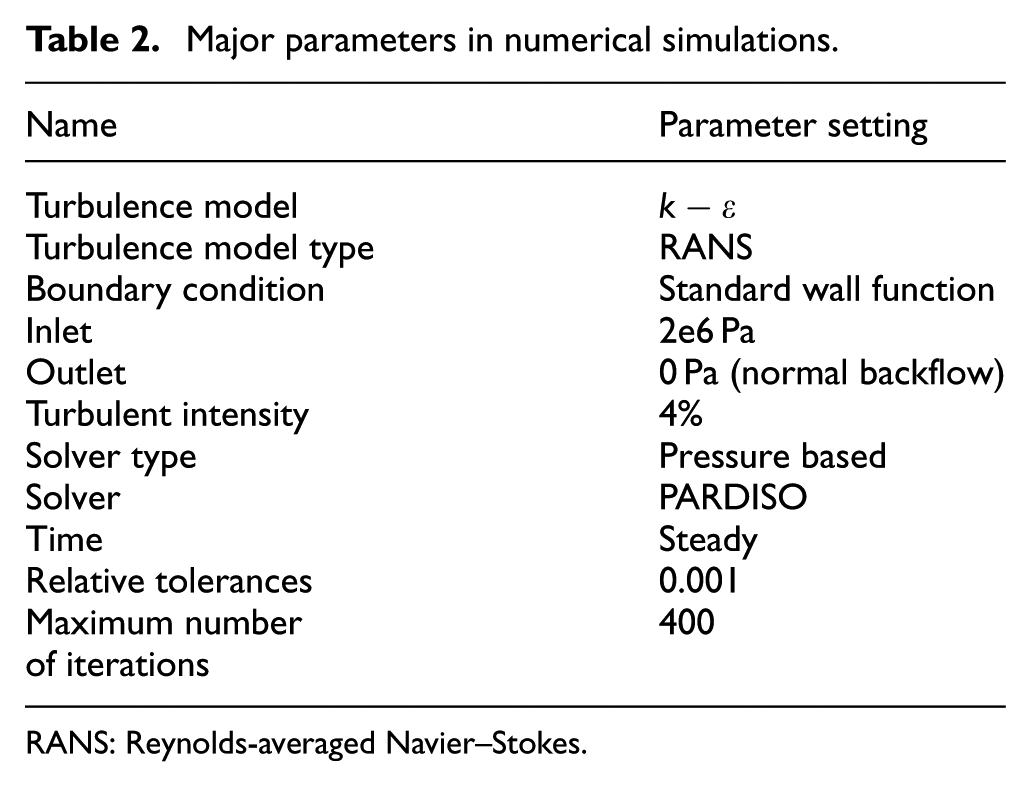
RANS: Reynolds-averaged Navier–Stokes.
Mesh independence study
Mesh generation is a critical preprocessing step before any numerical calculations, which can affect the accuracy of calculation results directly. Therefore, it is necessary to conduct mesh independence study so as to ensure that both the discrete and round-off errors are within acceptable ranges and the used meshes would not significantly affect the simulation results. Several types of meshes such as tetrahedrons, hexahedrons, triangular prism are used in COMSOL 3D meshing. 26 In this study, inner flow field of the nozzles displayed bending surface, which easily causes poor quality meshes. Thus, corner refinement and boundary layers were selected to optimize the mesh. Specifically, the outlet and the convergence angle zone used corner refinement, and boundary layers set between the inlet and convergence angle zone, and the remainder of the computational domain is meshed based on swept (quadrilateral). In order to check mesh dependency, the different types of meshes with minimum element size of 0.00672 mm (extra fine), 0.0179 mm (coarser), 0.0448 mm (coarse), 0.0896 mm (normal), 0.134 mm (fine), and 0.179 mm (finer) were generated, namely, M-1, M-2, M-3, M-4, and M-5. The numerical simulation results show that the outlet velocity of M-1, M-2, and M-3 did not show significant differences, while the outlet velocity error along the nozzle axis between M-4, M-5, and M-3 was greater than 15%. Therefore, using M-3, the simulation period can be shortened effectively, and simultaneously, small calculation errors of the flow field can be guaranteed. The fully meshed model is shown in Figure 2.

The mesh generation results: type A and type B.
Results and discussion
Characteristics of velocity distribution inside nozzle
Based on the aforementioned condition, the internal velocity distribution contours and the corresponding slice views associated with two types of nozzles under 2e6 Pa are obtained and shown in Figure 3. It can be found that the water velocity does not change its magnitude significantly within the straight section of the nozzle. However, the velocity undergoes dramatic change as the water flows from the straight section to the convergence angle section, and therefore, the current discussion is focused on this region.

Velocity distribution inside nozzle with 2e6 Pa inlet pressure: (a) contour of type A internal flow field velocity, (b) slice view of type A internal flow field velocity, (c) contour of type B internal flow field velocity, and (d) slice view of nozzle type B internal flow field velocity.
Under 2e6 Pa inlet pressure, the flow velocities in both nozzles vary greatly and peak at the outlet. The increase of water velocity is greater near the central axis than near the boundary layer, as shown in Figure 3(a) and (c). At the outlet, the near-wall velocity is smaller than the near-axis velocity. This finding is consistent with the observations reported by Q Dong et al. 27 and X Leng et al. 28 concerning the internal flow field associated with a V-typed nozzle in diesel engine. Depending on the nozzle shape, the outflow can assume a bulge shape (Figure 3(b)) or a fan shape (Figure 3(d)). Moreover, the nozzle structure also affects the internal velocity variation. For type A, the velocity distribution in the cylindrical section of inlet is uniform, with an average velocity being 4.5 m/s. The velocity component perpendicular to the nozzle axis is insignificant. As the fluid enters the convergence angle zone, the velocity increases progressively and eventually peaks at the outlet of the convergence angle zone. Therefore, the increase of velocity in the type A mainly occurs inside the convergence angle zone. On the other hand, the average velocity in the cylindrical section of type B is only 0.65 m/s. Even as the fluid goes through the convergence angle zone, the average is merely 3.7 m/s, being much less than that of the type A. Starting from 1.5 mm upstream of the outlet, the velocity begins to increase. As the fluid passes through the “dash” typed outlet, the velocity increases abruptly. Therefore, the velocity variation is limited in the type B, and the velocity increase mainly occurs at the “dash” typed outlet downstream of the convergence section.
Characteristics of 3D velocity field distribution at nozzle outlet
Figures 4 and 5 depict the contours and Gaussian graphs of spray velocity distribution at two types of nozzle outlets, respectively. The magnitude of axial velocity (z-component) exhibits a clear pattern: In the type A, the velocity increases toward the central axis. In the type B, the velocity remains constant everywhere, which is in line with the description in section “Characteristics of velocity distribution inside nozzle.” The x- and y-components constitute the velocity distribution in the semi-circular plane at the outlet. It is evident that the radial velocities (x- and y-components) associated with the two nozzle types are smaller than the axial velocities. This is particularly true for the type A, in which the maximum velocity magnitude is only 1.5 m/s. Driven by the variation in nozzle structure, the velocity distributions in the two nozzles differ as well. The x- and y-components of velocity in type A both exhibit a “lower at center, higher on side(s)” pattern. The difference between these two velocity components lies in the fact that the x-component is high near the wall on both sides and small near the central axis. By contrast, the y-component is high at the central axis as well as near the nozzle wall on one side, and small in the transition region. In the type B, the variation of velocity magnitude differs significantly between x- and y-components. Specifically, the x-component follows a parabolic pattern, that is, the velocity peaks on both sides and decreases toward the central axis. By contrast, the y-component is non-zero only in the near-wall region and decays to zero in the other areas inside the nozzle.

3D velocity field distribution at outlet of type A: (a) radial velocity (x-component), (b) radial velocity (y-component), and (c) axial velocity (z-component).

3D velocity field distribution at outlet of type B: (a) radial velocity (x-component), (b) radial velocity (y-component), and (c) axial velocity (z-component).
In order to visualize the velocity distribution pattern within the xz plane in a more straightforward manner, the velocity vector plot (2e6 Pa) is shown in Figure 6. The arrows in the plot indicate the local velocity direction within the plane, and the arrow thickness denotes the velocity magnitude. A comparison between two nozzles clearly indicates that noticeable velocity component exists within the cross-section of type A outlet. However, high magnitude of velocity only exists near the nozzle wall on one side as well as the vicinity of central axis. In the case of type B, the velocity within the xy plane mainly exists linearly at outlet, and the magnitude of velocity is evenly distributed. The aforementioned difference between type A and type B can be readily explained by the nozzle outlet type.

Vector plots of velocity field in xz plane at nozzle outlet.
Analysis and verification the impact of nozzle structure on atomization
Relationship between nozzle structure and atomization
The efficiency of dust suppression is strongly related to the atomization effect of the nozzle. The nozzles geared toward different types of working environment and applications pose distinct requirements to the atomization characteristics of spray field.29,30 Therefore, it is necessary to master the atomization characteristics of the nozzle through the nozzle structure. The velocity serves as a key parameter linking the nozzle structure and the spray field. Sections “Characteristics of velocity distribution inside nozzle” and “Characteristics of 3D velocity field distribution at nozzle outlet” have presented a detailed description regarding the effect of nozzle structure on internal flow and outlet velocity distribution. This section attempts to use velocity characteristics to predict the spray field, with an effort to establish relationship among nozzle structure, velocity, and spray field. By leveraging the axisymmetry of the nozzle, one can build a simplified nozzle model, as shown in Figure 7, in which line a–b denotes the main axis of the nozzle, and line c–d denotes the boundary of nozzle outlet. The remainder of this section will employ this simplified model to discuss the overall velocity variation along axial direction (line a–b) and radial direction (line c–d), as shown in Figures 8 and 9.

Simplified model of a straight nozzle.

Total jet flow velocity variation along nozzle axis (a–b).

Total jet flow velocity variation along radial direction (c–d).
It can be seen in Figure 8 that the velocity along axial direction of type A undergoes a series of stages, including abruptly increasing, peaking, falling back gradually, and reaching a plateau. The outlet velocity eventually stabilizes at 65 m/s. The axial velocity of type B also undergoes multiple stages, including gradually increasing, stabilizing, and abruptly increasing. The velocity can eventually reach 45 m/s.
Figure 9 shows that velocity distribution along line d–c in type A assumes a parabolic shape, with the minimal velocity being 40 m/s and the velocity at the central axis stabilizing at 64 m/s. By contrast, the radial velocity along d–c in type B exhibits a moderate variation between 40 and 50 m/s.
Combining Figures 8 and 9, when water flows through type A, outlet region velocity is stable and the velocity near the outlet center is larger. It can be inferred that the spray field looks like cone and should be stable. When water flows through type B, outlet region is unstable but “dash” outlet has little difference in velocity value. It can be inferred that the spray field looks like conical cone and should be unstable. In addition, since the velocity of the type A is much larger than that of type B, it can be inferred that the range of type A should be longer than that of type B.
Validation of simulation results
In order to verify the prediction in this article, the atomization of the nozzle was obtained using the experiment device of Figure 10 in the laboratory. A high-speed camera is used to qualitatively record the still images of spray flow at the nozzle outlet. The model of the high-speed camera is Phantom V650, whose filming speed is 4000 frames per second. The experimental system also consists of a water tank, a high-pressure piston plunger pump, a SGC dual-function high-pressure gauge, and a nozzle; the experiment results are shown in Figure 11.
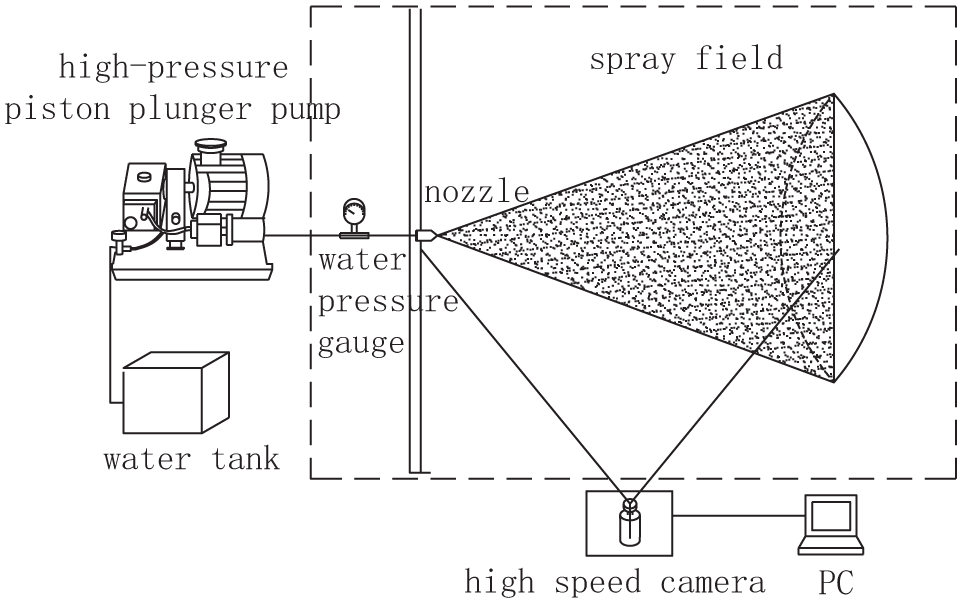
Apparatus of spray experiment.

Pictures of spray fields associated with (a) type A and (b) type B.
From Figure 11, it can be clearly found that the shape of type A spray field is a solid cone, which has uniformly distributed. It is proved that the quality of atomization is good. However, type B spray field shows worse atomization since its uneven distribution. The range of types A and B measured by the meter gauge is 3 and 2.3 m, respectively. It can be seen that type A has a farther range than type B. The above results are consistent with the simulation results. It can be seen that the outlet velocity has a great influence on atomization characteristic of nozzle and range. In addition, the stability of velocity also has important significance for the atomization.
The significance of velocity distribution characteristics on guiding dust suppression nozzle design
The analysis above indicates that the velocity affects the full spectrum of parameters associated with spray field. Specifically, the magnitude of velocity affects the extent to which the spray field’s atomization develops, and the direction of velocity is tightly related to the shape of the spray field. The theory proposed here is highly consistent with the research outcome reported by JJ López et al. 17 When it comes to the use of dust suppression nozzles, most previous studies attempt to modify the nozzle parameters so as to enhance the spray performance. For instance, F Han et al. 31 leverage the control over the gas liquid ratio at the inlet of an arc jet nozzle to obtain sufficient amount of foam so as to enhance the efficiency of foam-based dust control. L Cheng 32 proposes to enhance the outlet velocity by raising the water pressure, so as to generate fine water droplets for capturing the respirable dust. Their research indicates that the dust suppression efficiency is predominantly affected by multitude of factors, including the spray droplet distribution, the relative velocity between spray droplets and coal dust, the coverage area of spray field, and so on. Those factors can all be linked together based on the established relationship among nozzle, velocity, and spray field. From the perspective of nozzle design, it can be found by comparing the nozzle structure with spray field that in order to increase outlet velocity, one needs to adjust convergence angle as well as pay close attention to the diameter ratio of outlet/inlet or compare the length–diameter ratio between cavity and the outlet section rather than simply decreasing the outlet diameter. To alter the spray field distribution, one needs to focus on the outlet type and the corresponding parameters. The study clearly shows that for type A with a round outlet, the atomization cone angle is very small, and it takes to establish a stable spray field. When it comes to optimizing the type B with a slot-shaped linear outlet, one should fine tune the outlet parameters so as to enhance the uniformity of the resulting spray field. In the ensuing study, we plan to further optimize the nozzle structure based on the rationale above. This exercise, while combined with the understanding of coal dust transport in the coal mine, will allow us to finally improve the dust suppression efficiency.
Conclusion
The present study establishes the relationship between nozzle structure, velocity, and atomization. The internal flow fields and outlet velocity characteristics of type A nozzle and type B nozzle are analyzed by COMSOL simulation. According to the velocity characteristics, the atomization characteristics of nozzles are predicted. Specifically, the spray field of type A assumes a “solid cone” shape, whose droplet density is high in the central area. By contrast, the spray field of type B assumes a “fan” shape, with the droplet density fluctuating from the peripheral region toward the central region. The range of type A is farther than that of type B, and the spray field of type A is more uniform and stable, which is verified by spray experiments. The above results also show that the outlet velocity has a great influence on the atomization and range, and the stability of outlet velocity is also important for atomization characteristics. From the perspective of the nozzle design, the improvement of outlet velocity demands a comprehensive consideration of parameters including convergence angle, ratio of inlet to outlet diameter, and length–diameter ratio of the outlet. In order to improve the outlet velocity distribution, the outlet type and parameters should be adjusted. This constitutes the focus of our future effort for nozzle optimization.
Footnotes
Handling Editor: Davood Younesian
Declaration of conflicting interests
The author(s) declared no potential conflicts of interest with respect to the research, authorship, and/or publication of this article.
Funding
The author(s) disclosed receipt of the following financial support for the research, authorship, and/or publication of this article: This work was financially supported by China 13th Five-Year Key R&D Plan (2016YFC0801700, 2017YF C0805200, 2017YFC0805207), National Natural Science Foundation of China (grant no. 51474139), and China Statistical Research Program (grant no. 2012LY108).