
Abstract
This article presents a novel method for estimating normals on unorganized point clouds that preserves sharp features. Many existing methods are unable to reliably estimate normals for points around sharp features since the neighborhood employed for the normal estimation would enclose points belonging to different surface patches across the sharp feature. To address this challenging issue, a neighborhood reconstruction-based normal estimation method is developed to find a proper neighborhood for points around sharp features. A robust statistics-based method is proposed to identify points that near sharp features and classify the points into two categories: edge points and non-edge points. Two specific neighborhood reconstruction strategies are designed for these two types of points to generate a neighborhood clear of sharp features. The normal of the current point can thus be reliably estimated by principal component analysis using the generated isotropic neighborhood. Numerous case studies have been carried out to compare the reliability and robustness of the proposed method against various existing methods. The experiment results show that the proposed approach performs better than the state-of-the-art methods most of the time and offers an ideal compromise between precision, speed, and robustness.
Introduction
Reliable estimation of the normals of point clouds is a crucial preprocessing operation. Numerous point clouds processing algorithms benefit from an accurate normal associated with each point. For example, many surface reconstruction algorithms require accurate normals as input in order to generate high-quality surfaces.1,2 The performance of point-based rendering techniques is heavily depends on the accuracy of the input normal.3,4 Many other applications of normal estimation can also be found in segmentation, 5 smoothing, 6 simplification,7,8 shape modeling, 9 and feature detection and extraction.10,11
The points acquired by three-dimensional scanners are inevitably defect-ridden due to the precision limitation of scanning equipment and artifact in the scene. A good estimator should be robust to these defects, including noise, outliers, non-uniformities, and so on. Moreover, many captured scenes include human-made objects, which generally contain sharp features that have to be preserved and not smoothed.
Regression-based normal estimation methods12–15 are most commonly employed. The methods estimate normal with the whole neighborhood centered at the point, which tend to smooth sharp features. Some robust statistics approaches16–18 have been brought out to estimate consistent sub-neighborhoods to compute normals for feature preserving. However, some erroneous normals may still persist near the sharp features with anisotropic sampling or large dihedral angels. In recent years, segmentation-based approaches19,20 are proposed to segment the anisotropic neighborhood into several isotropic sub-neighborhoods and select a consistent sub-neighborhood to estimate normals. The methods generate more faithful normals than previous methods but at the price of a long runtime.
In this article, a neighborhood reconstruction-based method is presented to estimate normals for unorganized point clouds with sharp features. Instead of using the whole neighborhood centering at the current point, the proposed method tries to locate a neighborhood containing the current point but clear of sharp features, which is usually not centering at the point. And the located neighborhood is then used for more faithful normal estimation. To this end, the points are first classified into edge points and non-edge points through robust statistics-based method. Then a neighborhood segmentation-based and a neighborhood growth-based method are proposed for edge points and non-edge points, respectively, to construct a neighborhood containing the current point but clear of sharp features. Finally, the normal can be accurately estimated by principal component analysis (PCA) using the constructed isotropic neighborhood. The experiments illustrate that the presented method can estimate normals accurately even in the presence of noise and anisotropic samplings, while preserving sharp features. The contributions of this article can be summarized as follows:
A robust statistics–based recognition method is proposed to identify points that near sharp features. The proposed method can accurately identify points near sharp features even in the presence of high level noise.
A specific strategy is devised to generate a set of isotropic candidate neighborhoods for each edge point, which makes the presented method effective.
A neighborhood growth strategy is proposed for each non-edge point to generate a neighborhood clear of edge points, which improves the reliability of normal estimation for non-edge point.
Related works
There has been a considerable amount of works on normal estimation which can be categorized into four types: regression based, mollification based, Delaunay/Voronoi based, and segmentation based. Regression-based methods are most widely employed. Hoppe et al. 12 (PCA) approximate a tangent plane at a given point by regression on its neighboring points. The normal of the point is defined as the eigenvector corresponding to the smallest eigenvalue of the covariance matrix of its neighbors. To better adapt to the shape of the underlying surface, some higher order algebraic surfaces such as spheres 13 and quadrics 14 are used to replace planes. Optimal neighborhood sizes can be computed to minimize the estimation error by analyzing local properties, such as curvature, noise, sampling density. 15 However, all regression-based methods are actually low-pass filters and tend to smooth the normals at sharp features. Moreover, a higher robustness to outliers needs larger neighborhoods, which makes sharp features even smoother.
To improve the robustness to outliers and non-uniformity, Pauly et al. 10 weaken some points’ influence to the regression by assigning Gaussian weights to the distances between current point and its neighbors when estimating the local plane. The method improves the robustness of normal estimation to outliers and non-uniformity. Khaloo and Lattanzi 21 propose an improved Mahalanobis distance–based outliers detection method to find and discard outlier points prior to estimating the best local tangent plane around any point in a cloud. However, in Pauly et al. 10 and Khaloo and Lattanzi, 21 the neighborhood used to estimate the local plane still contains neighboring points from different surface patches than the patch current point belongs to when current point is very close to sharp features. Nurunnabi et al. 22 estimate the best-fit-plane based on most probable outlier free, and most consistent, points set in a local neighborhood. The normal can thus be reliably estimated from the best-fit-plane. However, the method is computationally expensive and fails in detecting outliers in the presence of additive Gaussian noise. 23 Huang et al. 24 present an interesting resample-wPCA-based method in which an edge-aware resampling algorithm is used to generate denoised, outlier free and evenly distributed points. Then a sophisticated approach is employed to get reliable orientation for the normals computed by weighted PCA. The method is robust to noise and outliers. However, the output of this method is a new consolidated point cloud; thus, the normals corresponding to the original points are not computed. Li et al. 16 (RNE) propose a robust normal estimation method by combining a robust local noise estimation and a kernel density estimation that is parameterized by the estimated noise scale. The method generates accurate normals near sharp features and is robust to the noise and outliers. Boulch and Marlet 25 (Hough transform (HF)) propose a uniform sampling technique to overcome the sampling non-uniformity. The method is based on the randomized Hough transform (RHT). The filled HF accumulator is viewed as an image of the discrete probability distribution of possible normal and the normal corresponds to the maximum of this distribution is selected. However, the normal will be blurred near the edge when the dihedral angle between the two planes is large. Instead of designing explicit criteria to select a normal from the accumulator, he then comes up with a decision procedure base on convolutional neural network (CNN). 26 The method is robust to noise, to outliers, and to density variation, in the presence of sharp edges. However, it is expensive to change the value of a parameter; the network has to be retrained when it needs to adapt specifically to the input data.
Since the preliminary normals are likely to be noisy or smoothed, normal mollification methods are studied to improve the initial normals. Algorithms such as moving least squares (MLS), 3 adaptive versions 9 locally approximate the surface with implicit surface. The normal is estimated as the gradient of the surface. Better normal can be obtained due to the good approximation ability of implicit surfaces. However, the surface approximations performed in a least square sense are sensitive to outliers, and still smooth out small or sharp features. To deal with this problem, Öztireli et al. 1 proposed a robust implicit moving least squares (RIMLS) algorithms which combine robust local kernel regression (LKR) techniques with implicit moving least squares (IMLS). Combining with statistics makes IMLS more robust in the presence of noise, outliers, and sparse sampling. Taking into account both positions and preliminary normals of the points, half-quadratic regularization 27 improves normals by selecting the nearest neighbors belonging to the same plane as current point. Bilateral filtering proposed by Jones et al. 28 also recovers sharp features while improve noisy normals. Normal mollification methods can obtain nearly correct normals for the points close to sharp features. However, as post-processing methods, all of them require reliable initial normal which at least roughly respecting sharp features. Otherwise, the mollification can only smooth noisy normals but is incapable to preserve sharp features.
Voronoi/Delaunay-based method is first introduced into normal estimation by Amenta and Bern. 29 The Voronoi diagram and the furthest vertex of the Voronoi cell are used to approximate the normals. The method preserves sharp features and can deal with density variation, but it works only for the noise-free point clouds. Dey and Goswami 30 extend the idea to noisy point clouds by finding big Delaunay balls. Also based on the Voronoi diagram, OuYang and Feng 31 construct a local Voronoi mesh at each point and estimate the normal via fitting a group of quadric curves through which the directional tangent vectors could be obtained. The method also needs a noise-free point cloud though. In order to be robust to noise, Alliez et al. 32 present a combination of PCA and Voronoi-based method that compute the covariance matrix of a Voronoi cell or a union of Voronoi cells in the noisy case. The method benefits from the local nature of PCA and the global partition quality of Voronoi-based approach, more stable normals can thus be obtained.
Recently, some neighborhood segmentation-based methods are proposed to determine consistent point clusters for a better normal estimation near sharp features. Fleishman et al. 17 segment the local neighborhood of a point into multiple outlier-free smooth regions. Zhang et al. 19 (low-rank representation (LRR)) segment the local neighborhood of a point into such clusters using low-rank subspace clustering with prior knowledge. The method yields accurate normal, even in the presence of noise and anisotropic samplings. However, the algorithm is too slow to employ it in practice, since it requires to solve a non-smooth optimization problem for each point near the sharp features. Liu et al. 20 address this issue using a different representation for subspaces and clustering only a subset of the points before propagating the results to adjacent points. The method is much faster while being as accurate as Zhang et al.’s method. 19 But it can be seen from the experimental comparison of the article, its computational efficiency is still lower than other classical algorithms. Cao et al. 33 presented a fast and quality normal estimator based on neighborhood shift. Instead of using the neighborhood centering at the current point, a set of neighborhoods containing the current point are evaluated and the one with the most consistent normals is selected as the neighborhood of the current point. Two specific neighborhood shift operations to build faithful neighborhoods for points near different types of features are introduced. The method is robust to noise, to outliers, to non-uniform sampling, performed well near the edge, but to evaluating all candidate neighborhoods of a point with very large neighborhood may be impractical. Hence, the method may be not robust to large noise and some extreme cases when only small neighborhoods are explored.
Overview
Assuming that the point cloud
If
If
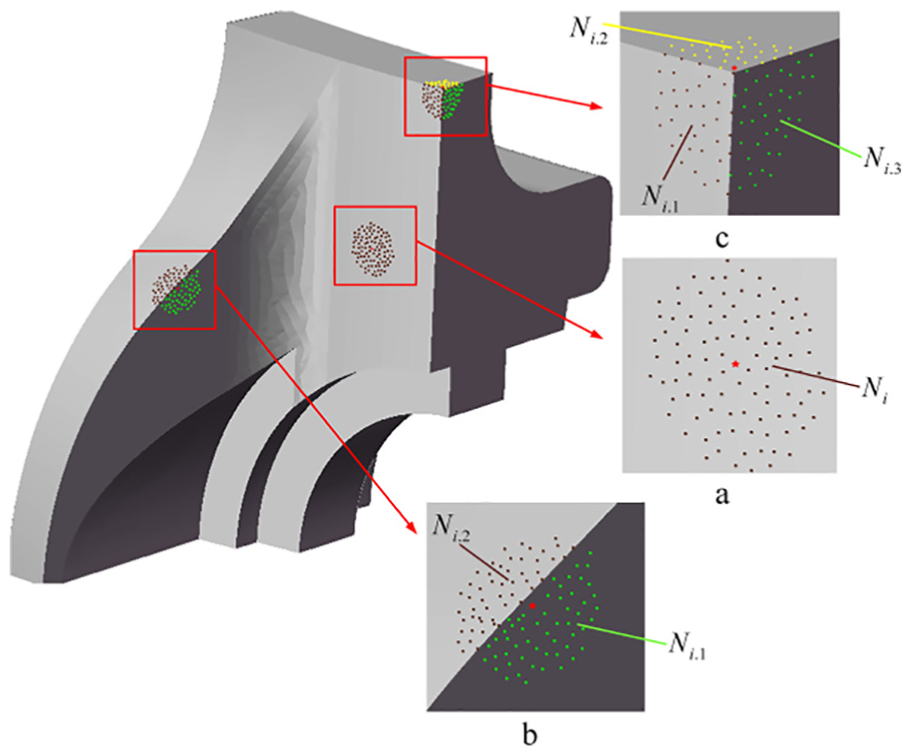
The structure of the neighborhood of points at different positions: (a) Point pi lies far from any edge or sharp feature, (b) Point pi lies near an edge and (c) Point pi lies near a corner where several surface patches join together.
Based on this simple principle, this article presents an effective algorithm to identify a consistent neighborhood for each point near sharp features. Then, accurate normal can be estimated with the identified neighborhood. The algorithm consists of five phases: (1) for each point

Pipeline of our algorithm.
Edge point recognition
PCA of the covariance matrix of a local neighborhood is widely used to estimate local surface properties, such as normal and curvature.
7
For each point

where
The eigenvalues

where
Assume that

The normal
In previous studies,19,20,33
However, it has been shown that PCA is sensitive to noise and outliers due to using classic covariance matrix. As a result, attributes calculated through PCA are highly sensitive to noise and outliers.
34
Figure 3 shows the results of edge point identification under different noise levels using above curvature-based method. For each point cloud and noise level, the curvature threshold
Edge points detection using curvature-based method. Points in red color are identified edge points, and non-edge points are shown in green points. From left to right, they are Fandisk, Revolved part, and Anchor.
To improve the accuracy and robustness of edge point recognition, a statistics-based edge point recognition strategy is proposed in this article. For each point

where

Similar to
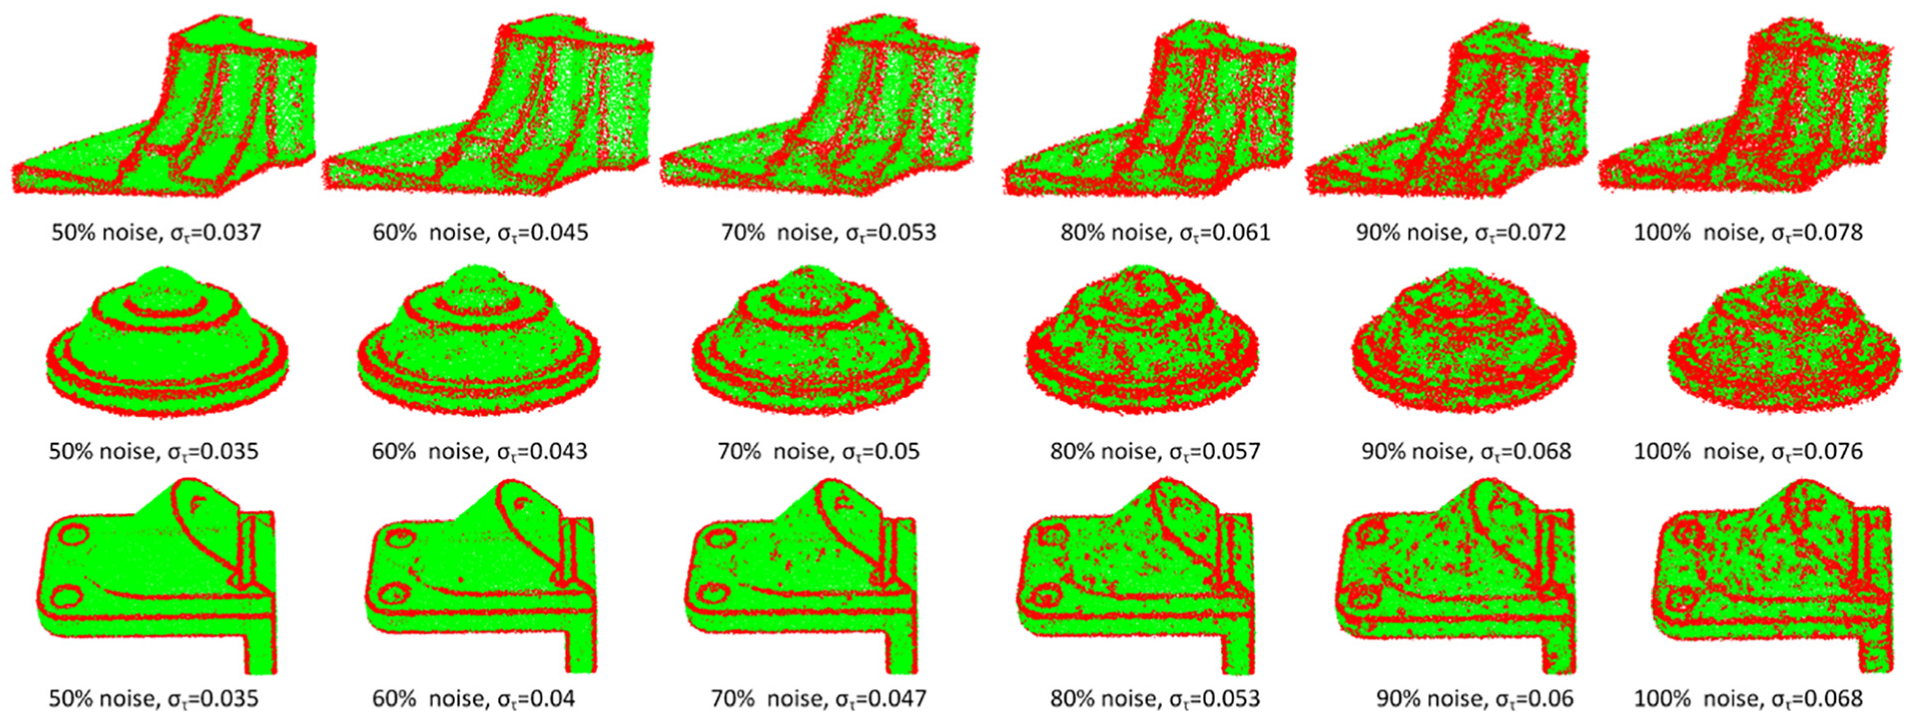
Figure 4 shows the result of our edge point identification algorithm. The standard deviation tolerance

Edge points detection using statistics-based method. Points in red color are identified edge points, and non-edge points are shown in green points. From left to right, they are Fandisk, Revolved part, and Anchor.
The normal standard deviation threshold
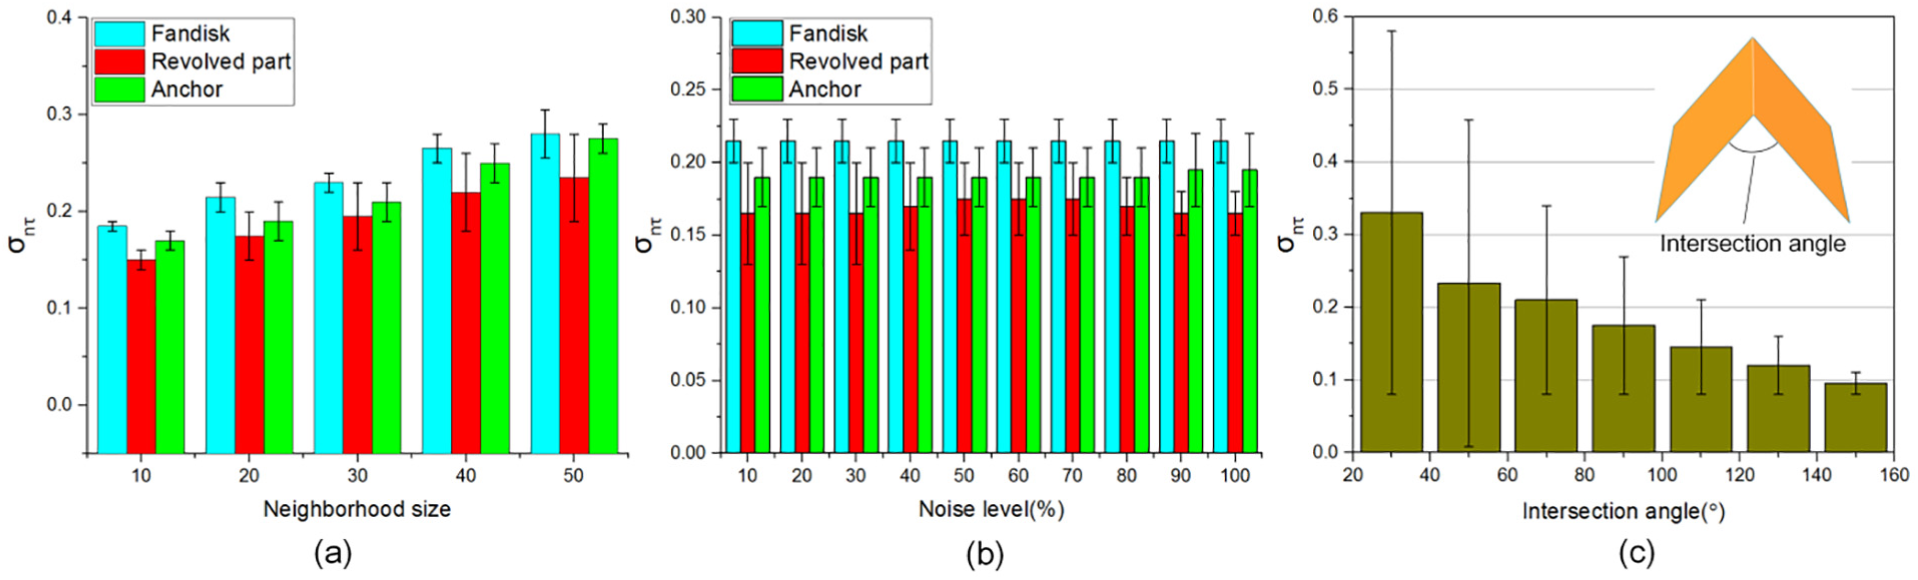
The effect of (a) neighborhood size, (b) noise level, and (c) the level of sharpness on the threshold selection.
Neighborhood reconstruction
Neighborhood segmentation
For an edge point
Pipeline of the neighborhood segmentation and construction algorithm: (a) Initial neighborhood of
For this purpose, a neighborhood segmentation method is proposed to segment
The key to neighborhood segmentation is the selection of distance threshold t used in Euclidean distance clustering. An inappropriate distance threshold may lead to over segmentation or under segmentation, which would negatively impact the accuracy of normal estimation. The distance threshold usually changes with the density variation in the point cloud model or between models. To improve the algorithm’s performance and practicability, an adaptive distance threshold is essential. To this end, a sample distance threshold determination procedure is introduced. First, after all the edge points are removed from
The relationship between t and
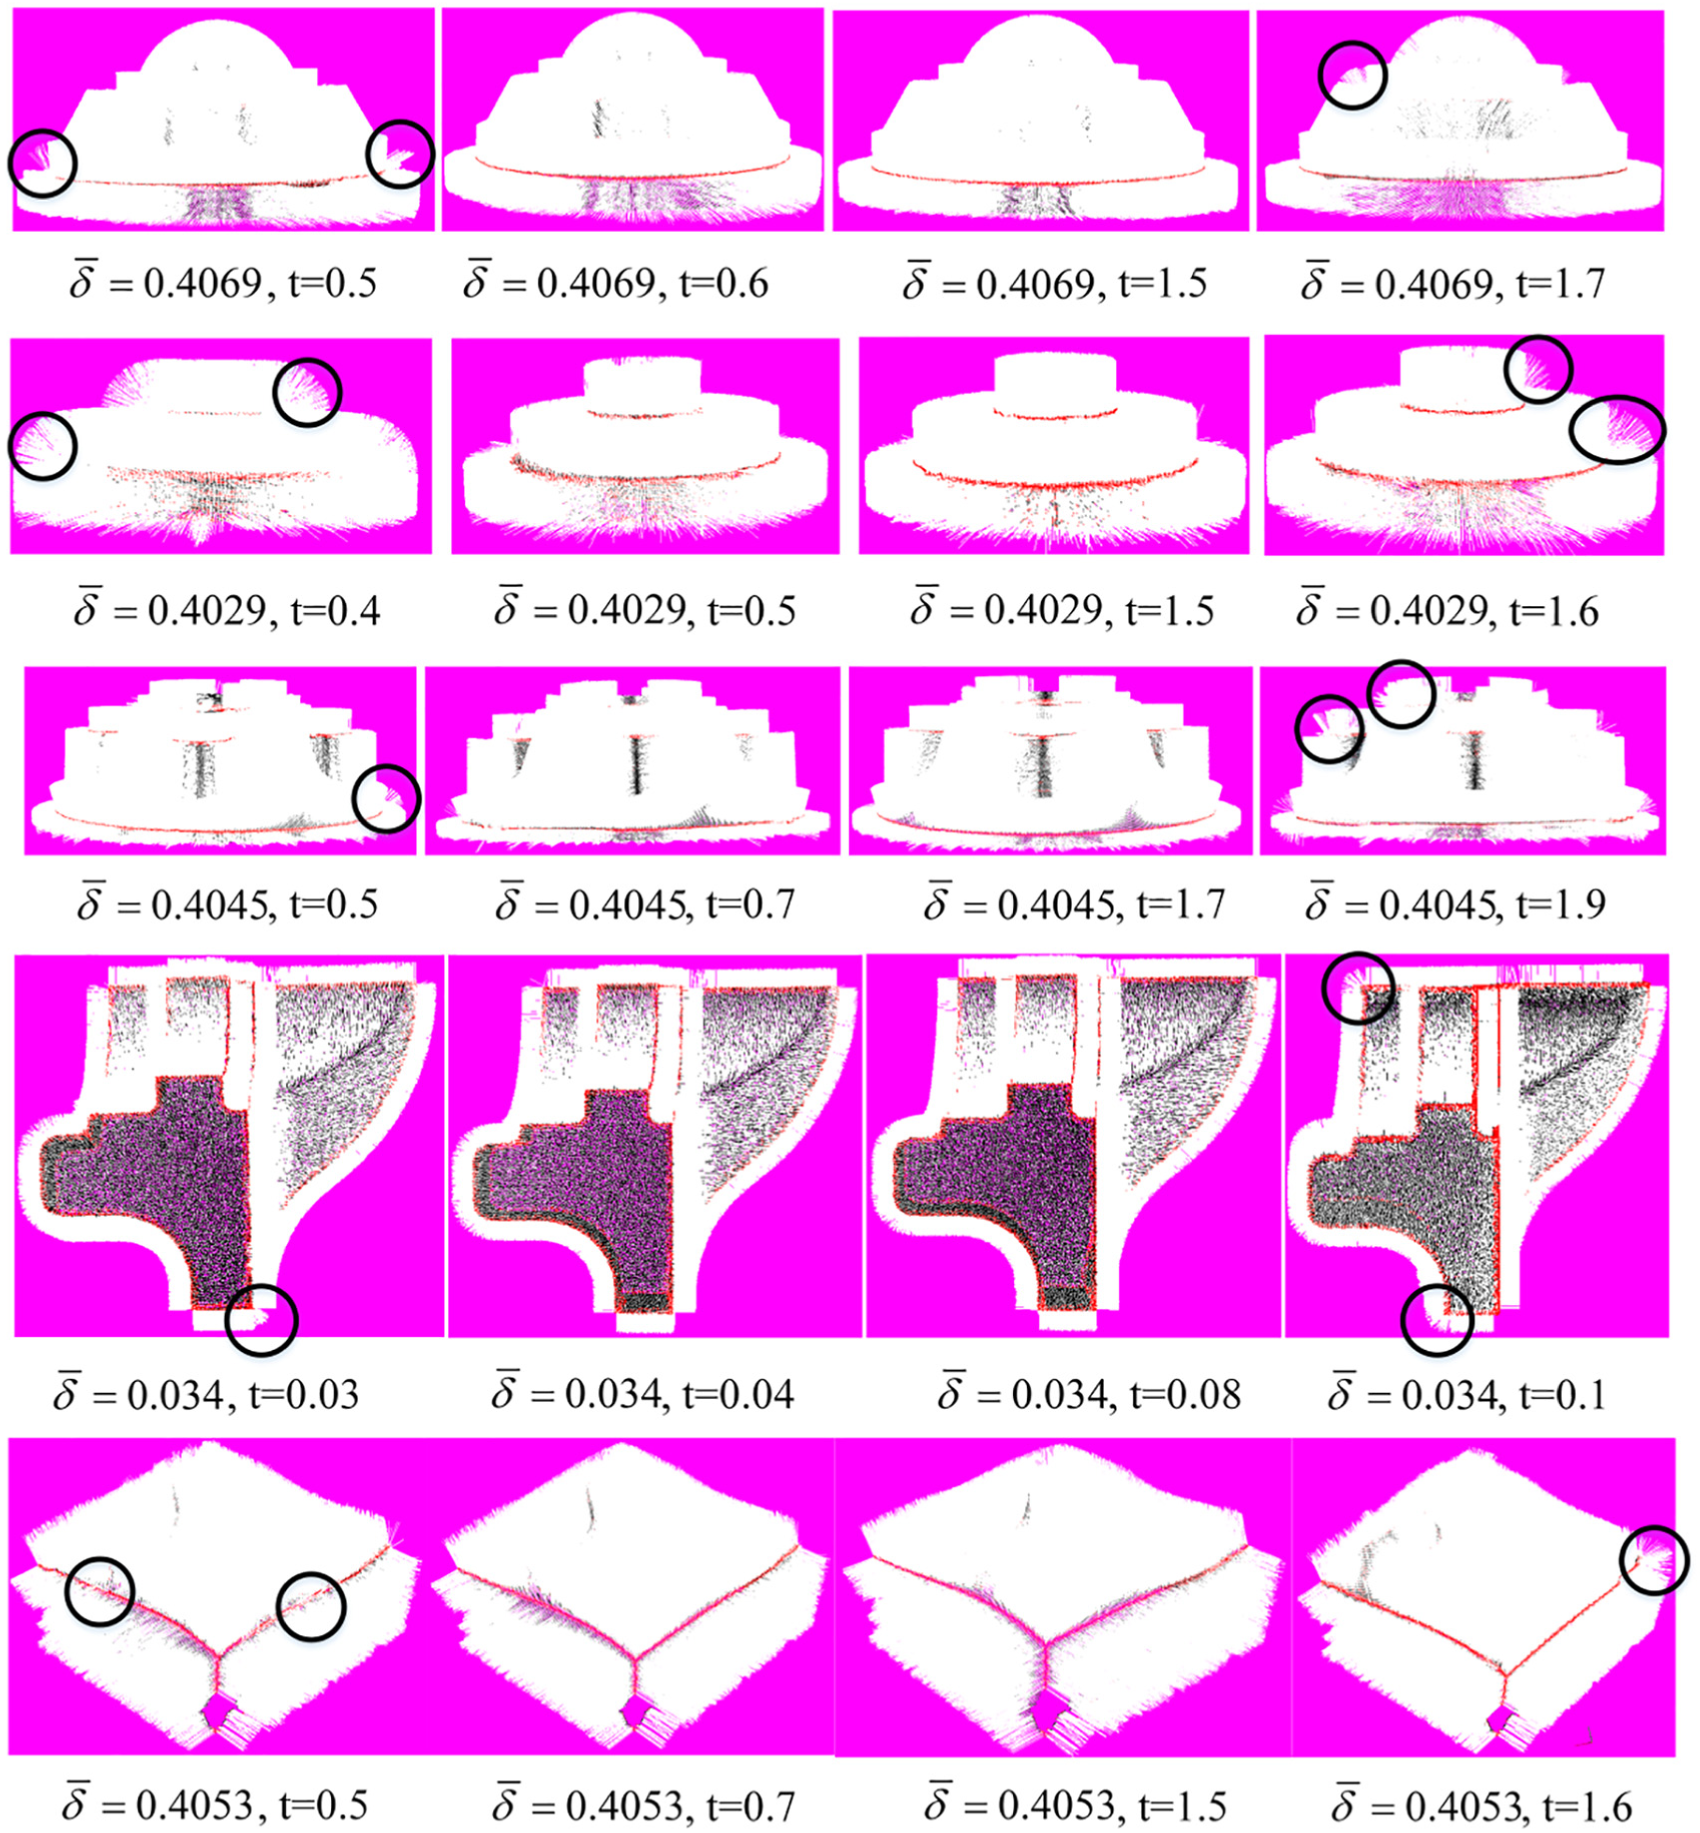
Relationship between distance threshold t and local point spacing
Candidate neighborhood construction
To realize the neighborhood segmentation, all the edge points are removed from
In this study, a residual constrained neighborhood construction strategy is presented to add the edge points to the corresponding sub-neighborhood and generate a set of reasonable candidate neighborhoods. The strategy is based on the segmented sub-neighborhoods. For each segmented sub-neighborhood
Dealing with features with close proximity
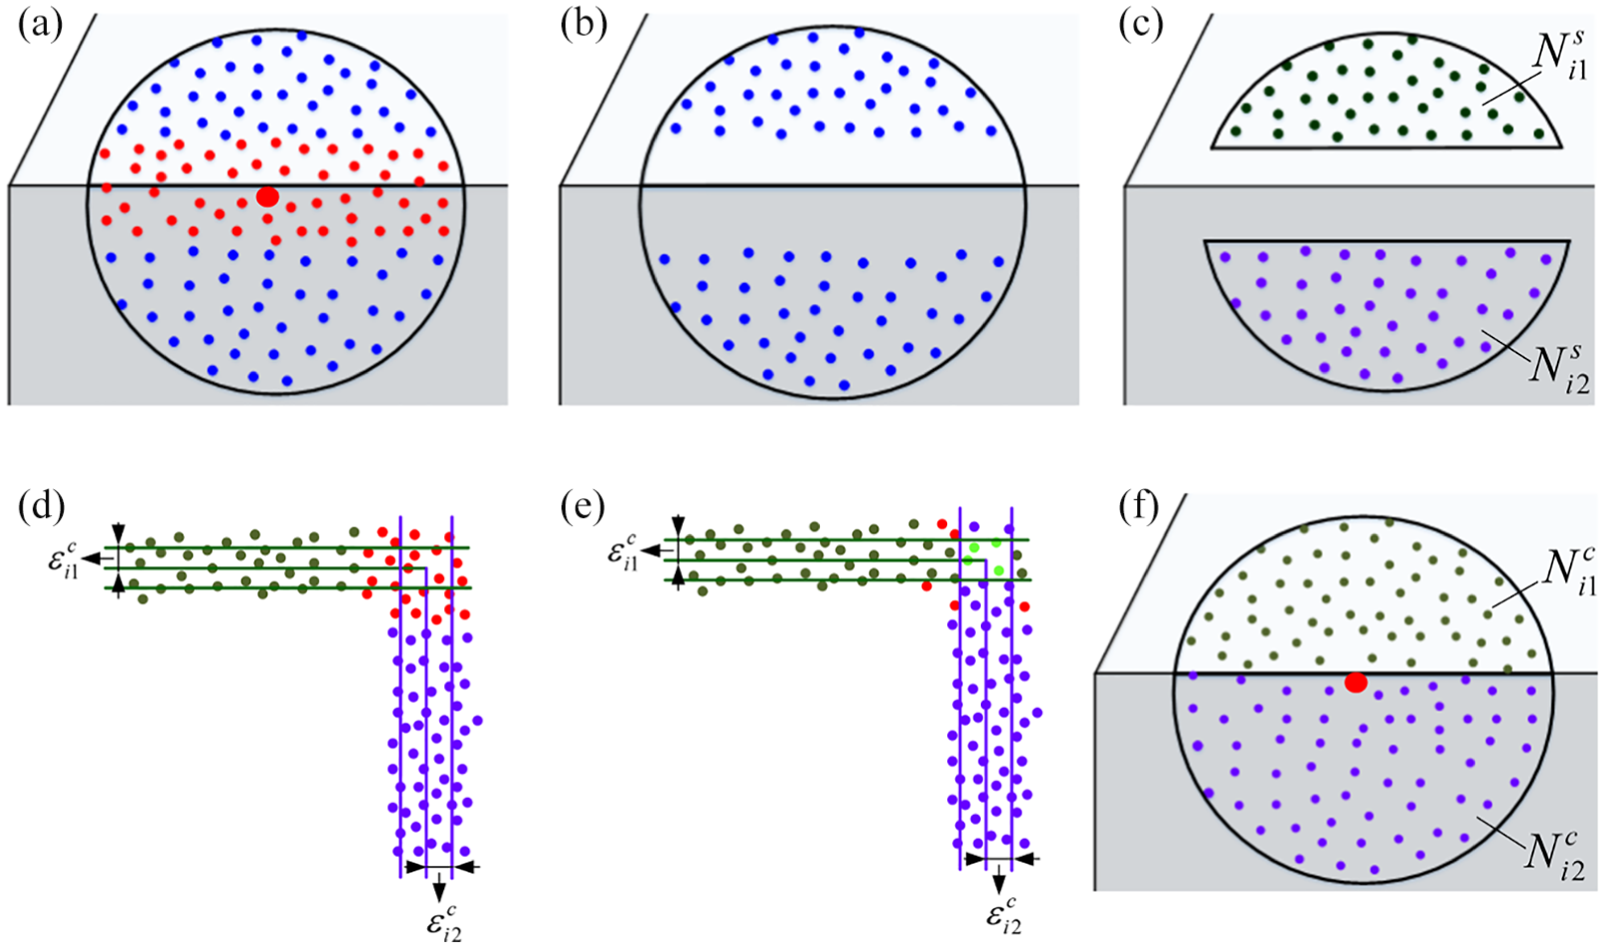
Features with close proximity are common in many captured scenes, especially when the scanned object is mechanical part or artifact. However, it is likely that all points in narrow-band region between these features are identified as edge points using the edge points identification method mentioned in section “Edge point recognition,” as shown in Figure 8(a). In this case, the points’ normal may be incorrectly calculated, as shown in Figure 8(b), the normal of the edge points between the two features are considered as the normal of the two features.
Deal with features with close proximity: (a) All the points in narrow-band region are identified as edge points, (b) Points’ normal vectors are incorrectly calculated in narrow-band region, (c) Neighborhood of a point
To cope with this problem, a two-stage clustering strategy is devised. As shown in Figure 8(c), after the first clustering mentioned in section “Neighborhood segmentation,” neighborhood of an edge point in narrow-band region is segmented into two sub-neighborhoods, in green and blue color, respectively. The two sub-neighborhoods are located on the surface patches in close proximity to each other. First, each of the sub-neighborhoods is fitted to a plane as mentioned in section “Candidate neighborhood construction,” and the corresponding maximum fitting residuals
Dealing with sampling anisotropy
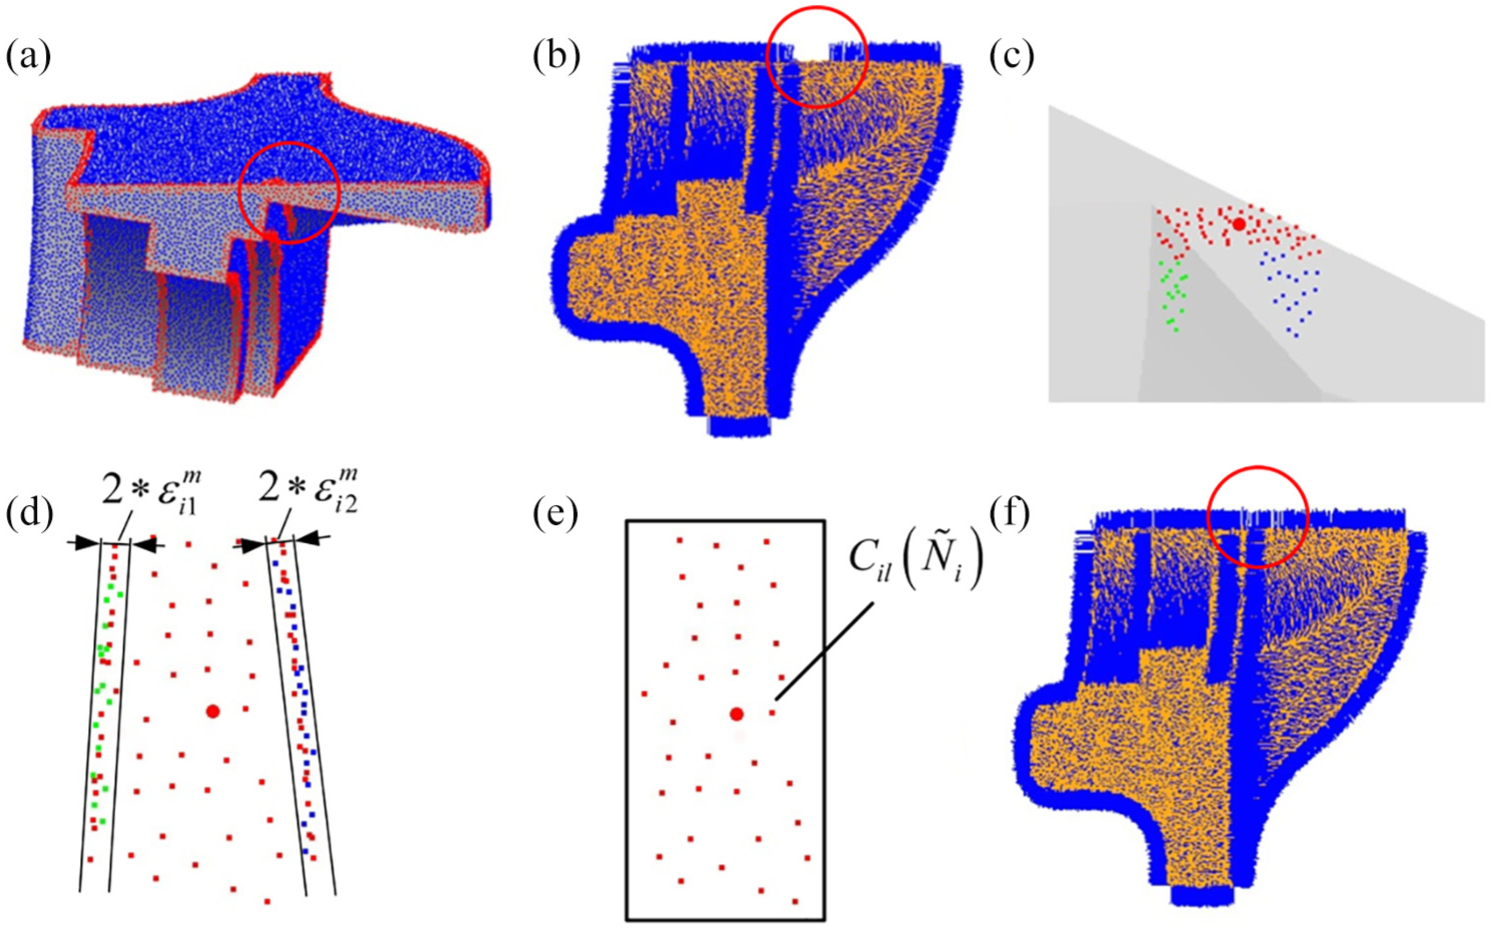
Non-uniform sampling occurs ordinarily due to varying incidences on scanned surfaces. As shown in Figure 9(a), when the sampling is extremely non-uniform near the sharp features, the proposed edge point recognition method may fail to detect the edge points on the surface with higher sampling density. This will lead to a smooth normal by applying PCA on these points’ neighborhoods, as shown in Figure 9(b).

Dealing with sampling anisotropy: (a) Result of edge point recognition, blue points are non-edge points, red points are edge points. The proposed edge point recognition method fails to detect the edge points on the surface with higher sampling density, (b) Non-edge point’s neighborhood may contain edge points from different surface patches, (c) The blue points in the circle are seed points for neighborhood growth, (d) Result of neighborhood growth, a consistent neighborhood is generated for normal estimation, (e) Neighborhood of an edge point on sparse sampling surface and (f) Result of sub-neighborhood growth, a larger sub-neighborhood in surface patch with sparse sampling is generated.
For robustness to density variation, a neighborhood growth strategy is proposed to generate a consistent neighborhood which is clear of edge points. For each non-edge point, if its neighborhood contains edge points, this means that the point is near sharp features. To avoid using points belonging to different surface patches, all the edge points in the neighborhood together with non-edge points with a distance greater than t from the current point are removed from the neighborhood. Then the remaining non-edge points in the neighborhood are used as seed points for neighborhood growth, as shown in Figure 9(c); the points in the circle are the seed points. For each remaining non-edge point, 10-nearest neighbor points are computer and the non-edge points with a distance less than t from the current seed point are added to the current neighborhood. If the neighborhood size is less than
Sampling anisotropy leads to another challenge for edge point normal estimation. As shown in Figure 9(e), when an edge point
Criteria for neighborhood selection
Several candidate neighborhoods are obtained after the neighborhood segmentation and construction operation outlined earlier, each candidate neighborhood contains solely the points sampled from the same surface patch. To accurately estimate the normal, the proper neighborhood needs to be identified from the neighborhood set. For this purpose, the following weight is defined
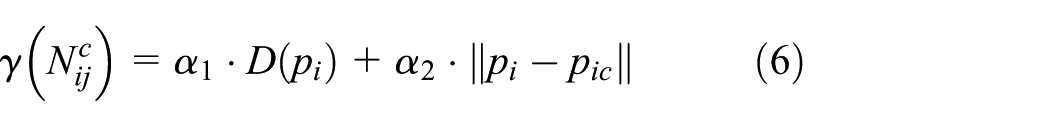
where
The first item
To make sure the success of the neighborhood segmentation, a large initial neighborhood
Computational complexity
In our method, only classical PCA and Euclidean distance clustering are used, no complex iterative optimization algorithm is included. Thanks to the simplicity of our approach, the speed of our method is acceptable, although there are many steps to build and evaluate candidate neighborhoods. The neighborhood search and candidate neighborhood construct part are the main computational cost. For each edge point, the computational complexity of our candidate neighborhood construction algorithm is roughly
Implementation results
To evaluate the performance of the proposed approach, a variety of point cloud models with sharp features and synthetic Gaussian noise are tested. A series of comparisons are made between this paper’s method and some state-of-the-art methods: PCA, 12 robust normal estimation (RNE), 16 HF, 30 and LRR, 19 in view of sharp features, sampling anisotropy, and noise. According to the sampling strategy, HF has three versions: HF_points, HF_cubes and HF_unif.
Two different scores are used to quantitatively evaluate the algorithms’ performance: the root mean square with threshold (RMS_τ) and the number of bad points (NBP). The RMS_τ is a standard error measure which provides a good idea of the overall performance of an algorithm. It is defined as
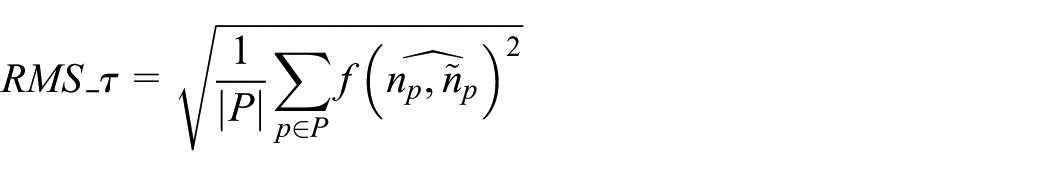
where

All the noise used in the experiments is Gaussian noise, with different standard deviations as % of the mean distance between points. The proposed method is implemented using VC++ and Point Cloud Library (PCL). HF are also programed based on the PCL, while LRR and RNE are in MATLAB version. All the experiments have been performed on the same computer with 1 CPU Inter(R) Core(TM) i3-3240M 3.40 GHZ and 4 GB RAM without parallel computing.
The parameters used in this article are summarized as follows:
t: the distance threshold used in Euclidean distance clustering.
The choice of parameters depends on the surface sampling density and noise. Empirically, the parameters
Comparison on feature preservation
Sharp features with shallow angles
To compare the performance of each algorithm on sharp features with shallow angles, all the methods are applied on the 20K octahedron model with 50% noise. The sharp features included in the model are generated by two intersection planes with shallow angles. The comparison results are shown in Figure 10. It can be seen that the computation time of PCA is less than other methods, but there are many mistakes around the edges. The normals are overly smoothed near sharp edges, which lead to the loss of sharp features after point-based rendering. The performance of HF_points is worse than PCA, since the RHT does not smooth out noises. HF_unif and HF_cubes blur the edges in less degree but many erroneous normals may still persist in the vicinities of sharp features. The reason of the inferiority of HF for such case is that when the intersection angle is shallow, the normals produced by triples sampled from different sides are likely to vote for the same bin. RNE performs better than those of HF and PCA but still inferior than LRR and the presented method. The NBP and RMS_τ of the presented method are similar with LRR and much less than the other methods, while the computation time of the presented method is far less than that of LRR.
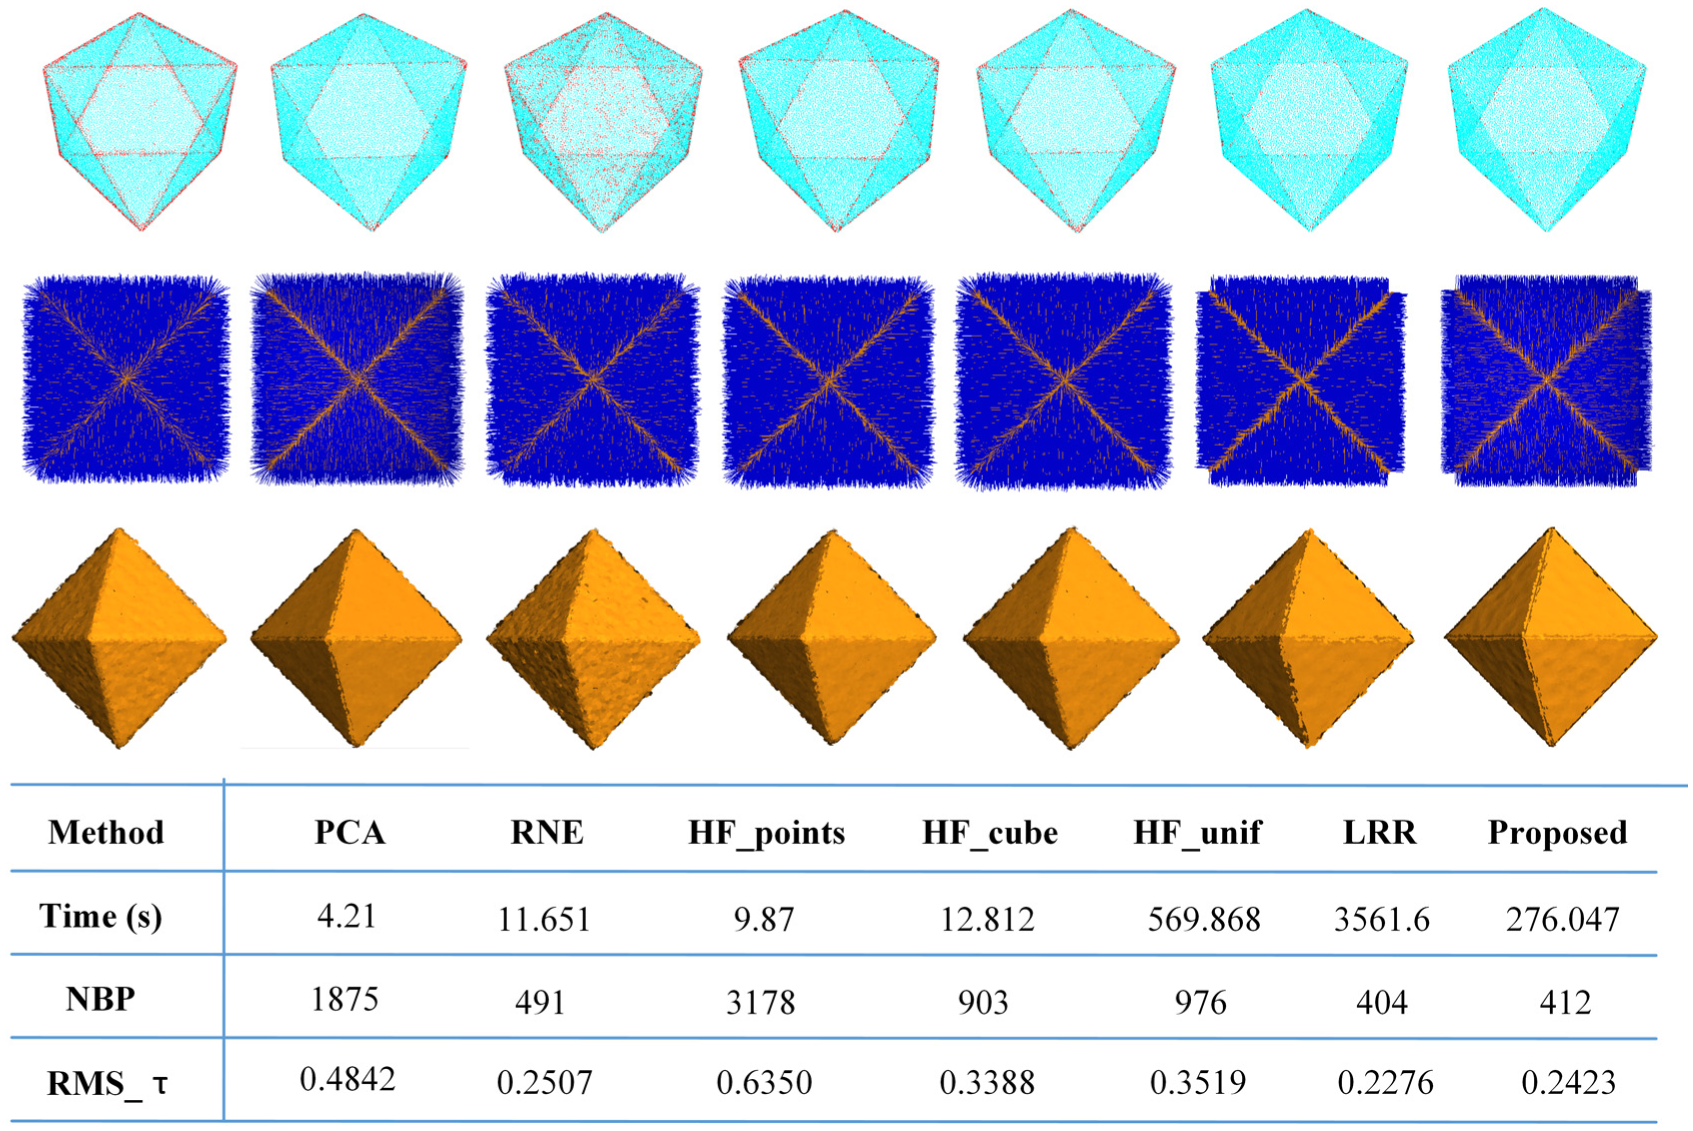
Comparison on octahedron containing sharp edges with shallow angles. From top to bottom row are the visualization of bad points colored in red, estimated normals, rendering using surfels and the result statistics of each algorithm, respectively. From left to right are the results of PCA, RNE, HF_points, HF_cubes, HF_unif, LRR, and proposed algorithm, respectively.
Neighborhood with multiple features
Fandisk model with 40K points and 50% noise is used to evaluate the performance of each algorithm on complex neighborhood structure. Many points’ neighborhood of Fandisk model may contain multiple feature lines because of the narrow-band regions it contains. The complex neighborhood structure presents challenges for the normal estimation. The results are presented in Figure 11. PCA, RNE, and those of HF generate many bad points around the narrow-band region marked in Figure 11. By contrast, the presented method and LRR perform much better on the region, and most bad points are distributed along the edges. The second row of Figure 11 shows that although other algorithms overly smooth the normal around features, the presented method remains the discontinuity of normals properly, almost as good as LRR. This illustrates that the presented neighborhood segmentation method can handle complex neighborhood.

Comparison on Fandisk containing complex neighborhood structure. 50% noise is added. From left to right, they are the results of PCA, RNE, HF_points, HF_cubes, HF_unif, LRR, and proposed algorithm. From top to bottom row are the visualization of bad points colored in red, estimated normals, rendering using surfels and the result statistics of each algorithm, respectively.
Comparison on robustness to sampling density
To evaluate the robustness of the presented method to non-uniform sampling, a tetrahedron with 13K points and a cube model with 20K points sampled with face-specific variations of density are tested. The results are shown in Figures 12 and 13, respectively. It can be seen that PCA and HF_points generate many erroneous normal near sharp features. HF_cubes and HF_unif perform better than RNE, since they are devised to deal with density variation. However, there are still some errors near sharp features. The presented method and LRR are still much more superior to other methods. As shown in the bottom row of Figure 13, in view of RMS_τ, the proposed method is better than LRR. The experiment indicates that the presented method can find a neighborhood without crossing features even when the sampling is very anisotropic around sharp features.

The presented method is robust to anisotropic sampling. The numbers of points on tetrahedron’s four surfaces are at a ratio of 1:2:3:4.
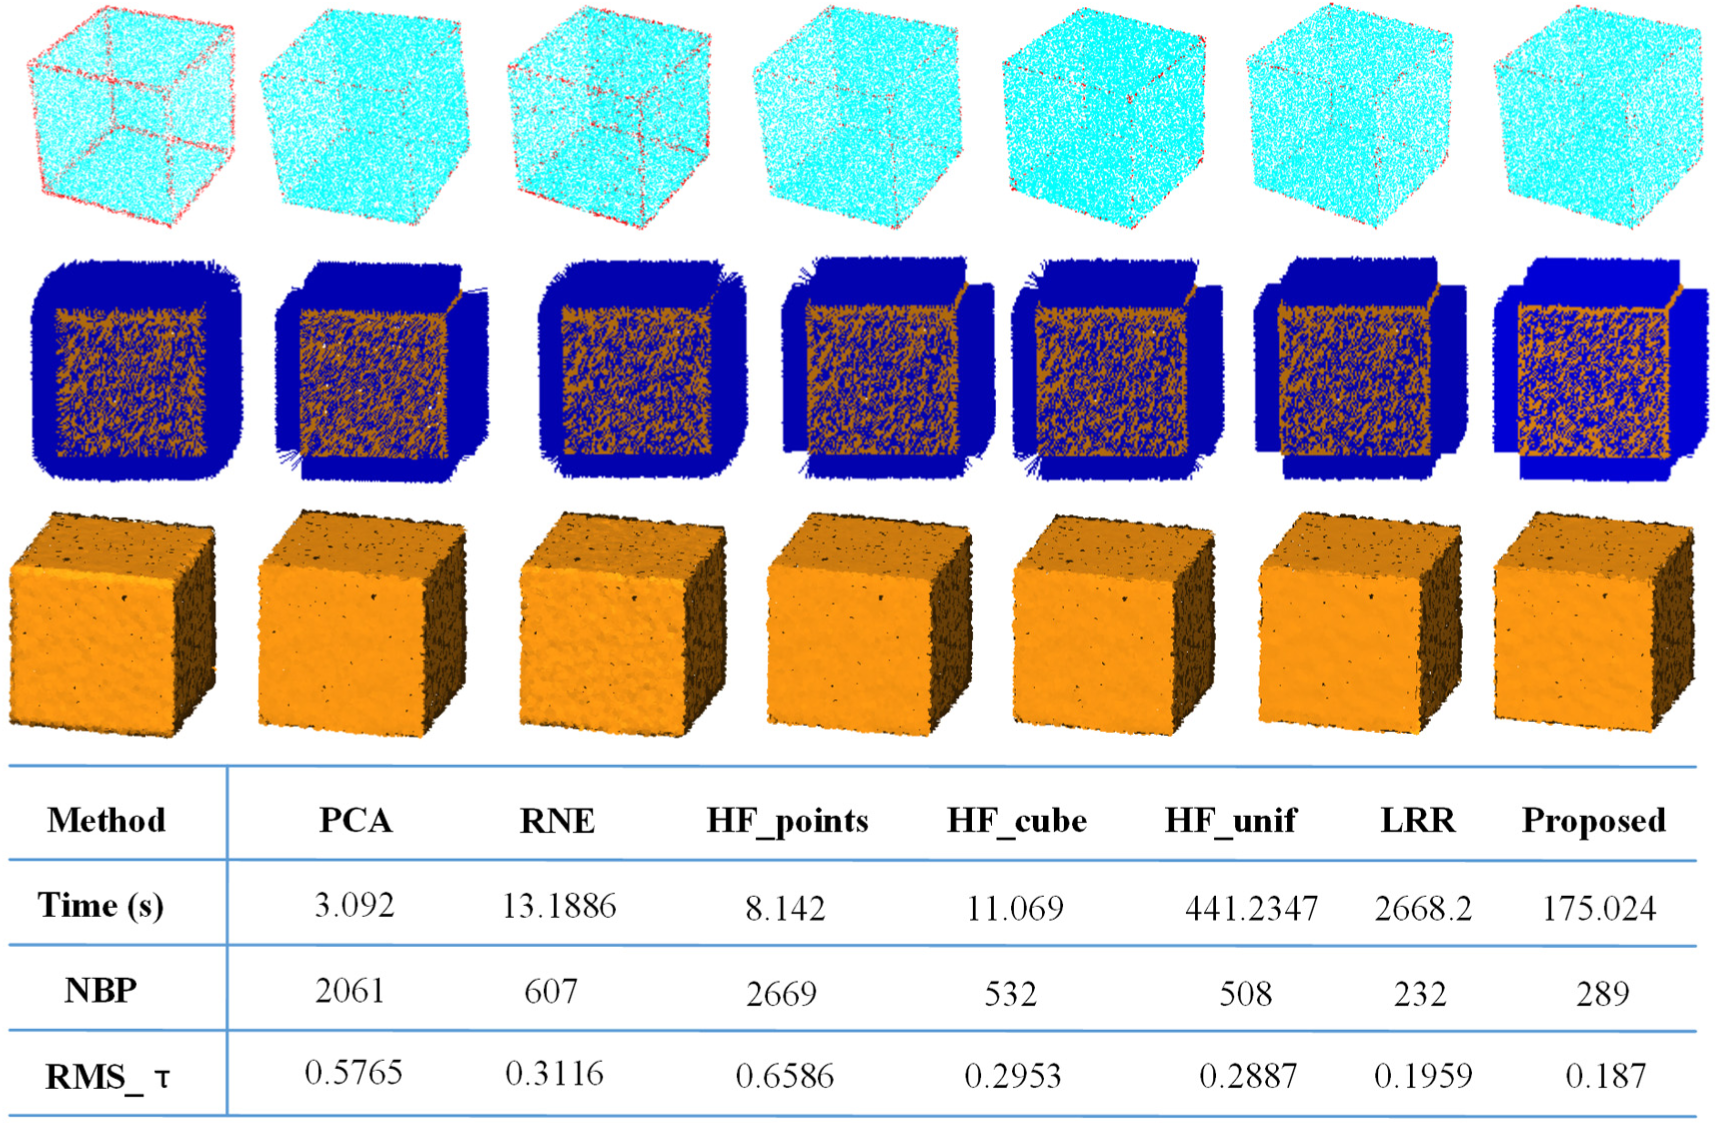
The presented method is robust to anisotropic sampling. The numbers of points on cube’s right, up, and front surfaces are at a ratio of 1:2:6, and surfaces on the opposite position have same number of points.
Comparison on robustness to noise
Figure 14 shows that the proposed method is robust to noise. In this experiment, two models of Cube and Octahedron with varying Gaussian noise levels are tested. The noise level of these models varies from 0% to 100%. Although the performances of all the methods drop with the increase of the noise level, the proposed method achieves the lowest RMS_τ and NBP. With the increase of the noise level, the RMS_τ and NBP of HF increase rapidly when the noise level is greater than 40%. The same phenomena can be observed in RNE when the noise level is greater than 60%. The proposed method and LRR increase in small amplitude until the noise level is greater than 80%, and the proposed method achieves the lowest RMS_τ and NBP when the noise level is greater than 80%. This shows that the presented method has good robustness to noise.

The presented method is robust to noise. RMS_τ and NBP of RNE, HF_points, HF_cubes, HF_unif, LRR, and proposed method on octahedron and cube at different noise levels are shown in the top and bottom row, respectively.
Comparison on detailed shapes
Three models with detailed features are used to evaluate the performance of each algorithm in dealing with detailed shapes. To clearly show the rendering effect of detail features, no noise was added to the point cloud. As shown in Figure 15, the performances of all the methods drop when dealing with detailed features and high RMS_τ and NBP are achieved. HF achieves lower RMS_τ and NBP, that is because the method estimates local normal vector with only three randomly selected points in the neighborhood, so it can better describe sharp detail features. This advantage is particularly evident when deal with red_circular_box model, which contains more detailed sharp features. Figure 16 shows the rending of each model with the estimated normal. It can be seen that HF and LRR preserve sharp features, but the details in smooth region are seriously smoothed out. That is because triples would be selected with a higher probability in regions of large area; thus, the details in smooth region will be smoothed out. And the LRR may fail to analyze neighborhood structures correctly when the neighborhood structures are complex. Our method, RNE and PCA are a bit smooth near detailed sharp features, but more detail features are preserved.

Comparison of the NBP and RMS_τ on the detailed shapes.
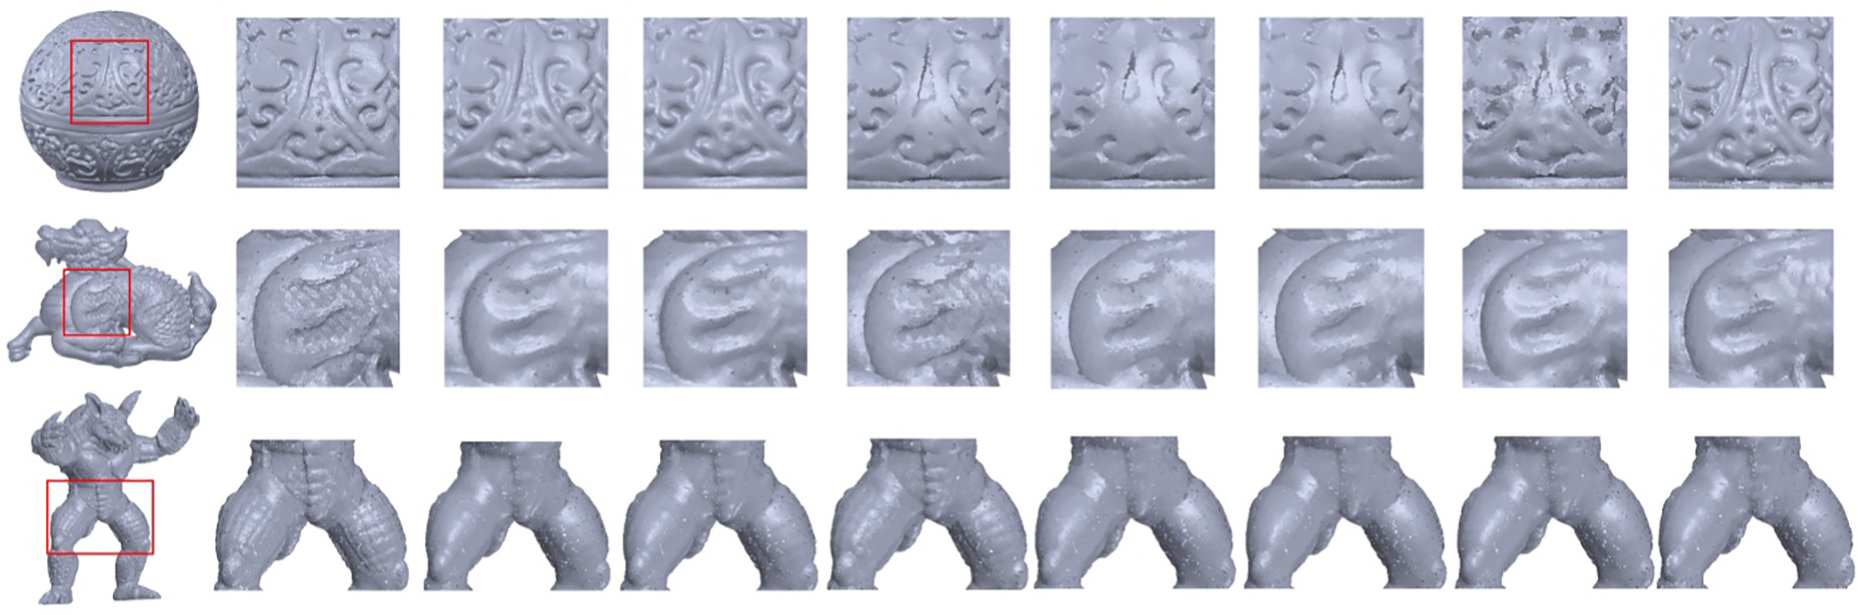
Rendering results using normals computed by different methods. For each model, from left to right, they are the input model, the local enlarged drawing of input model, the local enlarged drawing of the rendering results of PCA, RNE, HF_points, HF_cubes, HF_unif, LRR, and proposed algorithm, respectively.
Actually, our algorithm will degrade into PCA in dealing with these highly curved models. That is because most of the points in highly curved regions are identified as edge points. In such circumstance, two special cases arise: one case is that no clustering is found by Euclidean clustering. In this case, as stated in section “Neighborhood segmentation,” a neighborhood with
Comparison on raw scans data
Real scanned point clouds, sampled from four workpieces, are used to evaluate the effectiveness of the presented method to handle the real data. The obtained data are defective because of the noise, outliers, and sampling anisotropy, which usually smooth out the sharp features. As the ground truth normals are unknown, quantitative evaluations are not possible, straightforward visual comparison is used to compare the point-based rendering results based on normal estimated by PCA and the proposed method. The results are presented in Figure 17. It can be seen that the proposed method can preserve the sharp features quite well whereas the estimated normals from PCA result in loss of the sharp edges.

Comparison on real scanned data. The result of PCA is shown on the top row, and the result of proposed method is shown on the bottom row.
Conclusion
In this article, a robust feature preserving normal estimation method based on neighborhood reconstruction has been presented. A robust edge point recognition method based on the statistics analysis of neighborhood points’ normals is proposed. Two specific neighborhood reconstruction techniques are introduced for edge points and non-edge points to generate an isotropy neighborhood for normal estimation. The experiments exhibit that the proposed method outperforms other state-of-the-art methods most of the time, while with relatively low computational cost. Moreover, the proposed method shows good robustness to noise, non-uniform sampling.
However, the presented approach may be unstable when dealing with sparsely sampled models, since it will be hard to get enough points in each segmented sub-neighborhood to accurately identify the parameters of the corresponding underlying surfaces, especially on narrow region. In these cases, the sharp features will be totally lost. Furthermore, some parameters used in this article are decided empirically; more faithful normals can be generated with delicate parameters turning. In the future, we would like to choose these parameters adaptively according to various noises and sampling density.
Footnotes
Acknowledgements
The authors are grateful to all the reviewers for their valuable comments. Thanks to Jie Zhang and Alexandre Boulch for providing the code used for comparison. Thanks to Junjie Cao for providing the models used in this article.
Handling Editor: Francesco Massi
Declaration of conflicting interests
The author(s) declared no potential conflicts of interest with respect to the research, authorship, and/or publication of this article.
Funding
The author(s) disclosed receipt of the following financial support for the research, authorship, and/or publication of this article: This research was sponsored by the National Natural Science Foundation of China (grant number 51475324) and Tianjin Science and Technology Committee (grant number 16PTGCCX00080).
Graphical abstract
In this article, a neighborhood reconstruction-based normal estimation method is presented to reliably estimate normals for unorganized point clouds. As the figure above shows, the algorithm consists of five phases: (1) for each point