
Abstract
This article focuses on a two-dimensional numerical model established to determine the seabed dynamic response in the region of a permeable submerged breakwater. The wave motion in this article is governed by the volume-averaged Reynolds-averaged Navier–Stokes equation, whereas Biot’s poro-elastic equation determines the seabed foundation. The water surface is recorded using the volume of fluid technique. In this study, the results for the two-dimensional seabed dynamic response for both the consolidation status and the dynamic wave-induced response status for the seabed foundation coupled with submerged breakwater are illustrated. The numerical results examined from the dynamic pore pressure, the effective stresses, the shear stress, and the seabed soil displacements revealed that the impact of dynamic response at the offshore zone/seaward on the seabed foundation is more developed than at the onshore zone/harbor side. Parametric results analysis as regards the effect of the wave, the seabed, and the submerged breakwater structure variation significantly affected the seabed foundation response coupled with the breakwater structure. The numerical outcome on the liquefaction potential shows that the seabed foundation is more seemingly to liquefy and happen approximately at the toe of the submerged breakwater under the wave loading.
Keywords
Introduction
In the past two decades, there is increasing attention in the usage of permeable submerged breakwaters as a marine defense structure against strong waves. These permeable submerged breakwaters have a minor visual intrusion and esthetic advantage over other marine defense structures. They allow passage of sediment, thereby keeping the environment open and sheltered simultaneously. In the past few years, an immense attempt has been put to model the wave–seabed–structure interaction (WSSI) phenomenon either by the analytical, physical, or numerical method to ascertain the disagreement associated with these models. The major reason behind this increasing attention is that several offshore installation facilities, for instance, oil-tube, oil platform, jetty, and pier, have been broken or destroyed by the wave-induced seabed response in the environs of coastal structures as a result of excess pore pressure within the seabed foundation. Many examples of breakwater failure have been published in numerous research works.1–7
In the past two decades, studies on analytical wave-induced interaction based on Biot’s consolidation 8 theory have been conducted and published in Jeng and Cha. 9 Numerous analytical solutions concerning wave-induced dynamic response on the infinite seabed under ocean wave loading were proposed.10–12 Later, Hsu and Jeng 13 established analytical wave-induced response on the finite thickness of seabed based on the three-dimensional (3D) short-crested wave. Afterward, numerous studies concerning complex and complicated conditions relating to waves and seabed have been reported, for instance, cross-anisotropic soil behavior14,15 and inertial effect.16,17 Apart from the analytical solution, many research works on laboratory experiments on the wave-induced application have been published for years.18–20 One famous example is Mizutani et al., 21 in which they carried out an experimental laboratory study on the problem of wave–porous seabed–structure interaction. Their investigations on the wave-induced dynamic response were to analyze the wave effect characteristics, seabed effect characteristics, and structure dimensions within the seabed foundation. Most recently, Jeng et al. 22 carried out a laboratory experiment to ascertain the interaction of the ocean waves, a submerged breakwater, a vertical seawall, and sandy seabed foundation. The purpose of the experiment was to read water height and the pore pressure within the seabed foundation. Their investigation results discovered a major change in the wave-induced pore pressure within the seabed due to the strong interaction of the incident wave, submerged structure, and the vertical wall. They also discovered that at the toe of the submerged structure, the wave-induced pore pressure was less significant compared to the submerged structure underneath. Subsequent from the analytical solution and the laboratory experiment development, numerical method application on wave-induced seabed response within the seabed foundation and the breakwater structure has been enormous. Numerical model in preceding years has been engaged as an effective tool for investigating the wave-induced seabed response. Numerical model in recent years has been advanced to consider the interaction between the waves and pore pressure in the porous medium by adopting the volume-averaged Reynolds-averaged Navier–Stokes (VARANS) equation to govern the wave motion and the porous flow in the porous channel according to Ye et al. 23 Most recently, Jeng et al. 24 carried out the integrated numerical model on associated problems on the WSSI, in which the VARANS equation was used as the determined equation for the porous flow in the porous channel for seabed foundation and the breakwater structure. Afterward, Zhang et al. 25 also researched into the wave propagation around a porous seabed foundation in the region of porous breakwater setup using the VARANS and Biot’s poro-elastic equations. Their results established that the seabed response near the foundation in the environs of the permeable submerged breakwater is reliant on the processes of the wave propagation, that is, emanating from the interaction of waves, permeable structure, and porous seabed foundation. Their model proved inadequate in showing the two-dimensional (2D) wave-induced seabed response distribution for the pore pressure, the effective stresses, the shear stress, and the soil displacements within the porous seabed foundation coupled with the permeable submerged breakwater for both the consolidation status and the dynamic wave-induced response status. Ye et al. 26 developed a 2D semi-coupled numerical model on fluid–structure–seabed interaction (FSSI) for validation, where they applied a section of the 2D wave-induced seabed response distribution to explain their application. Their model was based on coupling the Reynolds-averaged Navier–Stokes (RANS), VARANS equations, and the dynamic Biot’s equation together. They later developed a 3D semi-coupled numerical model of the WSSI, 27 which also applied a section of the 2D distribution to explain their 3D application.
The purposes of these studies are to investigate the wave-induced seabed response in the submerged permeable breakwater coupled with the seabed foundation by applying the COBRAS28,29 and COMSOL Multiphysics 30 simulation software to determine the 2D distribution for both the consolidation status and the dynamic wave response status. The results from the 2D numerical model are utilized to examine the parametric factors that influence the wave, seabed, and the permeable submerged breakwater characteristics. Finally, the results from the numerical model are engaged to identify the liquefaction potential zones within the porous seabed foundation. The results in the study are validated by comparing it with the experimental laboratory results from Mizutani et al. 21
Methods
In this article, the submerged breakwater and the wave sub-mode are being governed by the VARANS equation while Biot’s poro-elastic equation governed the seabed sub-mode. The waves were generated using the second-order Stokes (SOS) wave. Spongy layers are applied on both lateral sides of the fluid channel to absorb the wave reflection.
Seabed model
The seabed foundation is a component of solid material (soil particles), liquid (water), and void (air). The soil particles form the skeleton for the seabed foundation, where the pores are filled by the water and air. In this article, the oscillatory wave response for soil, which is governed by Biot’s poro-elastic equations, 8 is only considered. The determining porous equation can be denoted as


where
where


where

The exchange, within the soil displacement and effective stress with respect to Hook’s law, is denoted as


where
Wave model
Many researchers have tremendously played a role in researching into wave motion and its characteristics for all these years.31–32 The wave model in this article is governed by the VARANS equation, 33 which is derived from the RANS equation. The equations are denoted as follows:
Continuity

Momentum

where
From equation (11),
where V is the total volume, and
Boundary condition
In the determination of the VARANS equation in the fluid channel, acceptable conditions need to be assigned for the boundary. In the mean flow section, the application on the seabed foundation coupled with the permeable breakwater has zero slip boundary condition, whereas the issue of the air-movement is ignored. In the free surface area, tangential velocity stress, effective stress, and normal stress on the gradient kinetic energy of the fluid
The wave-induced response for the seabed also required suitable boundary conditions on the seabed foundation plane. On the seabed foundation plane, the effective vertical stress, likewise the shear stress, is ignored (
Verification
Numerous laboratory experiments were engineered by Mizutani et al. 21 on the permeable submerged breakwater as shown in Figure 1. A permeable submerged structure was constructed on a sandy porous seabed foundation. Four number of wave gauges were mounted to read the wave profile, two at the offshore zone/seaward and two at the onshore zone/harbor side, respectively. Four pressure sensors (transducers) were used to collect readings on the pore pressure within the seabed foundation coupled with the submerged structure. A pore pressure sensor (A) was installed into the submerged breakwater, whereas the remaining three transducers B, C, and D were placed in the seabed foundation as shown in Figure 1.
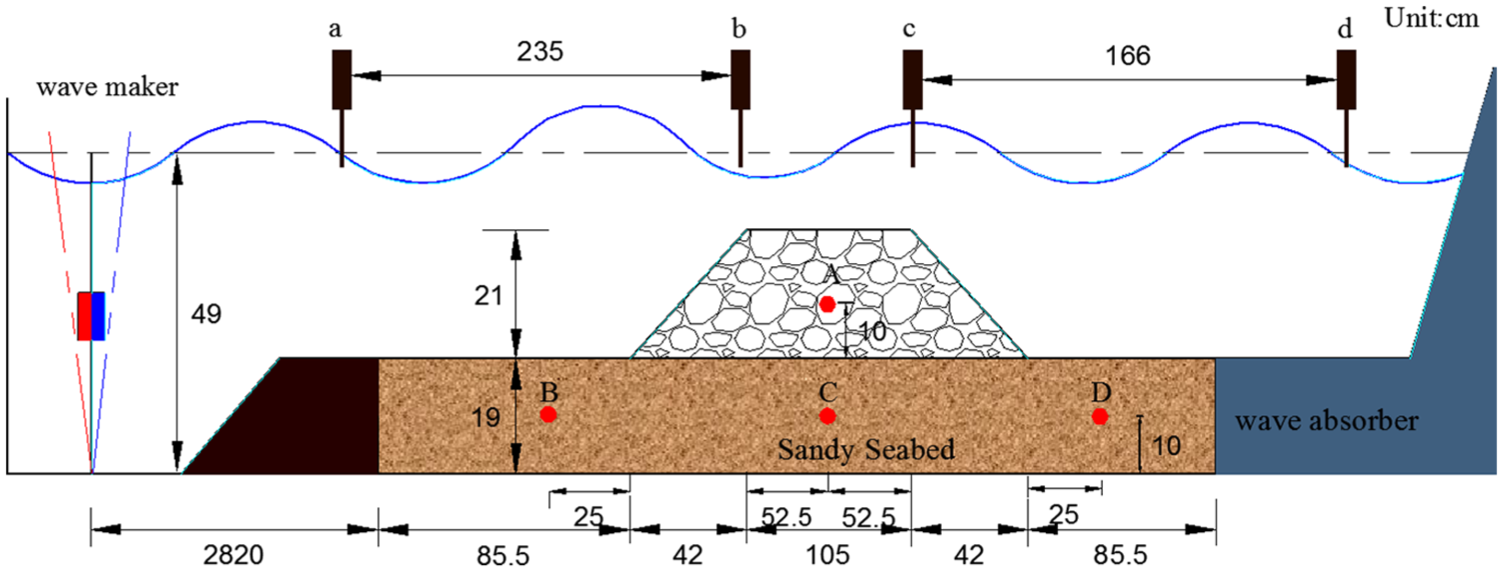
Wave flume setup of experimental laboratory work conducted by Mizutani et al. 21
As shown in Figure 1, a numerical wave tank with dimensions same as in Mizutani et al.
21
is adopted for this article. In the wave model, a 2m length wave absorbing sponge layer is applied at both vertical walls of the numerical computational domain. The internal wave maker is positioned at the far left-hand side of the domain to generate the waves.
33
To avoid the wave reflection, the submerged breakwater is located at a distance as far as the incident wavelength from the wave maker. Within the computational medium, the domain sizes used for this model is
Respective properties for the seabed foundation and the submerged structure and the wave characteristics properties are presented in Tables 1 and 2, respectively. In the numerical simulation processes, the seabed foundation and the permeable structure are considered as two distinct porous structures within the wave model. The data exchange point is applied by integrating the function at the boundary surface between the solid medium (porous seabed, permeable submerged breakwater) and the fluid mode. 34 Figure 2 displays the plotted agreement for wave profile between the present simulation results and experimental laboratory results of Mizutani et al., 21 where Figure 2(a) and (b) shows good results, while some small differences are observed in Figure 2(c) and (d), which are located at the onshore zone/harbor side. Figure 3 also displays the plotted agreement between the present simulation results and experimental laboratory results of Mizutani et al. 21 for the pore pressure readings from the pore pressure sensors at A, B, C, and D, at which all the results are excellent with a minor difference in boundary element model (BEM)-FEM from Mizutani et al. 21 The correlation results show that the integrated numerical model is applicable to the WSSI problems.
Porous seabed and the permeable submerged breakwater properties.
Wave characteristics properties.

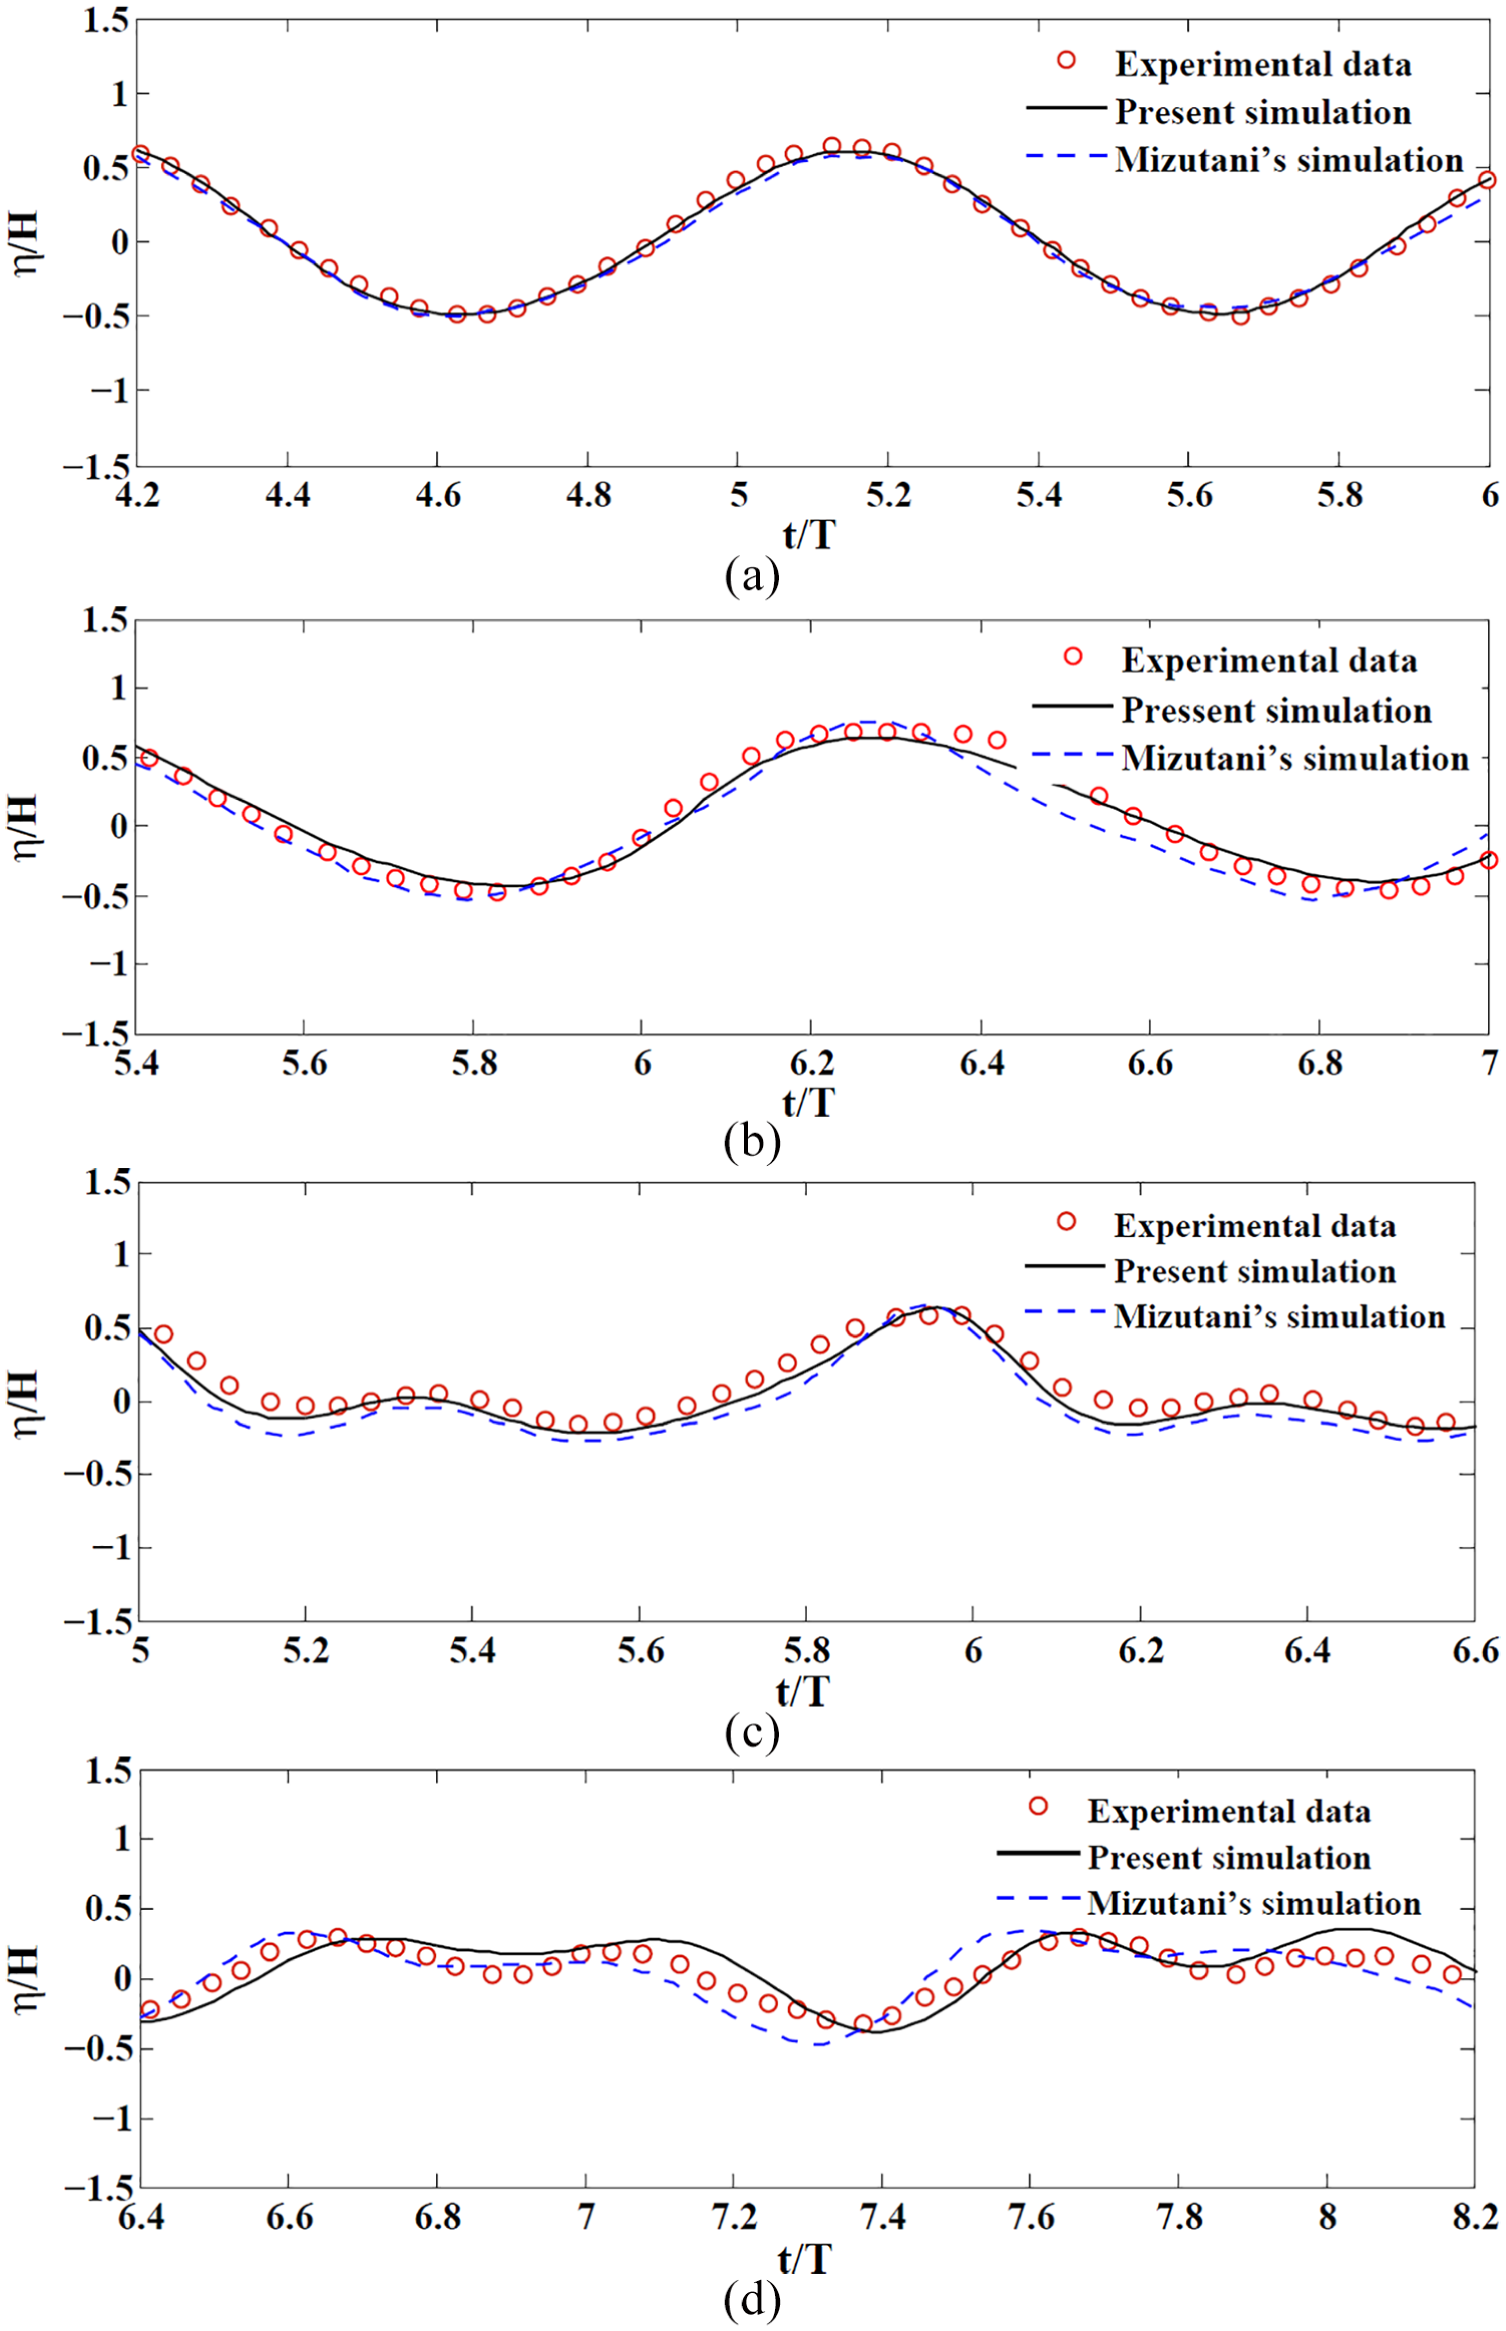
Correlation between the present simulated water surface and the experimental laboratory results at (a) offshore zone, (b) offshore crown zone, (c) onshore crown zone, and (d) onshore zone.

Correlation between the present simulation and the experimental results: wave induced at (a) section A (within the breakwater), (b) section B (offshore zone), (c) section C (beneath the breakwater), and (d) section D (onshore zone).
Results and discussion
Velocity field
Figure 4 indicates the velocity field under the wave action as it interacts with permeable breakwater. As the waves approach the breakwater, it is clearly observed that the waves are reflected by the breakwater surface, thereby reducing the energy and flow movement in the permeable breakwater.

Velocity field under the wave action.
Furthermore, it is noted that vortex field at the lee side of the breakwater is far limited. This is due to energy reduction and partial blockage of the cross-sectional pores from the permeable breakwater. Figure 4 also clearly depicts the flow velocity in the fluid domain decreases in a vertical direction with increase in the water depth, while flow velocity above the permeable breakwater shows a higher magnitude than the adjacent areas.
Consolidation status
It is known that once a breakwater, jetty, or any marine structure is developed on the seabed foundation, the seabed foundation changed in volume in response to the imposed pressure. In the ocean environment, wave loading and self-gravity are primary factors that influence seabed consolidation. Subsequently, once a breakwater is constructed on the seabed foundation, the seabed soil underneath the breakwater will be compacted and distorted under the gravity of the breakwater.23,24,35 The consolidation status of the seabed foundation is termed as the initial state or equilibrium state. To accurately simulate the WSSI, the initial consolidation state due to static wave loading has to be completely simulated before the dynamic loading from the wave is applied. 24
Figure 5 shows the simulated distribution results of the pore pressure

The simulated distribution of (a) pore pressure
Figure 6 shows the simulated distribution for the soil displacements

The simulated (a) horizontal and (b) vertical distribution of seabed and breakwater displacements
Dynamic wave-induced responses
To achieve the dynamic wave-induced dynamic response of the seabed foundation and the submerged breakwater in the integration processes, the extracted wave pressure from the wave is exerted on the seabed foundation coupled with the submerged structure in the seabed model at the boundary interface. In this study, under the dynamic wave loading, the following wave characteristics are used
Figure 7 shows the simulated distributions of the pore pressure

The simulated distribution of (a) pore pressure
In Figure 7, the following happenings are observed on the effective stresses
Figure 8 illustrates the simulated distributions for the soil displacement

The simulated (a) horizontal and (b) vertical distribution of seabed and breakwater displacements
Parametric study
Wave characteristics
In the assessment of the wave-induced response within the seabed foundation, the wave characteristic performs a significant function according to Hsu and Jeng.
13
The following wave characteristics are considered for this exercise, water depth d = 0.3 m, wave height H = 0.03 m, and wave period T = 1.4 s. The wave period (T) and the wave height
Wave period
Figure 9 show the transformation of waves results from the collected wave periods over a submerged breakwater at

Wave transformation diagram resulted from wave periods.
Figure 10 shows a pore pressure vertical distribution within the seabed foundation for the three wave periods at two specific locations,

Vertical distribution for wave periods at two different locations within seabed
Wave height
Wave height is another phenomenon that impacts the transformation of the wave on the seabed foundation. Figure 11 shows wave transformation, resulting from the wave height over a submerged breakwater at t/T = 1.2. The three waves’ heights used for this exercise are
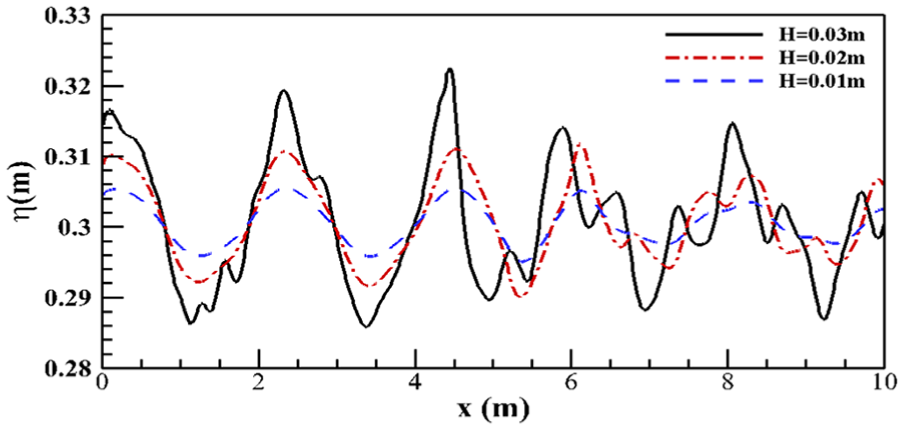
Wave transformation diagram resulted from wave height.
Figure 12 presents the oscillatory pore pressure vertical distributions for the wave height located at two different locations within the seabed foundation,

Wave-induced pore pressure vertical distribution for three wave height on two different locations within seabed foundation
Effect of seabed characteristics
The seabed soil characteristics are primary significant parameters for wave-induced pore pressure within the seabed foundation apart from characteristics of waves. The following soil characteristics are considered for this study, soil porosity n = 0.4, soil permeability
Porosity
To determine the soil porosity characteristic, an established

Wave-induced pore pressure vertical distribution for three porosity parameters on two different locations in the seabed
Permeability
Permeability is one of the important soil parameters that affects wave-induced soil dynamics. It is established that as seabed sediments undergo consolidation due to the self-weight of the overburden, the permeability of the seabed soil decreases.36,37 In this study, the permeability is assumed to be variable. The seabed parameters for the anisotropic seabed include the permeabilities

Vertical distribution of |p|po verses
Effect of structure characteristics
The presence of the breakwater structure in the wave-seabed model plays a tremendous role in the wave-seabed transformation effect. The breakwater structure partly or wholly blocks the narrow pores, by which the wave moves and naturally decays due to dissipation from the structure–wave interaction on the incident waves. 25 The breakwater structure parameters examined in these studies are structure width and structure height.
Structure height
In this study, the established water depth, the wave period, and the wave height are

Wave transformation diagram resulted from breakwater structure height.
Structure width
Figure 16 shows the comparison of three different variations of breakwater structure width

Wave transformation diagram resulted from a breakwater structure width.
Liquefaction potential
Liquefaction potential is a phenomenon where the stable state of the seabed foundation behaves in the form of a solid fluid.
23
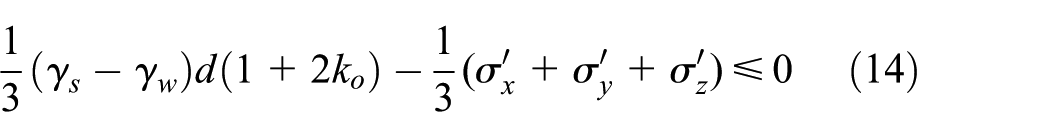
It has generally been well established that seabed foundation becomes liquefied under the wave loading due to the excess pore pressure exerted on the seabed foundation when there is the passage of wave over it. The seabed foundation mostly liquefied when the effective stresses at that zone in the seabed foundation decreases or equal to zero

which was later extended to 3D by Tsai et al. 40
where

where
Figure 17 presents the results of liquefaction potential zones at
The liquefaction potential zone in the range of
It is also noted that the liquefaction potential zones at the surface of the seabed foundation are near to the submerged structure foundation toe(s), and this can have a major effect on the foundation stability of the structure.
It is realized that there is no seabed liquefaction underneath the submerged structure, although the wave trough also acts in that zone. The reason behind this phenomenon is that the seabed underneath the breakwater structure is compressed by the gravity of the submerged structure and effectively shelters the seabed foundation from been liquefied. This phenomenon is called shielding effecting.41,42
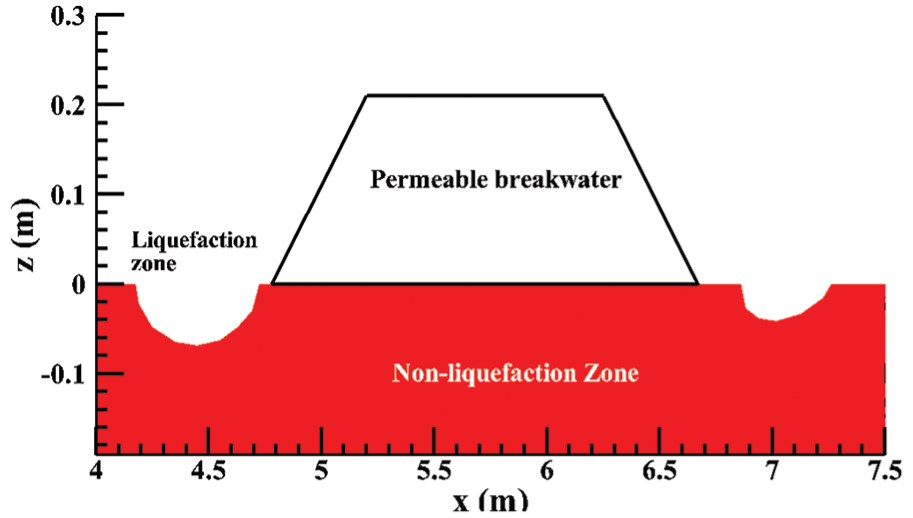
Liquefaction zones within the seabed foundation for t/T = 62.
Conclusion
In this article, a 2D numerical integrated model is developed to investigate the wave-induced seabed response within the seabed foundation coupled with a submerged breakwater. The following conclusions are outlined based on the results of this article:
The present simulation results show a complete total coherence with the experimental laboratory results in both the wave and pore pressure measurement.
The results from the consolidation status concluded that the self-weight of the submerged structure has an enormous impact on the initial state of consolidation.
The result shows that effective stresses most largely affect the submerged structure in the dynamic wave-induced response, where, underneath the wave trough, effective horizontal stress is compressive and effective vertical stress is tensile. On the contrary, underneath the wave crest, effective horizontal stress is tensile and the effective vertical stress is compressive. This is due to the wave trough disintegrates seabed and breakwater structure underneath it, while the wave crest consolidates or compacts the seabed and breakwater underneath it.
In the case of the breakwater structure, smaller breakwater structure height naturally leads to higher submerged water depth, indicating lower dissipation and reflection rate of the incident energy wave. In contrary, higher breakwater height results in higher dissipation and higher reflection of the incident energy wave, thereby lowering the submerged water depth.
Footnotes
Handling Editor: Elsa de Sa Caetano
Declaration of conflicting interests
The author(s) declared no potential conflicts of interest with respect to the research, authorship, and/or publication of this article.
Funding
The author(s) disclosed receipt of the following financial support for the research, authorship, and/or publication of this article: The principal author gratefully acknowledges the National Key Research and Development Program of China (2017YFC1404200), the Marine Renewable Energy Research Project of China (GHME2015GC01), and the Hydrological Services Department, Ghana, for its support for this research. The principal author also thanks Hohai University for supporting this research with Hohai University Scholarship.