
Abstract
This study focuses on the convective heat transfer characteristics of supercritical carbon dioxide flowing in a horizontal circular tube under high heat flux and low mass flux conditions. The influences of thermophysical property, buoyancy effect, and thermal acceleration on the heat transfer characteristics are discussed. The parameters are as follows: system pressure is 7.6–8.4 MPa, mass flux is 400–500 kg/m2 s, heat flux is 30–200 kW/m2, fluid temperature is 20°C −62°C, and Reynolds number is 1.23 × 10⁴ to 4.3 × 10⁴. The wall temperature and heat transfer coefficient of supercritical carbon dioxide are obtained. The results show that, under the condition of high heat flux and low mass flux, heat transfer deterioration would happen, in which thermophysical property and buoyancy effect are the main factors. When the pressure is 7.6 MPa, the buoyancy factor is greater than 10−3 in the whole heat transfer area, and the buoyancy effect cannot be ignored, while the thermal acceleration factor is 9.5 × 10⁻⁸ to 4 × 10⁻⁶ and the effect of thermal acceleration can be negligible. The experimental data are compared with the predictions using seven empirical correlations, in which the Liao–Zhao correlation shows the best performance.
Keywords
Introduction
Supercritical carbon dioxide (S-CO2) Brayton cycle is a new power technology that has higher cycle efficiency over the traditional Rankine cycle. The working fluid CO2 is always under supercritical pressure in the equipment; therefore, flow boiling crisis induced by phase change can be avoided. As a result, the compressor, heat exchanger, and turbine can all be downsized. Thus, the S-CO2 Brayton cycle has promising applications in many fields, such as nuclear energy, solar energy, waste heat utilization, and marine propulsion.1–3
The heat transfer characteristic of S-CO2 is one key technology for S-CO2 Brayton cycle. The physical properties of S-CO2 change significantly near the critical point and pseudo-critical point, resulting in complex heat transfer phenomenon.4–6 In recent years, some studies have been devoted to the heat transfer characteristic of S-CO2 flowing in tubes. Duffey and Pioro 7 summarized their study on the flow and heat transfer of CO2 under supercritical pressure. Liao and Zhao 8 found that when S-CO2 cools down in a horizontal tube, the data were quite different from the existing correlations of large-diameter tubes, and the data under heating conditions were also different from those under cooling conditions. Ehsan et al. 9 presented a comprehensive review on heat transfer of supercritical CO2 under heating and cooling applications. Cabeza et al. 10 conducted a review of supercritical CO2 flowing in heat exchangers. The available correlations and experimental studies were summarized to determine the heat transfer coefficients. Rao et al. 11 reviewed the heat transfer characteristics of supercritical CO2 in various channels. The effects of tube shape and size, as well as the parameter effects, including mass flux, inlet temperature, and pressure, were discussed. Xu et al. 12 discussed the buoyancy effects on turbulent heat transfer of supercritical CO2 in a vertical mini-tube according to wall temperature measurements. They concluded the features of buoyancy effects under upward flow and downward flow conditions. Kline et al. 13 studied the onset of heat transfer deterioration of supercritical CO2 flowing in vertical pipes. They found that the minimum heat flux at the onset of heat transfer deterioration followed power laws of mass flux. Zhang et al. 14 discussed the buoyancy and flow acceleration effects of supercritical CO2 flowing in vertical helically coiled tube and proposed a semi-empirical heat transfer correlation. Zhao et al. 15 investigated the buoyancy effect on supercritical CO2 flows. They explained the mechanism of the strong buoyancy effect based on numerical results. Zhang et al. 16 focused the heat transfer characteristics of supercritical CO2 under low mass flux conditions. Their results showed that heat transfer at lower mass flux was enhanced, rather than deteriorated. To sum up, although the heat transfer of supercritical CO2 has been studied extensively, the existing research works are still inconsistent, especially under the condition of high heat flux and low mass flux.
In practical applications, S-CO2 may sustain high heat loads under some circumstances and the influences of buoyancy effect; thermal acceleration tends to be more changeable, complicating the heat transfer process of S-CO2. Particularly, when the mass velocity is also relatively low, the heat transfer deterioration is more likely to appear. So far, the studies on heat transfer characteristics of S-CO2 are still inadequate under the conditions of high heat flux and low mass flux.
This article carried out an experiment on the heat transfer of S-CO2 flowing in a horizontal tube under high heat flux and low mass flux conditions. The influencing factors on heat transfer process of S-CO2 are discussed, in which the buoyancy effect is focused. The experimental data are compared with the empirical heat transfer correlations. This study could provide certain technical support for the heat transfer design of S-CO2 Brayton cycle.
Experimental descriptions
Experimental facility
As depicted in Figure 1, the experiment system was a closed circulation loop. The system was consisted of a high-pressure CO2 vessel, water cooling machine, back pressure valve, CO2 tank, high-pressure constant-flow pump, and mass flow meter. In the experiment, the loop was made vacuumed to exclude any non-condensable gas before CO2 flowed into the loop. The water cooling machine was used to control the temperature of CO2 in the tank. High-pressure CO2 entered into the loop through a relief valve. The high-pressure constant-flow pump fed liquid CO2 into the preheater. Then, it was heated in the test section. After cooled down by a condenser, the fluid entered into the tank again to form a closed circulation. The test section was a horizontal 316 L stainless-steel circular tube with a 2 mm inner diameter, 0.5 mm wall thickness, and 100 mm length. As shown in Figure 2, there were five temperature measurement sections along the flow direction and the interval between each section was 20 mm. On each cross section, there was one measurement point on both upper generatrix and lower generatrix, adding up to 10 measurement points in total.

Schematic diagram of the test loop.
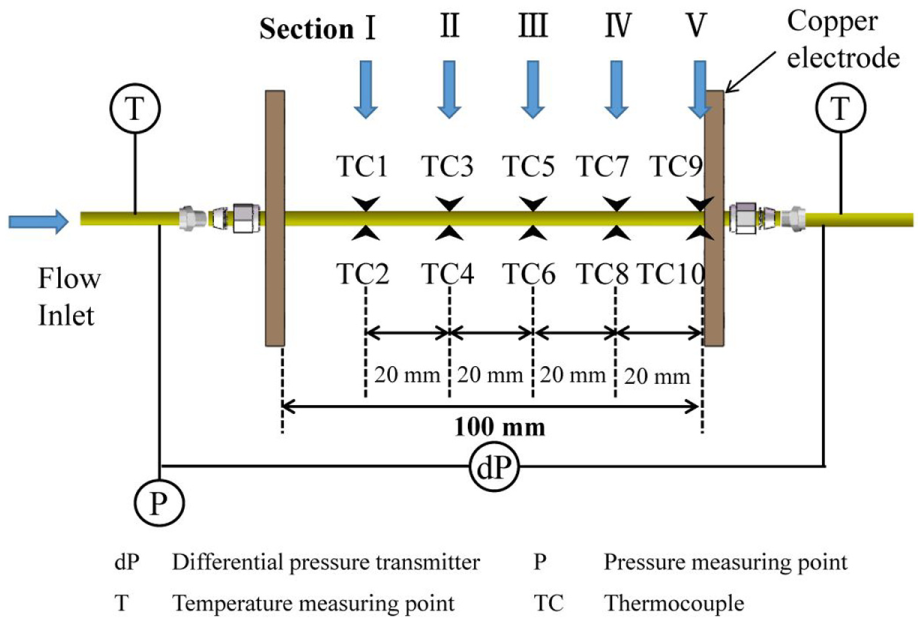
Details of the test section.
The test section was heated directly by alternating current with low voltage and large current to form uniform heating flux. The inlet bulk temperature at the test section is regulated by the preheater. The data at Section III are selected for data analysis because these data are mostly distributed around the pseudo critical point. The test section was wrapped with thermal insulation material with appropriate thickness, which can decrease heat loss, as well as to guarantee the measurement stability of outer wall temperature. The roughness of the test section was measured using a roughness measuring instrument (PGI Optics 3D; manufactured by Taylor Hobson), and the measured average inner surface roughness was 1.467 μm.
Parameter measurement and uncertainty
In this experiment, the main measured data include the outer wall temperature of the tube, the temperatures of inlet and outlet fluid, the mass flow, the inlet pressure and pressure differential across the tube, current, and voltage of the heating tubes.
The fluid temperatures at the inlet and outlet of the test section were measured using T-type (copper–constantan) sheathed thermocouples with a diameter of 1.5 mm. The outer wall temperatures of the test section were measured using K-type thermocouple wire with a diameter of 0.2 mm. The temperature measurement range of the thermocouple wire is 0°C–1000°C and its precision is ±0.5%. The response time of the sheathed thermocouple is less than 0.4 s and the highest measured temperature is 350°C, with a precision of ±0.4%.
The mass flow rate was measured by Siemens MASS 2100 DI 1.5 mass flow meter whose range was 0–60 kg/h and precision was ±0.2%. Rosemount pressure and pressure differential transmitters were used to measure the pressure and pressure differential of the tube. The range and precision of the two transmitters are 0–27 MPa and ±0.05%, 0–65 kPa, and ±0.05%, respectively.
Through the 200/5 A current transformer, the current of the test section was transferred to a current transducer (S3-AD alternating current transducer produced by TAIK) which turned the alternating current signals into 4- to 20-mA direct current signals. Then, the direct current signals were sent into an input data collecting board whose input signal range is 0–5 A. A S3-VD alternating voltage transducer produced by TAIK was used for the voltage of the test section and its input signal range was 0–50 V. An IMP3595 data collecting system was used to collect data of this experiment automatically.
Suppose Y is an indirectly measured parameter and is composed of several direct measured parameters Xi. Then the relative uncertainty can be calculated by the following formula 17
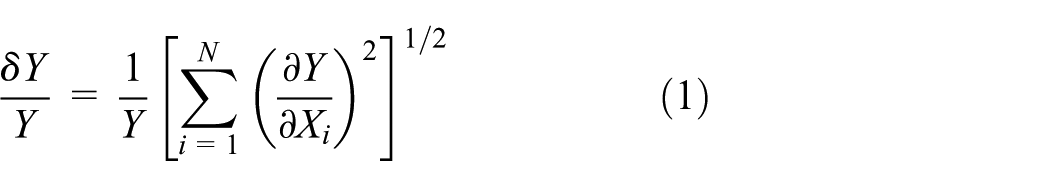
Based on equation (1), the uncertainty of the main parameters in this experiment can be determined, as shown in Table 1.
Uncertainties of the main experimental parameters.

Working condition
Parameter ranges in this experiment were as follows: system pressure p was 7.6–8.4 MPa, mass flux G was 400–500 kg/m2 s, heat flux q was 0–200 kW/m2, fluid temperature Tb was 20 °C–62 °C, and Reynolds number was 1.23 × 10⁴ to 4.3 × 10⁴. Main working conditions are listed in Table 2.
Test conditions.

Data reduction
Before the experiment starts, a heat balance test is carried out to determine the thermal efficiency η of the system. The formula is

in which m represents mass flow (kg/s); Hb,i and Hb,o are the enthalpies of the inlet and outlet fluid (kJ/kg), which are obtained from REFPROP physical property program; U represents heating voltage (V) and I, heating current (A). In this experiment, the thermal efficiency was in the range 94%–98%.
The heat flux of the inner wall of the test section is determined by
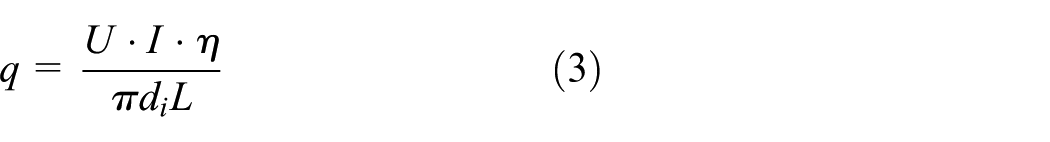
in which di is the inner diameter of the test tube section (m) and L is the effective heating length (m). Local fluid enthalpy value is treated as linear distribution and the formula of Hb, average fluid enthalpy value on cross section z is

in which z is the heating length calculated from the starting point. With local enthalpy value and pressure known, local fluid temperature Tb,loc can be obtained from the REFPROP physical property program.
The inner wall temperature is calculated from outer wall temperature using a heat conduction model of a cylindrical tube assuming uniform heat generation, 18 as shown in equation (5)

in which di and do are the inner and outer diameters (m); λw is the heat conductivity coefficient (W/m K) of the test tube. In this experiment, the heat conductivity coefficient did not change greatly, and the value is a constant of 16.3 W/m K. Local heat transfer coefficient is calculated from

in which Tw,i is the inner wall surface temperature of the cross section and Tb is the local fluid temperature of the cross section.
Results and discussion
Experiment system calibration
Heat transfer experiments using deionized water are carried out to verify the experimental system before the S-CO2 heat transfer experiment. The deionized water is prepared by ion exchange method, and its conductivity is less than 50 μS/m. For the single-phase convection heat transfer flowing in tubes, the Dittus–Boelter correlation is usually used (equation (7)), and the friction factor is compared to the Filonenko correlation (equation (8))


Figure 3 shows the calibration result of single-phase deionized water heat transfer. As depicted, the experimental values of Nu and friction factor f are well matched with the prediction values of the Dittus–Boelter correlation and the Filonenko correlation, respectively. Both of the errors are within the range of ±10%. The result show that the experiment system is precise enough and the equipment and data processing method are also reliable.
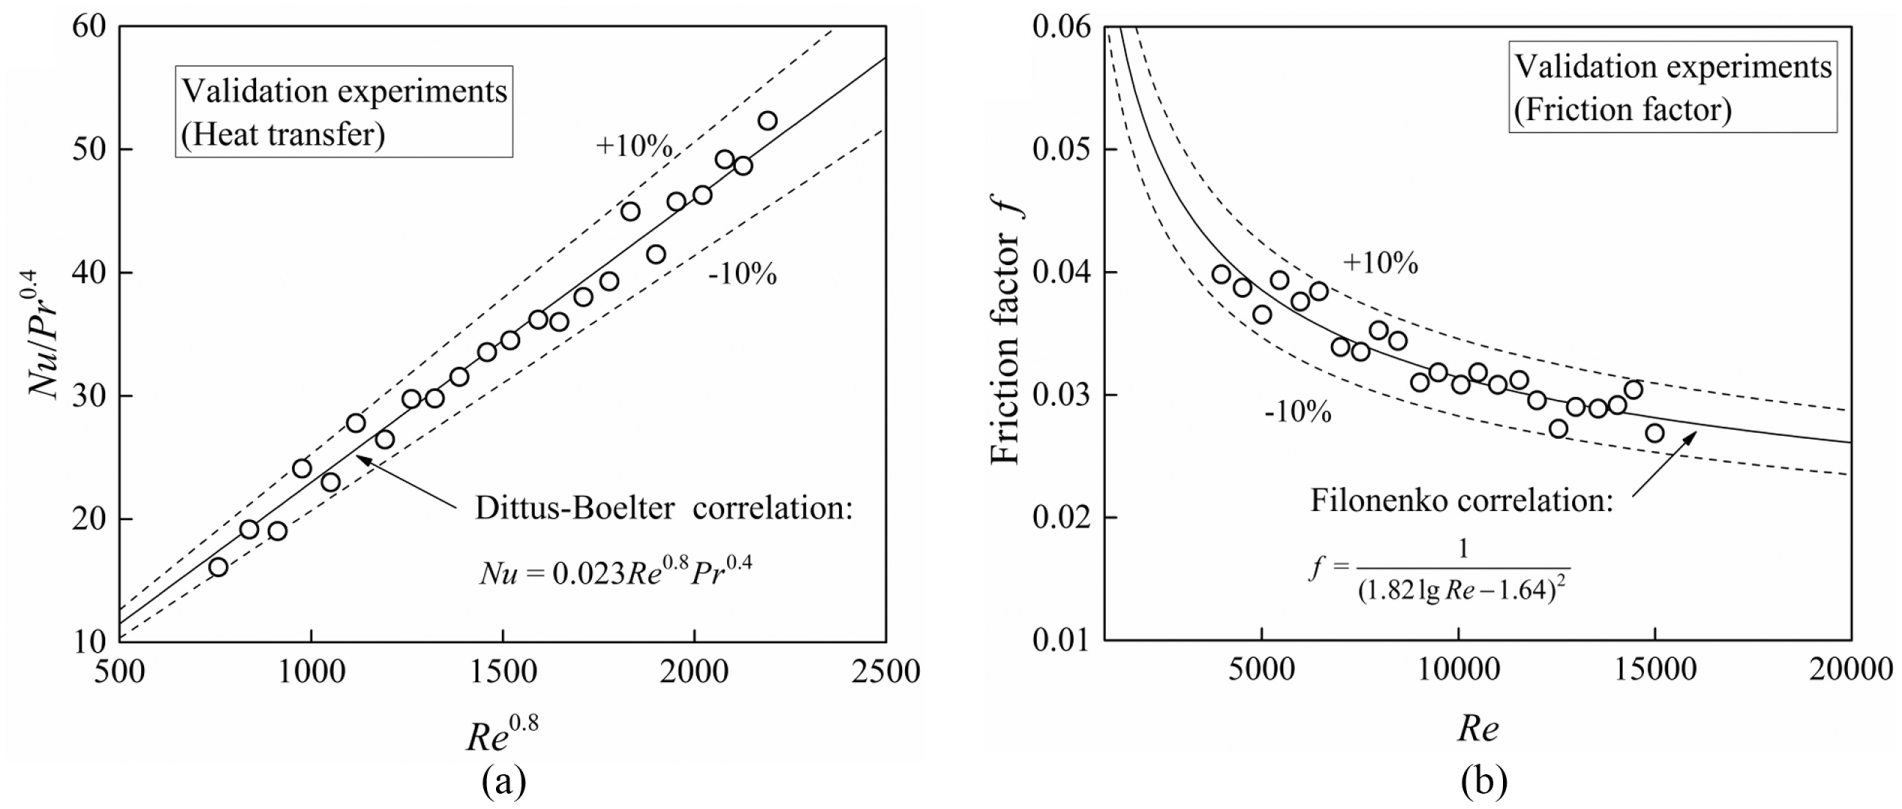
Validation experiments using deionized water.
Thermophysical property of S-CO2
Supercritical fluids have both liquid-like density and gas-like transport characteristics. Low viscosity and high diffusion coefficient are beneficial to the mass transfer process. This special physical property change has a great impact on the heat transfer of the fluid.
Figure 4 shows the physical property of carbon dioxide at p = 7.6 MPa. The specific heat reaches a peak value when the temperature is 305.4 K, which is called pseudo-critical temperature. As shown in Figure 4, the physical properties of S-CO2 change drastically near the pseudo-critical temperature point. The specific heat has an obvious peak at the pseudo-critical point. The density ρ tends to decrease intensely as the fluid temperature increases near the pseudo-critical point. The regularity of dynamic viscosity μ is similar to that of density. The special thermal properties of supercritical fluids will significantly affect the heat transfer characteristics.

Thermophysical property of supercritical CO2.
Heat transfer characteristics under high heat flux and low mass flux
Figure 5 shows the heat transfer coefficient under different heat fluxes at p = 7.6 MPa and G = 400 kg m−2 s−1. The data at the down wall surface of Section III (TC 6) are used. It can be seen that the heat transfer coefficient decreases with increasing heat flux. The heat transfer coefficient has no obvious peak value and the heat transfer coefficient of the fluid is greatly weakened under high heat flux conditions, indicating that heat transfer deterioration happened at high heat flux. Under this condition, buoyancy effect and thermal acceleration effects weaken the heat transfer process of the S-CO2; thus, the heat transfer coefficient reduces. In previous studies, some researchers have proposed several criteria for heat transfer deterioration. Yamagata et al. 19 developed a simple correlation for calculating the boundary for water heat transfer deterioration (q > 0.2G1.2); Kim et al. 20 proposed a heat transfer deterioration criterion for CO2 flowing in a circular tube (q > 2 × 10⁻⁴G2.0). In the above criteria, the unit of q is kW/m2, and the unit of G is kg/m2 s. The Kim criterion fits the working condition of this experiment best. According to the Kim criterion, heat transfer deterioration happened under this working condition.

Effect of heat flux on heat transfer.
Figure 6 shows the relationship between the heat transfer coefficient and the main fluid temperature. Under the working conditions of p = 7.6 MPa, G = 400 kg m−2 s−1, and q = 200 kW/m2, the heat transfer characteristics are different from those under low parameter working conditions. Although there is a peak in the curve of heat transfer coefficient h versus the normalized temperature Tb/Tpc, the peak is quite flat. In addition, the heat transfer coefficient at the down wall is always higher than that at the up wall.

Wall temperature and heat transfer coefficient at Section III.
Effect of buoyancy
For forced convection heat transfer of S-CO2 in a horizontal circular tube, buoyancy effect will lead to asymmetric temperature field distribution on the cross section. The temperature of the up wall is higher than that of the down wall at the same section. The fluids near wall are heated unevenly. Therefore, the density field is not uniform, which would induce a secondary flow. In addition, an M-type velocity distribution may occur, which changes the flow field structure and affects the generation and diffusion of turbulence. Jackson 21 summarized the criteria for the influence of buoyancy on heat transfer in horizontal tubes


In this formula, vb and μb are the kinematic viscosity and dynamic viscosity of the bulk fluid, respectively; g represents the gravitational acceleration; ρb and ρw are the densities based on bulk temperature and wall temperature, respectively.
As can be seen from Figure 6, the up wall temperatures (TC5) are always higher than the down wall temperatures (TC6), indicating that the buoyancy plays a role in the whole region. Figure 7 depicts the relationship between buoyancy criteria Gr/Re2 and Tb/Tpc under the conditions of p = 7.6 MPa, G = 400 kg/m2 s, and q = 200 kW/m2. The result shows that Gr/Re2 is largest at the inlet and is always greater than 10−3 in the whole region. Figure 8 presents the effect of mass flux on heat transfer and buoyancy. As it shown, the buoyancy effect decreases with increasing mass flux. In the pseudo-critical area, Gr/Re2 decreases rapidly.

Heat transfer coefficient and buoyancy criteria at Section III.

Effect of mass flux on Gr/Re2 and heat transfer coefficient.
Figure 9 shows the temperature differences between the up and down wall at Sections I, III, and V. It can be seen that when Tb/Tpc < 1, the values of the temperature difference are all positive and increase gradually with the temperature difference along the tube. When Tb/Tpc is close to 1, the temperature difference on Section I decreases rapidly and gradually approaches 0, and the temperature differences of Sections III and V decrease. As Tb/Tpc becomes far greater than 1, the temperature differences between the upper and lower wall surfaces tend to be stable. This is because when the heat flux is relatively high, the fluid near the wall has a high temperature and a low density, while the bulk fluid has a low temperature and a high density. This density difference generates buoyancy, pushing the fluid near the wall upward, while the bulk fluid moves downward. The large density difference between fluids near the wall surface and the mainstream area will change the flow field structure, inducing secondary flow. Therefore, fluids with strong heat transfer ability gather at the upper wall surface, while those with poor capacity are distributed at the lower wall surface. That is why the temperature of the up wall is higher than that of the down wall. As the inlet temperature increases, the heat transfer of the fluid deteriorates, and the M-shaped velocity distribution appears inside. As the main fluid temperature Tb becomes far higher than the pseudo-critical temperature Tpc, the main fluid density gradually approaches the density of the fluid on the wall surface. The whole fluid is in a gas-like state, and its physical property is close to the normal fluid. The densities of the main fluid and the fluid on the wall surface are almost the same, so the temperature difference gradually approaches zero. For other sections, as the fluid flows, the effect of buoyancy will become weaker, but it will not disappear. That is to say, the temperature difference between the up and down wall still exists, but gradually becomes stable.
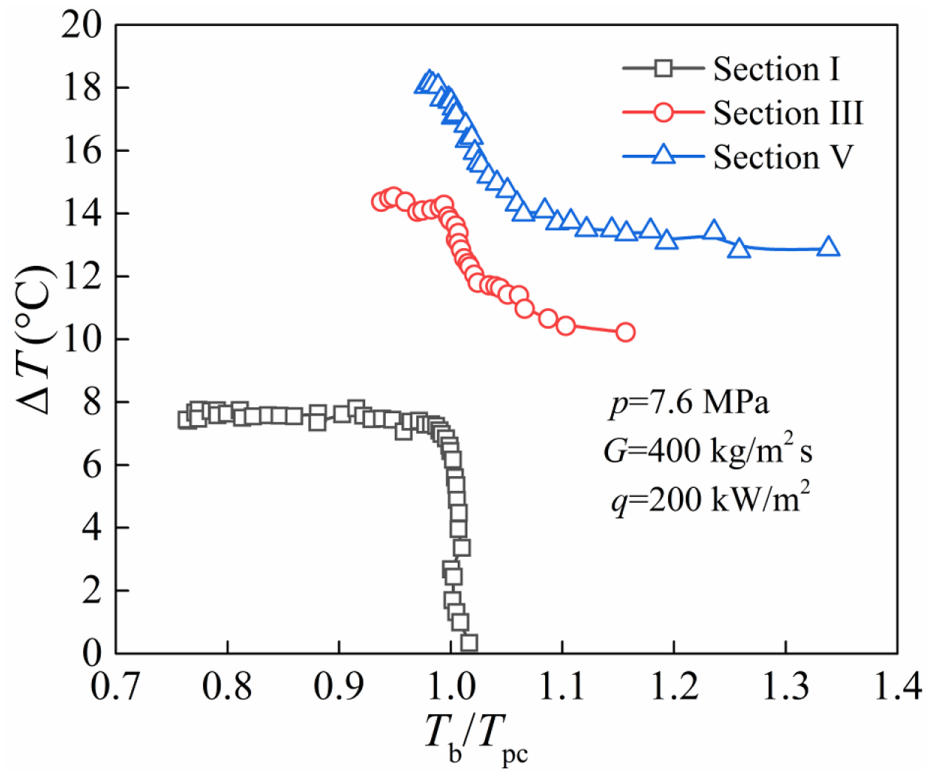
Temperature difference between the up wall and down wall at different sections.
Effect of thermal acceleration
Thermal acceleration is usually caused by the non-uniform density field distribution in the axial direction of the heating channel. When the acceleration effect is obvious, the laminar flow is more likely to be induced, thereby weakening the heat transfer. McEligot et al. 22 studied the heat transfer characteristics when turbulent flow transitions to laminar flow and considered that the transition was caused by the accelerated flow at high heat flux. They proposed a dimensionless criterion number Kv to determine the effect of flow acceleration on convective heat transfer in the tube

in which αp is the expansion coefficient of the fluid. Many scholars have proposed different judgment conditions on the ground of their own experimental analysis results. Based on the experiment results of convection heat transfer of gas flow in tube, McEligot proposed that when Kv ≥ 3 × 10⁻⁶, fluid thermal acceleration will cause laminarization of the turbulent layer, which results in local heat transfer deterioration. Murphy et al. believe that when Kv ≤ 9.5 × 10⁻⁸, the effect of thermal acceleration can be neglected, but when Kv is greater than this value, the thermal acceleration begins to affect the generation of turbulence and the heat transfer effect will decrease. When Kv is higher than 4 × 10⁻⁶, thermal acceleration will drastically affect heat transfer, making the turbulent layer relaminarization.
Figure 10 shows the effect of pressure on Kv. As the figure shows, the effect of pressure on Kv is small, and the maximum value of Kv is about 8.5 × 10⁻⁷. According to the McEligot criterion (Kv ≥ 3 × 10⁻⁶), thermal acceleration of the fluid has little impact on the heat transfer deterioration of this experiment. Besides, Murphy criterion shows that thermal acceleration has a certain influence on fluid heat transfer, but not significant. Under high heat flux and low mass flux conditions, the buoyancy effect is the main influencing factor for heat transfer deterioration in this experiment.

Heat acceleration factor at different pressures.
Parameters effects on heat transfer coefficient
Figure 11 shows the effect of mass flux on the heat transfer coefficient and the inner wall temperature, in which the mass flux varies from 400 to 500 kg/m2 s. As the figure shows, the wall temperature decreases as the mass flux increases, and the heat transfer coefficient increases in the whole region.

Effect of mass flux on heat transfer coefficient and wall temperature.
Figure 12 shows the influence of system pressure on the heat transfer coefficient. As the pressure increases, the heat transfer coefficient changes slightly. The peak of heat transfer coefficient shifts to the right because the pseudo-critical temperatures increase slightly with increasing pressure.

Effect of pressure on heat transfer coefficient.
Comparisons of experimental data with empirical correlations
Up to now, heat transfer empirical correlation is still the main method to calculate the heat transfer of supercritical fluids. In recent years, on the basis of a large number of experiments, many researchers have fitted the heat transfer correlation of S-CO2 under different conditions. Most of them used dimensionless numbers such as Re number and Pr number and fit the experiment data by adding fluid property correction terms. Table 3 lists several typical correlations for supercritical fluid heat transfer.
Heat transfer empirical correlations.

Figure 13 compares the experimental Nu number with the Nu numbers calculated by seven empirical correlations. The result shows that the prediction performance of Liao–Zhao equation fits well with the experimental data. Figure 14 compares the experimental result and the calculation result of Liao–Zhao correlation when the pressure is 8.0 and 8.4 MPa. It can be seen that the calculated value fits the experimental value well. Thus, Liao–Zhao correlation is recommended to calculate the heat transfer coefficient of S-CO2 in horizontal mini-tubes under high heat flux and low mass flux conditions.
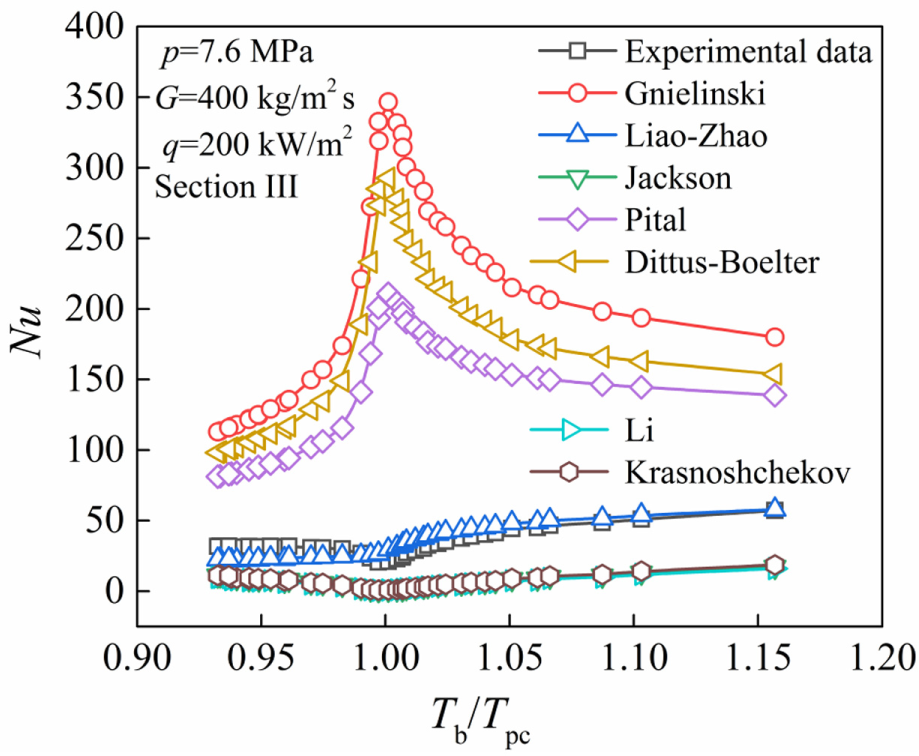
Comparison of the experimental and predicted Nu using empirical correlations.
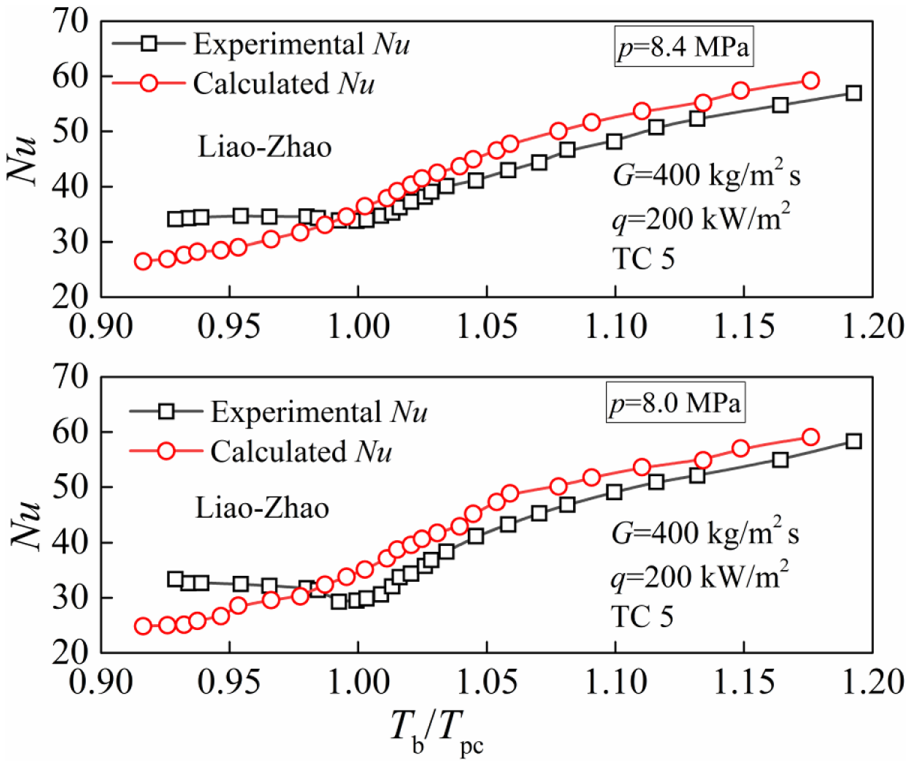
Comparison of the experimental and predicted Nu using the Liao–Zhao correlation.
Conclusion
In this article, the convection heat transfer of S-CO2 in a horizontal tube is studied. The heat transfer characteristics and influencing factors of S-CO2 under high heat flux and low mass flux conditions are analyzed. The main conclusions are as follows:
Under the conditions of high heat flux and low mass flux, the peak of heat transfer coefficient curve is non-significant. When the heat flux is relatively high, the inner wall temperature is always higher than the critical temperature and fluid temperature. At certain sections, the heat transfer coefficient at down wall is always higher than that at up wall.
Under the conditions of high heat flux and low mass flux, buoyancy effect is the main reason for heat transfer deterioration. The dimensionless number Gr/Re2 is taken as the criterion. For the whole region, Gr/Re2 is always greater than 10−3. The effect of buoyancy cannot be neglected when the heat transfer is deteriorated, while the effect of thermal acceleration can be neglected.
The experiment data are compared with several heat transfer empirical correlations. It is found that the Liao–Zhao correlation is most suitable for heat transfer calculation under the conditions of high heat flux and low mass flux.
Footnotes
Appendix 1
Handling Editor: Xiaoxiao Han
Declaration of conflicting interests
The author(s) declared no potential conflicts of interest with respect to the research, authorship, and/or publication of this article.
Funding
The author(s) disclosed receipt of the following financial support for the research, authorship, and/or publication of this article: This research was financially supported by the National Natural Science Foundation of China (grant no. 51479166), China Postdoctoral Science Foundation (grant no. 2018M633546), the Key Research and Development Program of Shaanxi Province (grant no. 2017ZDXM-GY-081), and the Scientific Research Program Funded by Shaanxi Provincial Education Department (program no. 17JK0560).