
Abstract
Experimental and numerical analysis of cavitation flow in the U-shaped throttle valve is presented in this article. Cavitation flow has been analyzed numerically using the volume of fluid model while the pictures are captured by a high-speed camera. The results reveal that the distribution of pressure is extremely inhomogeneous, and the pressure drop zone is mainly distributed in the narrow U-shaped groove. Cavitation bubble occurs around the orifice and develops continuously since the pressure drops. The nascent, developed, and collapsed zone of the cavitation within U-shaped throttle valve are also presented. In addition, a high-speed jet flow is formed when the oil flows out the U-shaped orifice, a vortex appears and cavitation bubbles appear. Then, cavitation evolution and the effect of back pressure and the valve opening on cavitation behavior have been discussed. Increasing back pressure will weaken the cavitation intensity and suppress the cavitation effectively. The valve opening also affects the cavitation flow and performance of the U-shaped throttle valve. With the increase of valve opening, cavitation area first increases and then decreases. The results and conclusions presented in this article give the basis for better understanding the cavitation phenomenon in a throttle valve.
Introduction
Throttle valves are popular on modern hydraulic systems, which needs high-precision control and long lifetime. However, cavitation phenomena should be often found in throttle valves due to the complicated internal structure and high-speed flow. Cavitation is the rapid formation of vapor bubbles caused by a transient reduction in local pressure field. 1 The collapse of cavitation bubbles usually generate noise, vibration, inner wall erosion, and reduce the working lifetime of throttle valves. Therefore, investigation on cavitation flow inside the throttle valve is of great significance to the designing and optimization of the throttle valve with a long operational lifetime.2–4
Many scholars have focused their studies on cavitation phenomena inside hydraulic valves experimentally and numerically. Yi et al. 5 investigated the interactions between the poppet vibration characteristics and cavitation property in relief valves with the unconfined poppet. This study shows that increasing the back pressure could effectively suppress the cavitation. Oshima et al. 6 studied cavitation flow characteristic using a transparent hemisection model of poppet valve. They obtained the effects of cavitation on the characteristics of flow rate, noise level, and pressure distributions. Zou et al. 7 studied cavitation in a spool valve with U-grooves and pointed that the cavitation inside the valve becomes more violent at deeper groove depth. The spool valves studied by Deng et al. 8 were simplified and used in a real servo system, in which a spool consists several groups of notches, such as U-shaped, K-shaped and V-shaped notches. It was shown that the combination of these different shaped notches could lead to a specific flow rate–pressure relation. Lu et al. 9 studied the acoustics of cavitation bubble in a spool valve with U-shaped notches. He found that the frequency peak in the spectra produced by consecutive collapse decreased with the cavitation number, and when the cavitation number was less than a certain value, the time consumed by the bubbles’ collapse in the experiment was shorter than the predicted value. Saha et al. 10 made a dynamic simulation of a pressure regulating and shut-off valve to calculate force field on the spool and hence predict the dynamic spool position. Liu et al. 11 studied the pressure field, velocity field, and cavitation region of the fluid in the throttle valve numerically and experimentally. Hong and Kim 12 investigated the validity of Reynolds equation in a spool valve analysis with respect to cavitation. Their study is carried out for a laminar and isothermal flow between a sleeve and spool with grooves. Furthermore, Simic and Herakovic 13 presented the optimization of the spool and housing geometry in a small hydraulic seat valve, aiming to reduce axial flow forces to a minimum value. Wang et al. 14 reported a computational study on the flow and cavitation phenomena within control valve and the effects of control valve’s structure parameters (including rounded edge, seal cone angle, and outflowing control–orifice structure) on the flow and cavitation characteristics. Actually, the interactions between cavitation flow and parameters of the valve are much more complex problems.
Although many studies have reported on the influence factors of cavitation in valves, such as the inlet flow rate, inlet and outlet pressure, and structure of the orifice, identifying and understanding of cavitation characteristics in the throttle valve are still critically demanded in designing of reliable valves. The aim of this study is to evaluate on cavitation evolution in the U-shaped throttle valve and the effects of back pressure and the valve opening. Qualitative exhibitions of jet flow, velocity distribution, pressure distribution, as well as vapor volume fraction will be presented. Such evaluation provides the engineers a good assistant for geometrical optimization of throttle valves with longer service life and higher-quality performances.
Methods
Experimental method
The schematic diagram and photo of an experimental setup are shown in Figure 1(a) and (b). It mainly contains a reservoir, two control valves, a centrifugal pump, a flow meter, a thermometer, two pressure gauges, a transparent test valve, an energy accumulator, a cooler, and several pipes. They are all connected by pipelines. The inlet pressure and back pressure of test valve are adjusted by a pressure-reducing valve and a back pressure valve, respectively. The inlet and outlet pressure are monitored by the pressure gauge. The flowmeter in upstream is used to record the flow rate of oil passing the test valve, which is a real-time display.

(a) Schematic of mainly experimental setup and (b) real testing system picture.
For visualization purposes, a transparent valve which is made of polymethylmethacrylate (PMMA) is used. The illumination is provided by an optical-fiber source (LA-100USW). A high-speed camera (Hispec 3, maximal frame rate up to 93,282 frames per second) and the optical-fiber source are mounted at both sides of the valve, which stands in a straight line. Ideal illumination, short exposure time, and good spatial distribution of transparent valve ensure that the camera can catch the cavitation flow inside the valve. As the hydraulic system where water is often used, which is often hard to seal, low system pressure and cavitation bubble occur shorten the lifetime of the valve. Petroleum-based hydraulic oil (VG46) is used as a fluid medium in our experiment, which is preheated before the test. The cooler was used to keep the oil temperature at about 42°C ± 2°C during the experiment. The energy accumulator before the reducing valve stores some pressure fluctuations energy to stabilize the system pressure. In order to enhance the ability of transparent throttling valve to bear high pressure, a new reinforced valve was designed whose maximum pressure could larger than 10 MPa. 15 The experimental data are recorded only when the stable flow is reached.
Numerical method
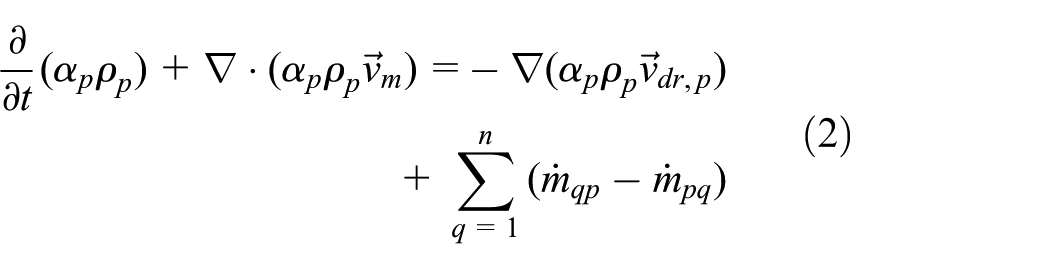
In this study, the commercial software FLUENT is employed for numerical calculation. Since the actual movements of oil inside the valve are very complex, the renormalization group (RNG) k-ε turbulence model is applied because of its advantage in disposing flows with a high strain rate and streamline curvature. To compute the cavitation phenomena in the U-shaped throttle valve at different conditions, the mass and momentum and the continuity equation are used as governing equations. Flow equations for a two-phase mixture are obtained from the ensemble averaging of the Navier–Stokes equations. Flow governing equations for a two-phase mixture are as follows3,16

where
From the continuity equation for secondary phase p, the volume fraction equation for secondary phase p can be obtained by the following equation
Rayleigh–Plesset equation is selected to simulate the cavitating flow. By ignoring the relative sliding velocity and volume force between the bubble center of mass and the liquid phase, the Rayleigh–Plesset equation can be written as follows 11
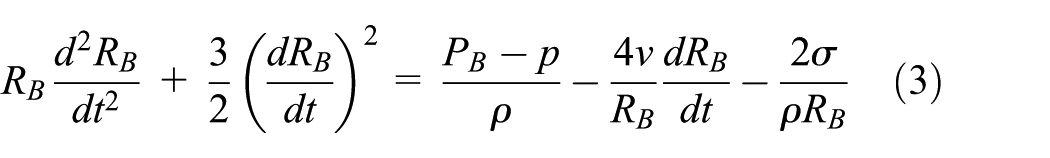
where RB is the bubble radius, PB is the pressure inside the bubble, p is the pressure in the liquid far away from the surface, ν is the kinematic viscosity of the liquid, and σ is the surface tension. In our simulation, the initial conditions are in accordance with the experiments. By solving the above equations, the cavitation flows inside the U-shaped throttle valve could be obtained.
Computational fluid dynamics simulation model
In this study, the valve consists a pair of symmetric U-shaped grooves on both sides of the neck, which could be seen in Figure 2(a). Figure 2(b) shows the simulation model used in our numerical analysis, whose size and structure are the same as the transparent throttle valve used in our experiment. Considering the flow channel of U-shaped throttle valve is symmetrical, and a half structure is used to reduce the calculation time. To capture the main characteristics of the flow, the mesh is more refined to adapt the flow-field changes. The leakage between the spool and the sleeve is neglected. The liquid density is 889 kg/m3, and the kinetic viscosity is 4.0 × 10⁻⁵ m2/s. The inlet pressure Pin is fixed at 6, 5, and 4 MPa, respectively, while the outlet pressure P2 varies so that different pressure drops could be received. We assume that (1) the oil is an incompressible fluid and (2) an adiabatic process is generally obtained in our research, and the gravity is also ignored.

(a) Three-dimensional structure of the U-shaped throttle valve and (b) CFD simulation model and boundary conditions.
In order to ensure the calculation precision and reduce the calculation resources, the grid independence is verified in our article. Table 1 shows the grid independence analysis results with the typical working condition of Pin = 6 MPa and Pout = 1.2 MPa. It presents the maximum flow rate of the oil inside the valve at different grid numbers, which increases slightly with increasing grid number. In these tests, the grid number varies from 1,213,355 to 1,554,353, the maximal velocity increases from 89.09 to 89.13 m/s, and the increment ratio is only 0.045%. The maximal velocity is basically consistent, but the computing resources are significant increased. The tendency of maximal velocity demonstrates that the model solution is relatively independent on the grid density. Considering computational resources, the mesh numbers 1,213,355 is considered to meet the requirements.
Mesh refinement study.

Results and discussions
In this study, computational fluid dynamics (CFD) simulations and experimental investigations are used to investigate oil flow properties, such as jet flow, velocity distribution, pressure distribution, and vapor volume fraction inside the U-shaped throttle valve while the opening is 49%.
Characteristic of cavitation flow inside U-shaped throttle valve
Figure 3(a) is the cavitation phenomenon in the valve port which is recorded by a high-speed camera while the inlet pressure is 5 MPa and the back pressure is 0.6 MPa. Noticeable cavitation phenomenon appears in the U-shaped throttling grooves. When the fluid flows through the U-shaped orifice, a radial jet flow could also be observed. This jet flow impinges toward the housing wall near the exit port, forming a vortex area and leading to energy loss. The existence of the vortex is the reason for cavitation bubbles generation. Figure 3(b) is the enlarged area of the red box in Figure 3(a). According to cavitation flow characteristics, 17 the cavitation area could be divided into three regions in Figure 3(b), such as nascent zone, developed zone, and collapsed zone. After the nascent cavitation, cavitation bubbles develop and increase gradually along the flow direction, and the length of the development zone is related to back pressure. 8 Then, the bubbles collapse rapidly due to increasing pressure, turning to a fine mist expanded state finally. Usually, the collapse of cavitation bubbles and subsequent pressure recovery generate high-speed jet flow and may damage the surface of the hydraulic components. Figure 3(c) shows the velocity contours and streamlines obtained numerically, which shows that a vortex located near the corner of the body, whose position agrees well with experimental result in Figure 3(a).

(a) Cavitation flow in valve port obtained by a high-speed camera, (b) enlarger of cavitation zone, and (c) velocity contours and streamlines.
Figure 4 illustrates the pressure distribution and velocity contours inside the U-shaped throttle valve. It can be found that the maximum pressure is located in the upstream of the flow channel, while the minimum pressure is located in the downstream. This pressure distribution in the flow field is similar to the results of Liang et al. 18 When the fluid travels through the U-shaped groove, the pressure reduces drastically, and low-pressure regions form. This narrow pressure drop zone is mainly distributed in the narrow U-shaped groove, which become the locations of cavitation source. It is worth pointing out that the downstream pressure returns to the back pressure immediately. Therefore, the back pressure has an important role in cavitation flow. Furthermore, Figure 4(b) also shows that the velocity increases to a maximum value of 95.5 m/s, near the U-shaped orifice. This high-speed flow may make the fluid separated from the housing wall, then appear as a narrow vacuum zone and create a large cavitation region on the upper part of the U-shaped throttle orifice. The computed narrow vacuum zone formed by the jet impingement wall in Figure 4(b) is in good agreement with cloud-like cavitation area along the jet flow as shown in Figure 3(a).
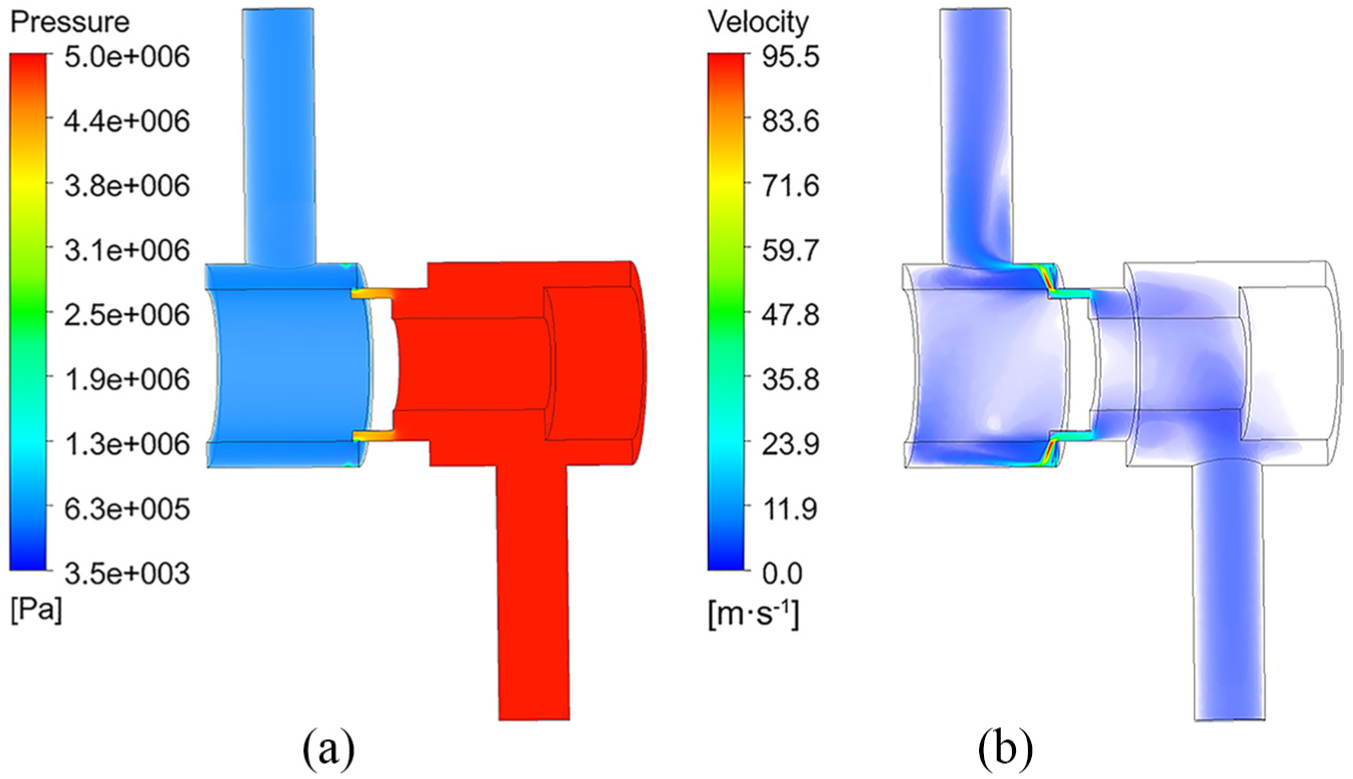
(a) Pressure distribution and (b) velocity contours in the U-shaped throttle valve.
The variation of pressure is an important factor in the geometrical optimization of the valves, so the profiles of pressure drop along the primary flow direction are extracted in Figure 5. The back pressure is fixed at 1 MPa, while the inlet pressure is set as 4, 5, and 6 MPa, respectively. The streamtrace is the center of the flow channel, several points (A, B, C, D) are selected in this specified streamtrace to investigate the pressure drop in Figure 5. When fluids enter the U-groove along the streamtrace, pressure decreases slowly at the beginning. From point B to point C, corresponding to the valve orifice, the pressure drops rapidly. The minimum pressure could be found near the point C, and then it increases again due to the appearance of a vortex shown in Figure 3(c). When the fluid flows out of the orifice, the pressure tends to be stable. Although the inlet pressure varies from 4 to 6 MPa, the pressure distribution of the streamline is the same. Therefore, the U-groove acts as the main throttling function of the throttle valve.

(a) Schematic diagram of streamtrace and (b) pressure distribution along the streamtrace.
Influence of back pressure on cavitation flow
It is well known that increasing the back pressure is an effective way to suppress cavitation. 19 In our experiments, different back pressures (from 0.4 to 1.2 MPa) are set for obtaining cavitation flow characteristics in the U-shaped throttle valve, as shown in Figure 6. We take the inlet pressure 6 MPa as an example. For getting better measurement results, the brightness of the illumination and position of the camera should be kept constant across all experimental conditions. Figure 6(a) shows that the intensity of cavitation decreases with increasing back pressure. When the back pressure is 0.4 MPa, the intensity of cavitation is strongest. Increasing the back pressure will weaken the cavitation intensity and effectively suppress the cavitation. 5 All the observations of the occurrence and locations of cavitation and the variation laws of cavitation intensity in Figure 6(a) can be proved by CFD simulation results in Figure 6(b). In contrast, a slightly greater difference about cavitation areas is notable among the predicted values and the experimental ones. This is probably due to the effect of non-condensable gases that may be dissolved in the hydraulic oil affecting cavitation intensity but that are not considered by our simulational model. Furthermore, the liquid’s compressibility, temperature variation, machining tolerance, and so on should be taken into consideration for the differences between the numerical results and the experimental results.

(a) Experimental and (b) simulation results of cavitation bubble.
Figure 7 shows the pressure distribution and velocity streamlines in the U-shaped throttle valve under different back pressures. Due to the complexity of the valve structure, the distribution is extremely inhomogeneous. 19 It is obvious that there is a pressure-drop zone around the U-shaped groove. As mentioned earlier, the high-speed jet hits the housing wall near the exit port, so the lower pressure appears near the export. It also can be seen that there is a so-called “cavitation region” that appears where the static pressure is smaller than the vaporization pressure of the oil.20,21 With the increase in back pressure, the pressure in the downstream also increases. It is hard to find cavitation bubbles in the U-shaped throttle valve with higher back pressure. Furthermore, Figure 7 also shows that streamlines distributions in this flow channel are similar to pressure distributions. The oil travels from the input port and increases its speed at the orifice due to the throttle effect of the orifice. Part of it hits the housing wall, forming a vortex and the remaining parts flow out from the output port. This vortex is the main reason for the hydraulic loss, which also could lead to unsteady flow. 19 With increasing back pressure, the location of the vortices remains the same, but the density weakens at the corner. In addition, the density of the flow at the orifice also weakens, causing variations in valve performance.
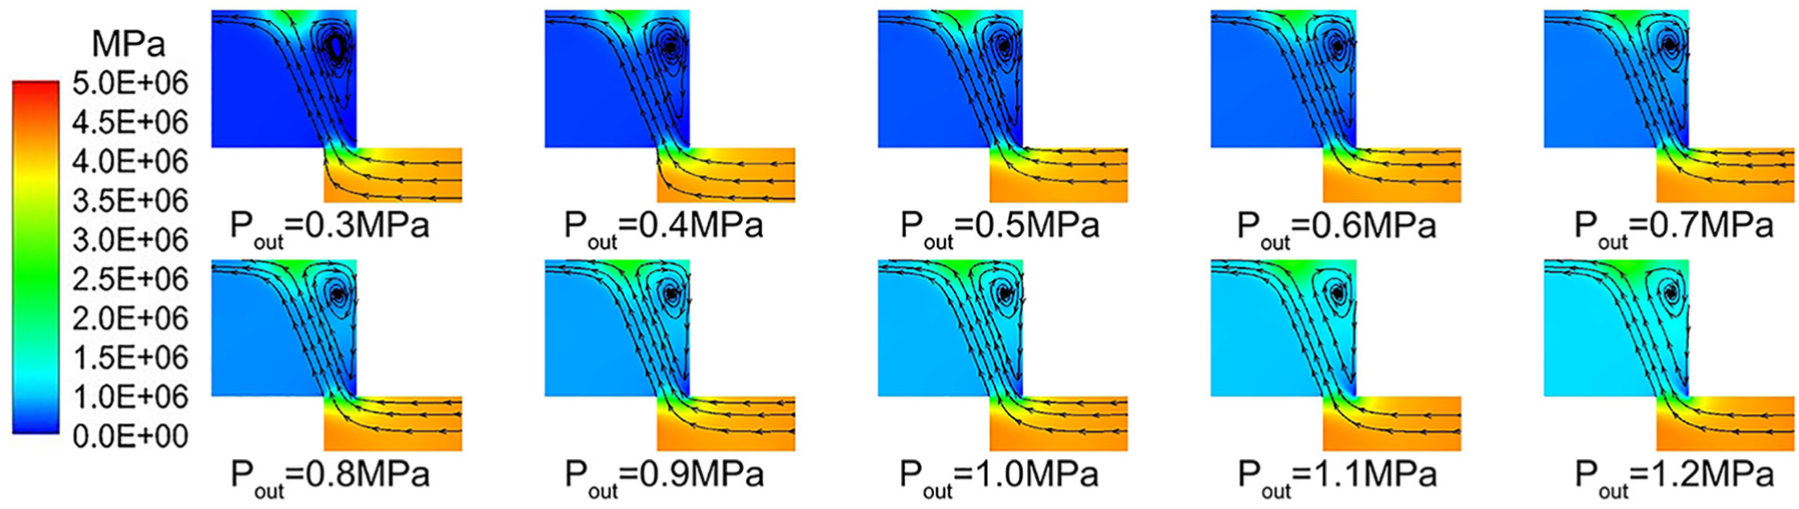
Pressure distribution and streamlines in the U-shaped throttle valve under different back pressures.
Since the valve is used for controlling flow, high-speed local area is inevitable. Figure 8 shows that the maximum velocity drops almost linearly with back pressure. When the back pressure increases from 0.2 to 1.2 MPa, the maximum velocity decreases from about 110.95 to 99.73 m/s, the decreasing amplitude is approximately 10%. Furthermore, the highest velocity for 6 MPa is 110.9 m/s, and 98.37 m/s for 5 MPa, while it remains 87.14 m/s for 4 MPa. They are approximately 11.3% and 21.4% lower than 6 MPa.

The maximum velocity under different back pressures.
The cavitation phenomenon can also be represented by using the vapor volume fraction. As we discussed earlier, the cavitation flow in the U-shaped throttle valve is symmetrical, we only focus on cavitation distribution in the upper radial flow channel at the distance 0.05 mm away from the wall, shown in Figure 9(a). Figure 9(b) shows the distribution of the vapor volume fraction in the U-shaped throttle valve under different back pressures. From these figures, it can be found that the value of vapor volume fraction reaches the peak at the orifice. The value of vapor volume fraction decreases and the cavitation region shrinks while the back pressure increases from 0.3 to 1.2 MPa. In addition, with the increasing back pressure, the cavitation region transfers from the center to both sides and the intensity of cavitation bubbles decreases.
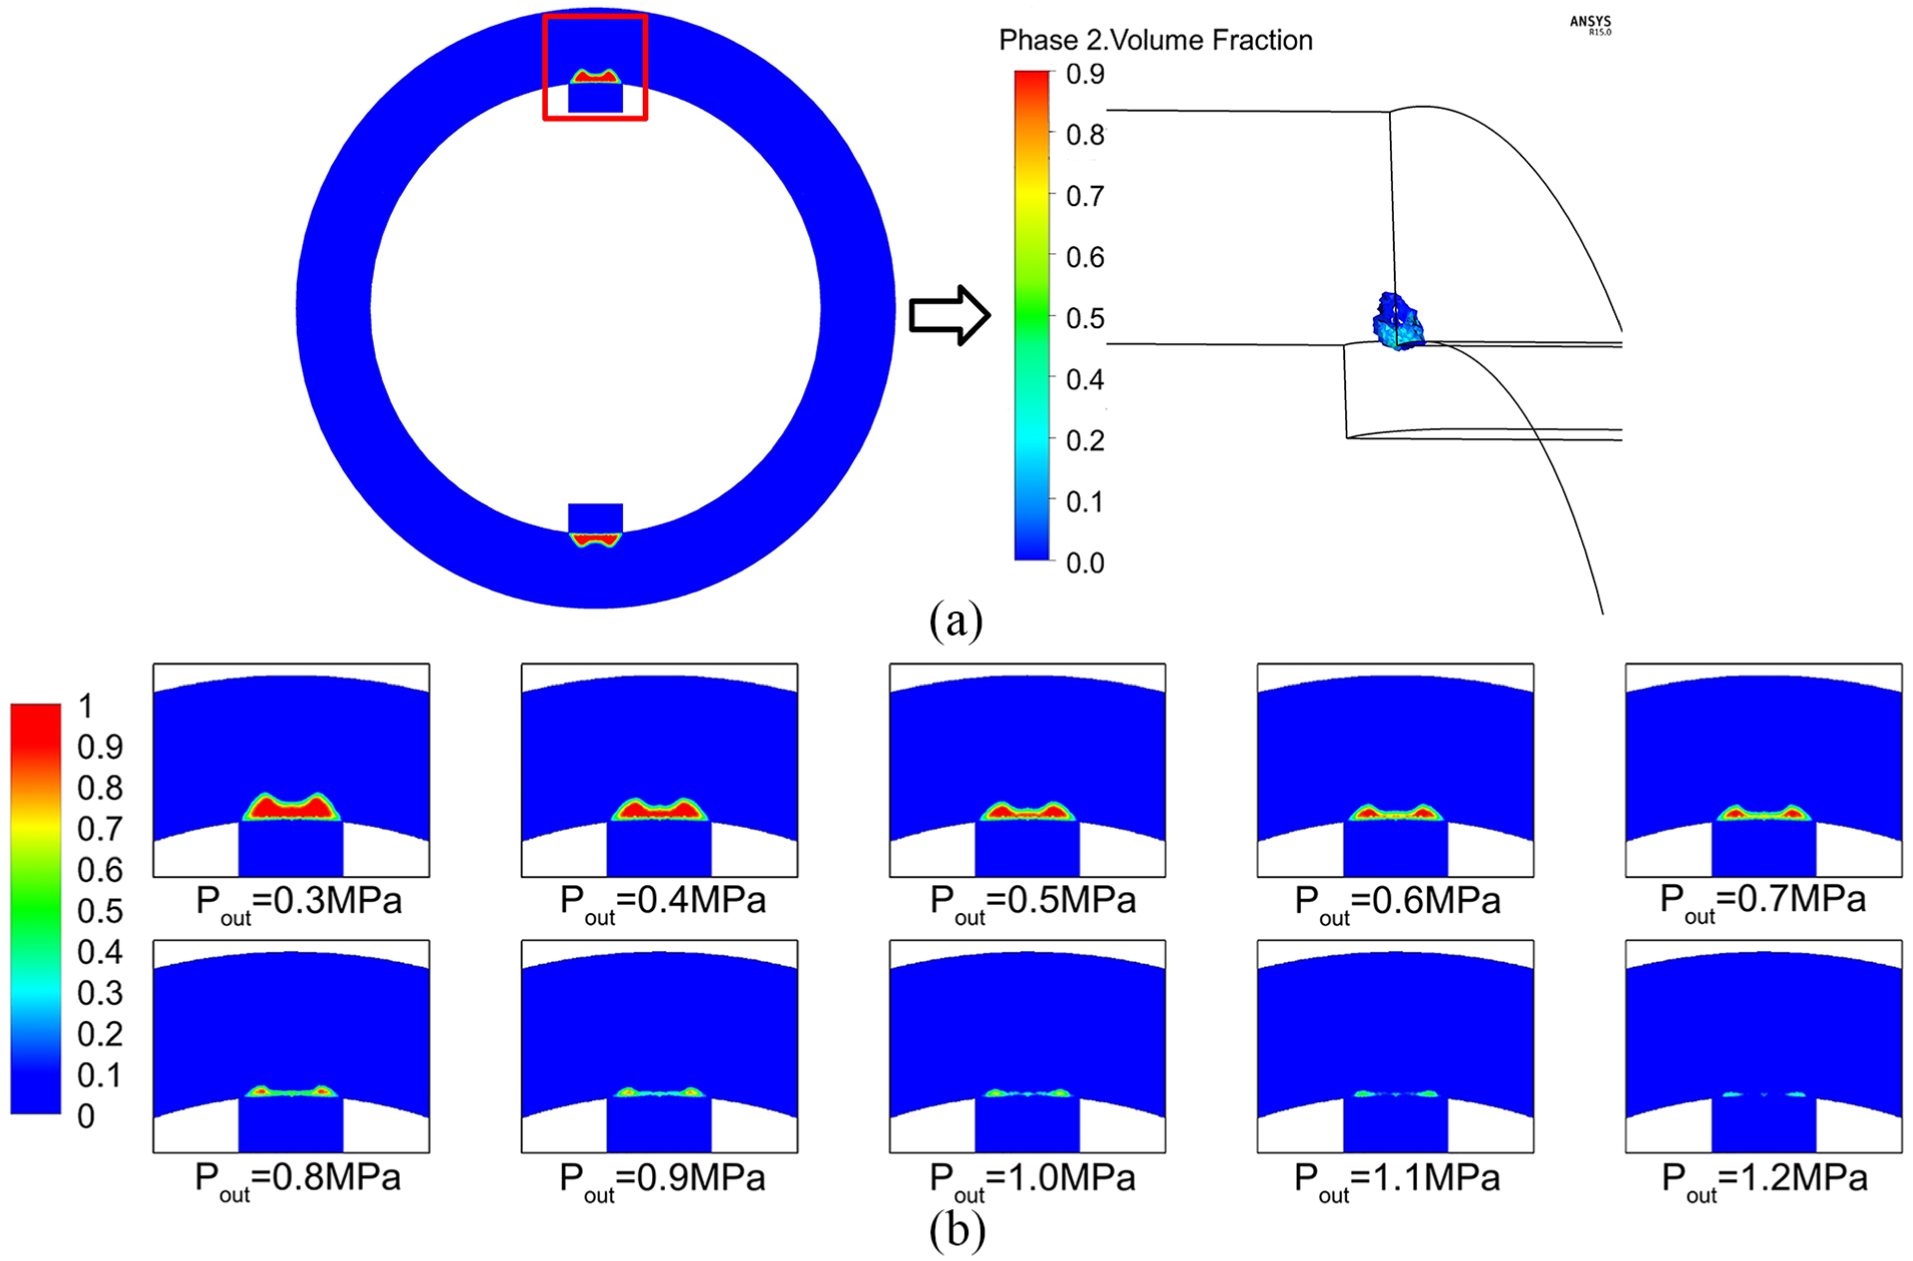
(a) Cavitation distribution in the upper radial direction and (b) the contour of vapor volume fraction in the throttle valve under different back pressures.
Figure 10 reports cavitation area as functions of back pressures. The symbol square in the Figure 10 represents inlet pressure 6 MPa, while the symbol circle and triangle represent inlet pressure 5 and 4 MPa, respectively. It can be seen from these curves that the increase in the back pressure reduces the cavitation area. Furthermore, it can be seen that the cavitation decreases linearly with increasing back pressure, although the input pressure varies from 4 to 6 MPa. Obviously, increasing the back pressure is effective in suppressing cavitation inception.

Cavitation area under different back pressures.
Influence of valve opening on cavitation flow
The valve opening is one of the most important factors, which has a direct influence on response characteristics and performance dynamics of the U-shaped throttle valve. Figure 11 demonstrates the variation of cavitation flow, with respect to the valve opening within the U-shaped throttle valve, while the import pressure is 5 MPa and output port pressure is 1 MPa. There is a good agreement between the numerical and experimental results in this context: large cavitation region is caused at the small opening valve. As expected, the cavitation inside the flow channel is symmetrical and mainly distributed at the orifice. There is also a jet flow along the fluid streamline, hitting the housing wall and forming a vortex. As we know the role of valve opening is to control fluid flow, which is related to the valve performance,more oil flows through the orifice in lower velocity with increasing valve opening, so the intensity of cavitation is weaker in the U-shaped throttle valve under larger opening.
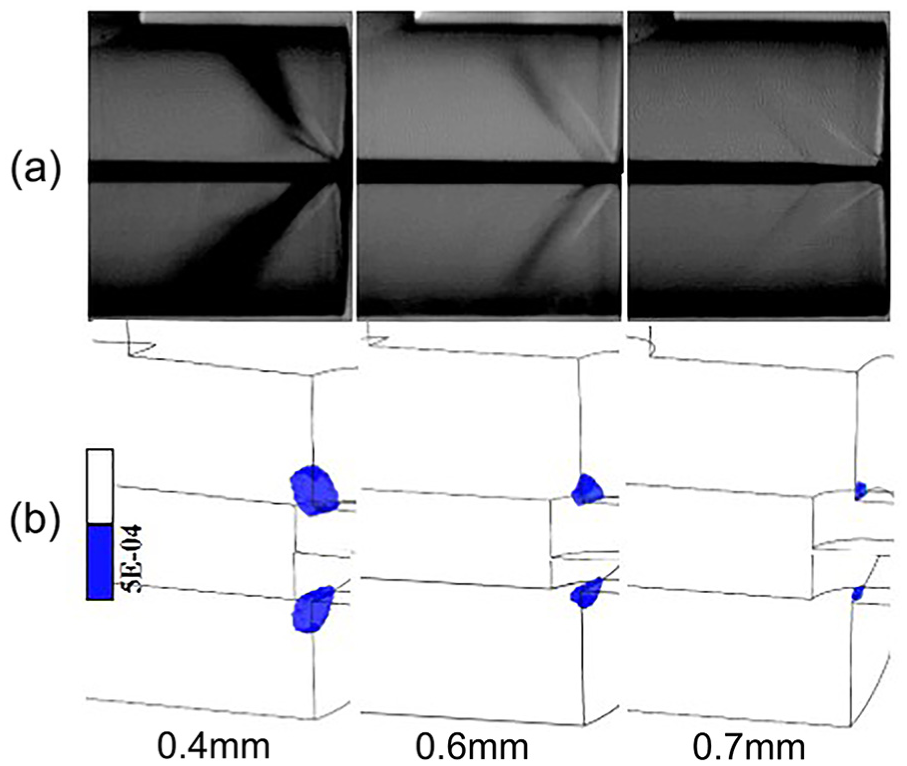
(a) Experimental and (b) numerical results of cavitation flow in the U-shaped throttle valve at openings of 33%, 49%, and 57%.
Bubbles escape from the liquid and flow with the stream when the environment pressure is lower than the equilibrium pressure between the air and the fluid 22 , and finally, they will collapse. 21 Therefore, the minimum pressure determines the cavitation and its occurrence area. Figure 12 is the relationship between the minimum pressure and the valve opening. When the valve opening is smaller than 49%, the minimum pressure is always lower than the equilibrium pressure of the oil. Cavitation could be observed clearly in the visualized flow field from the experimental results in Figure 11. The difference between 4, 5, and 6 MPa at these small valve openings is not obvious. While the valve opening varies from 57% to 82%, the minimum pressure increases and is larger than the equilibrium pressure 3540 Pa, where it is hard to observe cavitation occurrences at these large openings.
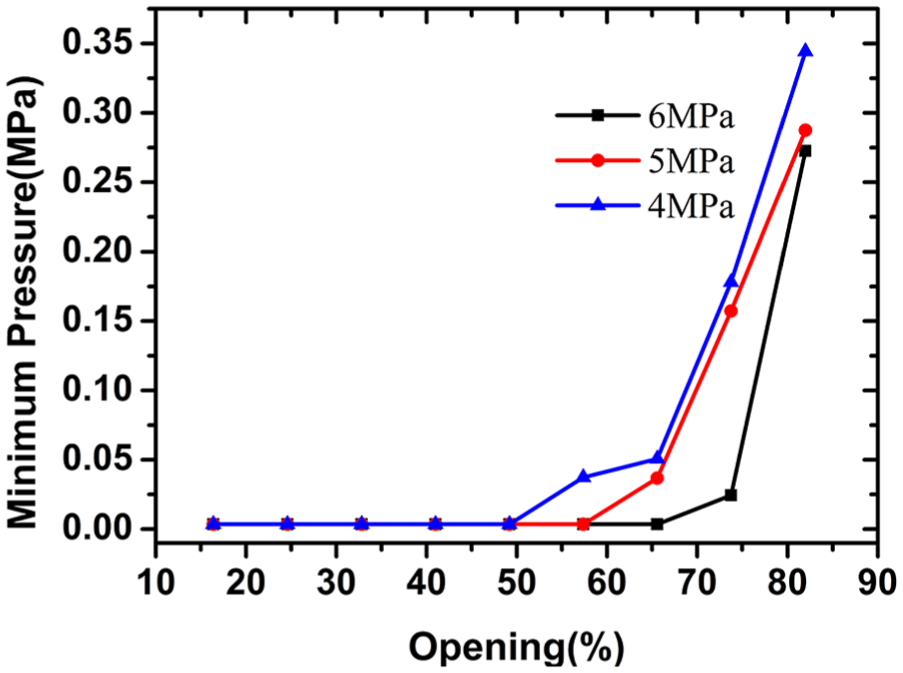
The difference of minimum pressure at different valve openings.
Figure 13 shows the maximum velocity in the U-shaped valve at different openings. Tests were carried out for the valve opening from 16% to 82%. It is clear that the maximum velocity varies with the valve opening and the input pressure. As discussed earlier in Figure 7, the highest velocity appears near the orifice and the corner of the U-shaped valve, which is the reason for severe cavitation erosion. In Figure 13, the maximum velocity is located at an opening of 33%, and before and after 33%, the maximum velocity drops. Furthermore, the curves in Figure 13 also show that all the maximum velocities increase first and then decrease inside the U-shaped valve with different input pressures.
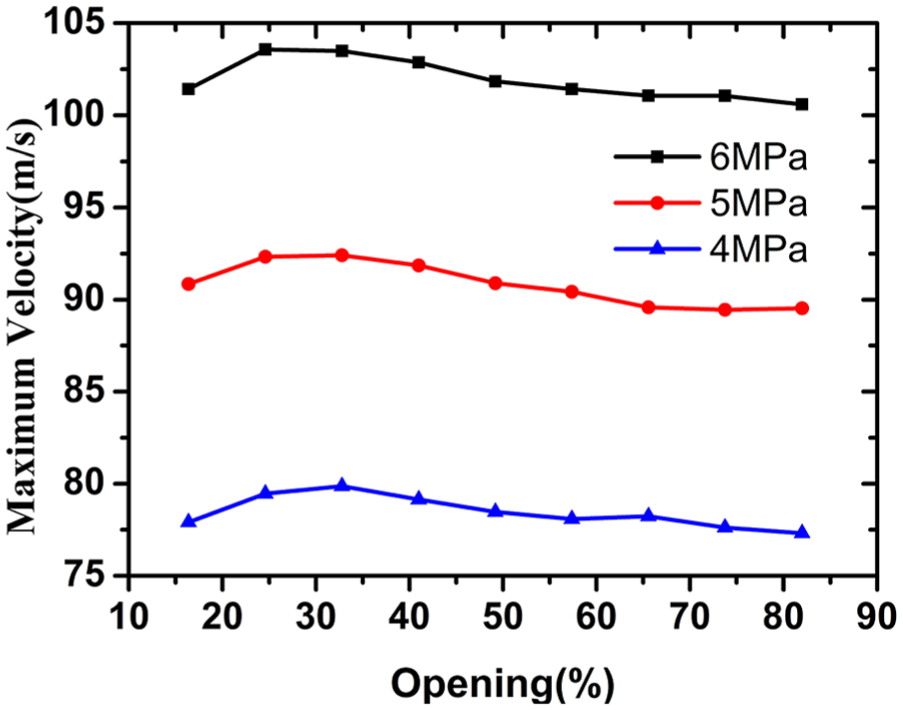
Variation of maximum velocity at various openings.
In order to better understand the cavitation-induced damage mechanism, the cavitation area in the U-shaped throttle valve at different openings is presented in Figure 14. It shows that cavitation area increases first and then decreases, which agrees well with the reports. 14 When the opening is close to 33%, the area of cavitation reaches its peak. At this time, cavitation mainly occurs around the orifice, bubbles stick to the valve’s surface to form the sheet cavitation and expand along the surface. This cavitation bubble–induced damage may be more serious than other cases. When the valve opening increases from 33% to 74%, the unstable bubbles at the end of sheet cavitation begin to break and wash downward. A traveling cloud cavitation will be formed, and the cavitation area decreases gradually. When the opening is large enough, such as 82%, cavitation cannot be found in the valve. In general, the valve opening plays a very important role in the performance of the U-shaped valve.

Variation of cavitation area at various openings.
Conclusion
Computational simulation and experimental examination are carried out to figure out cavitation flow in the U-shaped throttle valve. The high-speed zone is mainly located near the orifice, which determines the performance of the throttle valve. When the fluid travels through the orifice, a high-speed jet flow will form, resulting in a vortex near the corner of the U-shaped throttle valve. The existence of the vortex is the reason for cavitation bubbles generation. Furthermore, the effects of back pressure and the valve opening on the flow and cavitation characteristics also have been investigated in detail. With increasing back pressure, the cavitation intensity decreases at the same valve opening. The cavitation area increases first and then decreases as the valve opening is increased. While the opening is smaller, bubbles stick to the valve’s surface and form the sheet cavitation. These unstable bubbles would wash downward as the valve opening becomes larger, and the cavitation area decreases. The results presented in this article provide valuable insight into the cavitation behavior, evaluating the performance of key parts of the valve.
Footnotes
Handling Editor: Oronzio Manca
Declaration of conflicting interests
The author(s) declared no potential conflicts of interest with respect to the research, authorship, and/or publication of this article.
Funding
The author(s) disclosed receipt of the following financial support for the research, authorship, and/or publication of this article: This work was financially supported by the National Key Research and Development Project (grant no.: 2016YFC0802908), the National Natural Science Foundation of China (grant no.: 51875559), the Natural Science Foundation of Jiangsu Province (grant no.: BK20171189), the Six Talent Peaks project in Jiangsu Province (grant no.: ZBZZ-008), and the Priority Academic Program Development of Jiangsu Higher Education Institutions (PAPD).