
Abstract
A series of experiments were performed to investigate the thermodynamic instabilities that occur during heating of supercritical endothermic hydrocarbon fuel. A “power–temperature drop” characteristic curve is used to analyze the mechanism of thermodynamic instabilities. The results indicate that the heat-transfer process in a heated tube with increasing heating power can be divided into three periods: stable, developing, and instable; in which, the thermodynamic instabilities are found to occur. When the outlet fuel temperature reaches the pseudo-critical temperature, an acute decrease in fuel density and viscosity causes the flow to change from a transition flow to a turbulent flow, and the sharp increase of heat transfer in turbulent flow increases the thermodynamic instabilities. The intensity of the instability is related to the kinetic energy of the flow and the oscillatory extent. When the mass flow rate is increased from 1.0 to 1.5 g/s, the effect on the flow’s kinetic energy dominates the change in instability which causes the intensity of the instability to increase. While the intensity of the instability decreases with increasing inlet fuel temperature, which results from the decrease of the oscillatory extent. The effects of the operating pressure on the instability are not linear because of the properties of fuel change, obviously with pressure near the critical point.
Keywords
Introduction
As one of the most potential options for the hypersonic air-breathing propulsion system, the scramjet has attracted an increasing attention worldwide, 1 but the aerodynamic heat attributed to high-speed flight is still a challenge for the current engine technology. Several cooling methods have, therefore, been put forward, and the regenerative cooling technology which uses endothermic hydrocarbon fuel as coolant is recognized as the most effective method.2–5 The operating pressure and temperature of the cooling channel are almost higher than the critical pressure and temperature of the endothermic hydrocarbon fuel, requiring fuel temperatures in, through, and beyond the critical region. The stable fuel flow during regenerative cooling progress has a significant influence on the safe operation of a scramjet engine for its direct influence on the thermal protection and combustion. If not, oscillations of the flow rate and system pressure can cause mechanical vibrations, system control failures, and, in extreme circumstances, disturb the heat-transfer characteristics, causing heat-transfer surface burnout.
However, large fluctuations in fluid mass flow rate, pressure, and temperature have been observed in convective heating at supercritical pressures, with different fluids such as water, 6 hydrogen, 7 and hydrocarbons. 8 Uncontrolled, the large cyclic pressure and thermal transients have catastrophically reduced the life of heat exchanger components. 9 The tests with JP-7 (jet propellant-7) fuel as a coolant showed that the instabilities often lead to critical failure in thin-walled test sections because the flow oscillations cause the tube to resonate when matching its natural frequency. 10 On the other hand, it was noted that heat-transfer enhancement only occurred with the higher frequency lateral oscillations,9,11,12 the presence of the oscillations could substantially increase the fuel-side heat-transfer coefficient, lowering metal temperatures and potentially increasing heat exchanger life, reducing its weight, and allowing better utilization of the fuel heat sink.13,14
Much work has been done on the instability of endothermic hydrocarbon fuel flow at supercritical pressure. The pressure-drop type instability of supercritical endothermic hydrocarbon fuel was experimentally investigated in a horizontal straight tube, and the mechanism of the instability was investigated using a zero-dimensional homogeneous model. The results indicated that there are two instable regions in the supercritical hydrocarbon fuel cooling system, namely the critical temperature region and the cracking temperature region, and the relative density change rate is the decisive factor which causes the system to be instable. 15 In a convective heat-transfer experiment with kerosene-kind hydrocarbon fuel electrically heated in a small-scale channel at near-critical pressures, thermodynamic instabilities of fuel flow take place when the fuel bulk temperature is lower than pseudo-critical temperature while the tube wall temperature is higher than pseudo-critical temperature, and the fuel flow regains stability when the fuel bulk temperature is higher than pseudo-critical temperature. 16 Likewise, in a series of heat-transfer experiments with JP-7, the instabilities were found in all tests conducted at supercritical pressure, supercritical wall temperature, and subcritical bulk fuel temperature. 17 The linear and interactive effects of heated test section’s length, diameter, mass flow rate, inlet temperature, and heat flux on the instabilities of supercritical JP-7 flow were also determined, which indicated that heat flux has a significant effect on the instabilities interactive with both mass flow rate and inlet temperature. The model coefficients of inlet temperature are negative, while the model coefficients of mass flow rate are positive. 10 Moreover, large fluid flow, pressure, and temperature oscillations had been observed in the experiments with JP-7 and methyl cyclohexane for upward flow in vertical tubes under high heat flux, the instabilities generally occurred with reduced pressures below 1.5 g/s and tube wall temperature above the pseudo-critical temperature. 18 It was found that a turbulating insert can be used to stabilize the oscillation due to the supercritical hydrocarbon fuels pressure. 19 In addition, pressure oscillations in supercritical Jet-A fuel flowing through four parallel, heated tubes connected to common manifolds had also been observed, the results indicated that the amplitudes of the oscillations increased as fuel inlet temperature was increased, and the oscillations had frequency content ranging from 0.5 to 3 Hz. 20
However, all the previous work focused on the effects of operating parameters on the instabilities and the range of conditions that trigger the instabilities. The generating mechanism of instability in supercritical fuel flow and the action mechanism of operating parameters on the instabilities are still unclear. Therefore, the thermodynamic instability in supercritical fuel flow is experimentally investigated to determine the generating mechanism of thermodynamic instability and the action mechanism of operating parameters on the instability.
Experimental facilities and instability starting point
Experimental facilities
As shown in Figure 1, an experimental setup was established to study the instability of fuel flow in a scramjet engine’s regenerative cooling system. The pre-heater was used to adjust the inlet temperature to the desired values, and the back-pressure valve was used to adjust the operating pressure to the desired values. The test section is a vertical straight 304 stainless steel circular tube of 300-mm long, 1-mm thick, and 3 mm in outer diameter and was heated by AC power during the experiment.
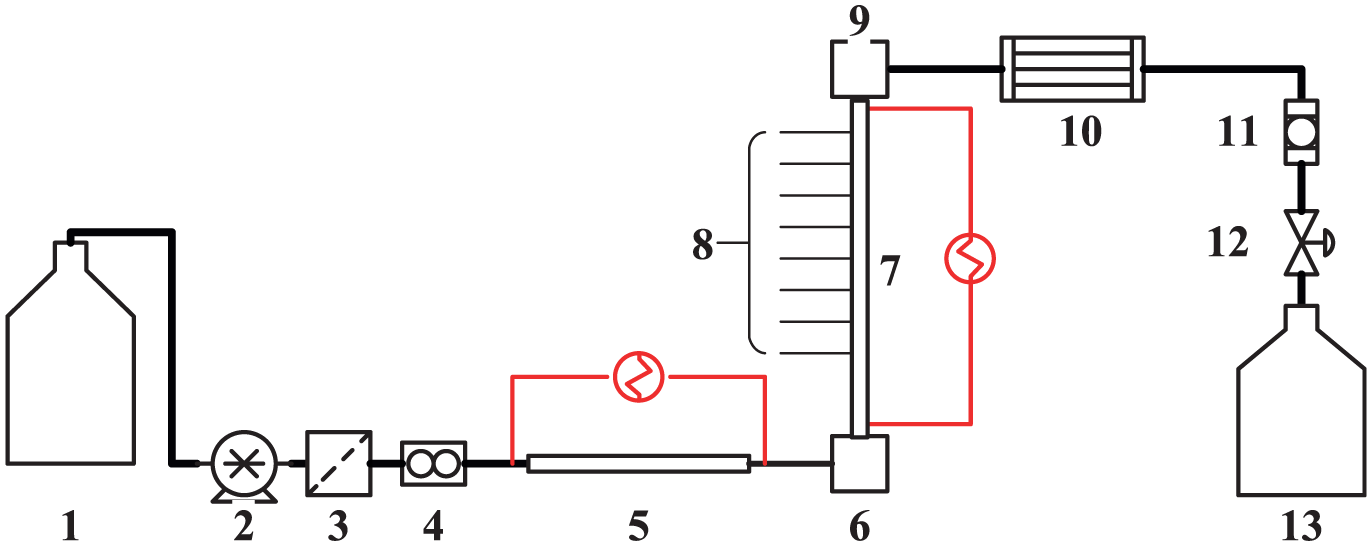
The simplified schematic drawing of test facility.
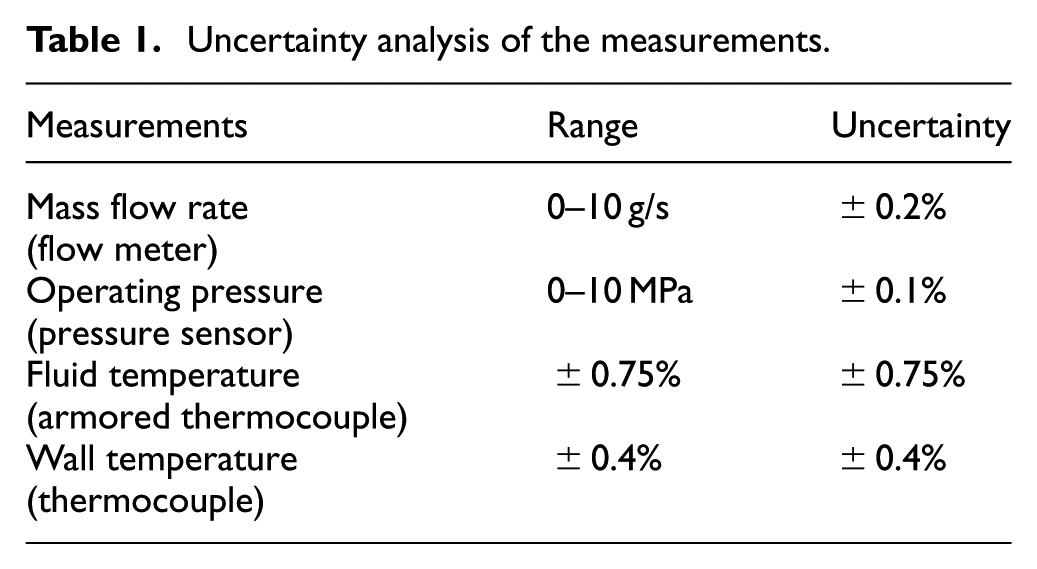
The data of mass flow rate, inlet fuel bulk temperature, outlet fuel bulk temperature, wall temperature, and pressure drop along the test section were recorded using PCI (peripheral component interconnect) data acquisition card, of which the frequency of the measurement is set to 100 Hz. The mass flow rate was measured using a Coriolis force flow meter. The fuel bulk temperature was measured using armored thermocouples of 0.5 mm in diameter. The wall temperature was measured using K-thermocouples of 0.1 mm in diameter. The pressure drop is measured using a piezoresistive sensor. The uncertainty analysis of the measurements is shown in Table 1.
Uncertainty analysis of the measurements.
Experimental procedure is carried out in accord to the following steps:
Start the pump and set the mass flow rate to the desired value;
Adjust the operating pressure to the desired value;
Adjust the inlet fuel bulk temperature to the desired value;
Turn on the AC power and heat the test section;
When the outlet fuel bulk temperature reaches a steady state, adjust the heating power to a higher level;
The experiment is stopped when obvious instabilities occur.
In this investigation, the RP-3 jet fuel was chosen as the working medium, of which the critical temperature and critical pressure is 371.2°C and 2.33 MPa, respectively. And the supercritical pressure of 2.5, 3.0, and 4.0 MPa are chosen. The operating conditions of all tests are shown in Table 2.
The operating conditions.

Instability starting point
It is indispensable to accurately identify the starting point of instability for determining the conditions that trigger the instabilities. The oscillations due to temperature are usually used to represent thermodynamic instability; however, it is difficult to identify the starting point. As shown in Figure 2, it is easy to identify the large fluctuations of fuel bulk temperature from 120 s to 200 s as instabilities, while it is difficult to identify the small fluctuations of fuel bulk temperature from 40 s to 120 s as instabilities or not. Moreover, the characteristics of heat transfer cannot be reflected directly by the variations of temperature.

The variations of heating power, wall temperature, and fuel bulk temperature with time.
In our research, a power–temperature drop characteristic curve is defined to identify the starting point of thermodynamic instability and reflect the characteristics of heat transfer. The temperature drop is defined as: Td = Twout – Tbout, in which Td is the temperature drop, Twout is the wall temperature close to the outlet of the test section, and Tbout is the fuel bulk temperature at the outlet of the test section. As shown in Figure 3, the temperature drop with certain heating power does not remain unchanged. Therefore, the maximum and minimum temperature drops during 60 s are taken as the characteristic temperature drops.
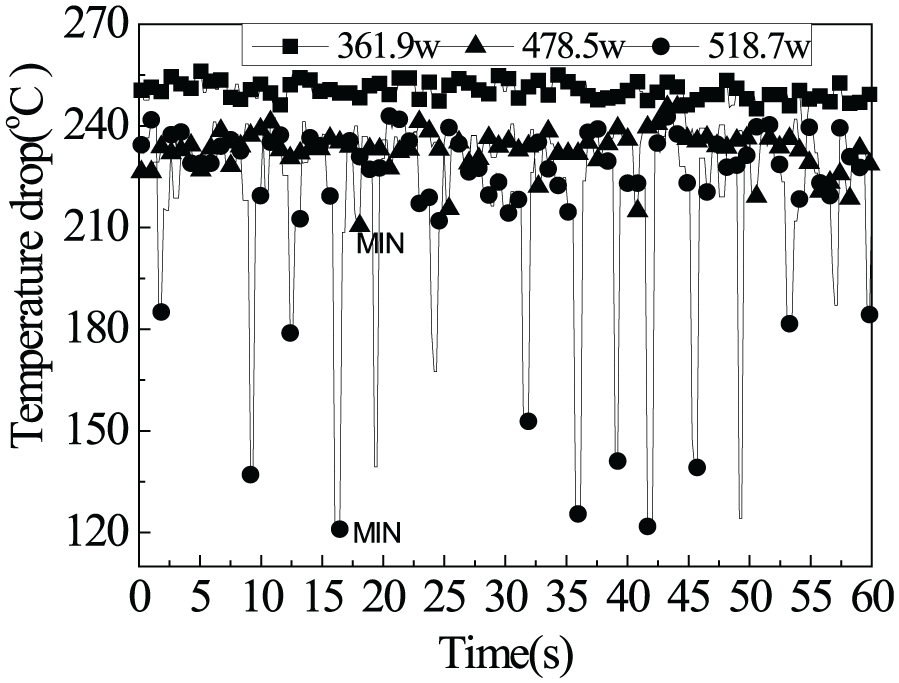
The variations of temperature drop with time at different heating power.
The power–temperature drop characteristic curve is shown in Figure 4. As can be seen, the heat-transfer process in heated tube with increasing heating power can be divided into three periods. In the stable period, the difference between the maximum and minimum temperature drops is small and changes little with increasing heating power, the system is stable. In developing period, the difference between the maximum and minimum temperature drops increases obviously with increasing heating power, the thermodynamic instability is increasing. In unstable period, the difference between the maximum and minimum temperature drops is huge and does not change obviously with increasing heating power, the system comes to an unstable state. The thermodynamic instability starting point can be easily identified as the starting point of the unstable period.

The power–temperature drop characteristic curve.
According to the heat convection formula, the smaller the temperature drops, the stronger the heat transfer is when the heating power is kept steady. Therefore, it can be seen from Figure 4 that in the stable period, the amplitude of heat-transfer intensity oscillations is small and changes little with increasing heating power; in the developing period, the amplitude of heat-transfer intensity oscillations increases obviously with increasing heating power; and in the instable period, the amplitude of heat-transfer intensity oscillations approaches to a certain value (corresponding to the starting point of the unstable period) and changes slowly with increasing heating power.
Results and discussions
The effects of mass flow rate on thermodynamic instability
Figure 5 shows the power–temperature drop characteristic curves of tests 1, 2, and 3 and the variations of outlet wall and fuel bulk temperature with time corresponding to the starting points.
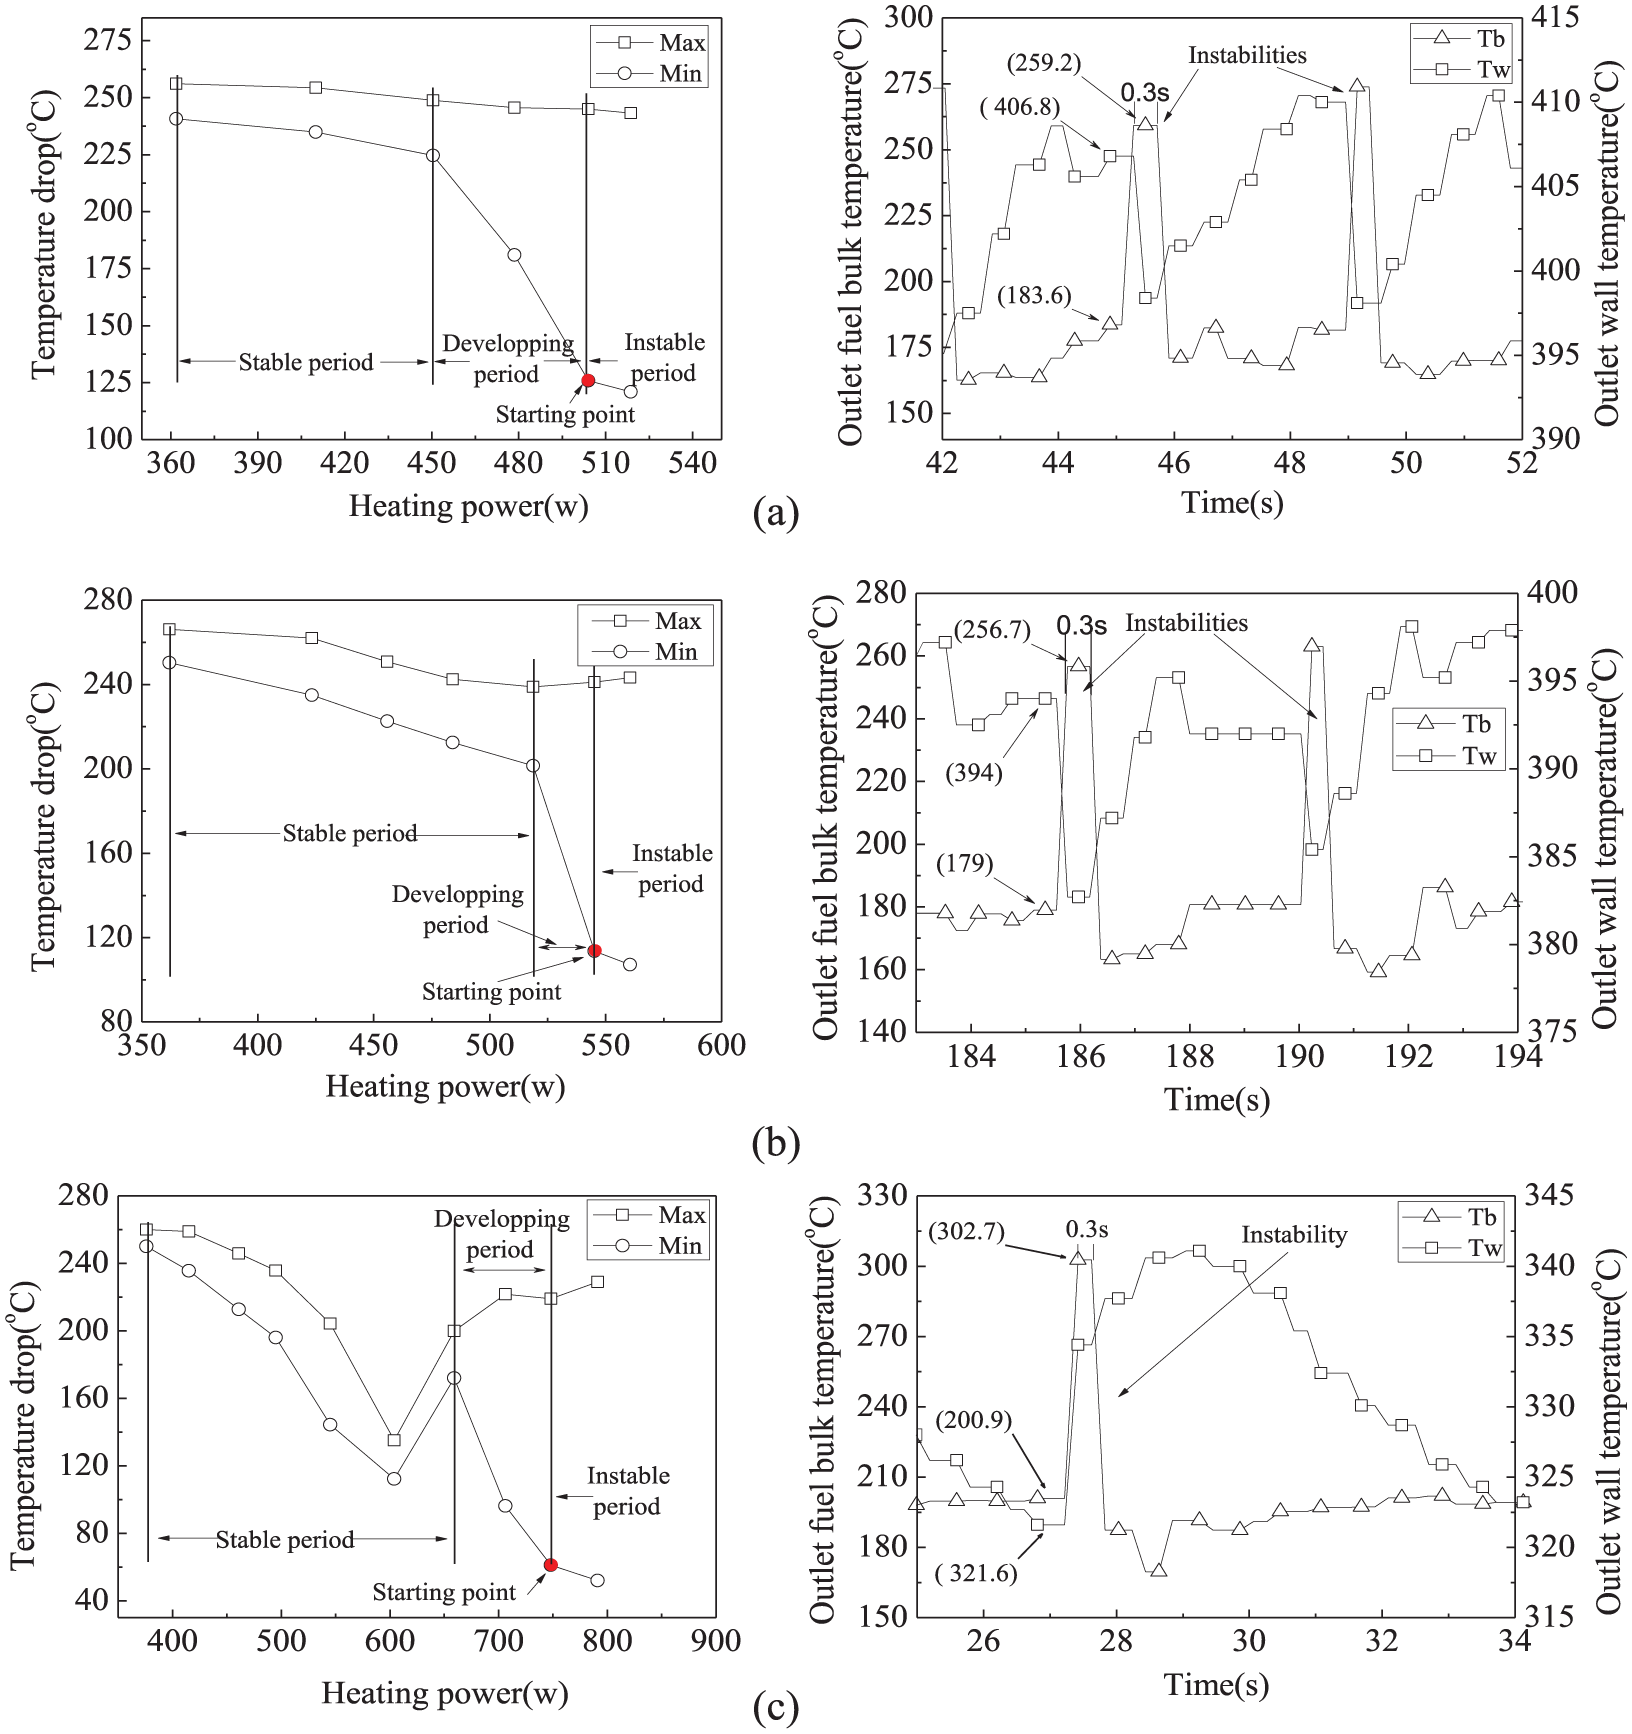
The effects of mass flow rate on thermodynamic instability (inlet temperature = 17°C, operating pressure = 3.0 MPa): (a) mass flow rate = 1.0 g/s, (b) mass flow rate = 1.2 g/s, and (c) mass flow rate = 1.5 g/s.
The power–temperature drop characteristic curves in Figure 5 show that the heat-transfer process of all three different mass flow rates can be divided into three periods. In the stable period, the maximum and minimum temperature drops decrease synchronously and slowly when mass flow rates are 1.0 and 1.2 g/s, while they have a “V-type” variation trend when the mass flow rate is 1.5 g/s. In the developing period, the maximum temperature drop changes little and the minimum temperature drop decreases obviously when mass flow rates are 1.0 and 1.2 g/s, while the maximum temperature drop increases and the minimum temperature drop decreases obviously when mass flow rate is 1.5 g/s. In the instable period, the maximum and minimum temperature drops of all the three different mass flow rates change slowly.
The variations of outlet wall and fuel bulk temperature with time show that when instability occurs, the variation trend of fuel bulk temperature of the three different mass flow rates are the same, that is, the fuel bulk temperature first increases to the top sharply and remains still for about 0.3 s and then decreases sharply to the bottom; the variation trends of wall temperature of 1.0 and 1.2 g/s are the same, that is, the wall temperature first decreases to the bottom sharply and then increases gradually, while the wall temperature first increase to the top sharply and then decreases gradually when the mass flow rate is 1.5 g/s.
The difference between maximum and minimum temperature drops and the heating power-to-mass flow rate ratio corresponding to the starting point are shown in Table 3. It can be seen from Table 3 that the difference between maximum and minimum temperature drops increases with increasing mass flow rate, indicating that increasing mass flow rate causes the strength of the thermodynamic instability to increase; the heating power-to-mass flow rate ratio decreases first and then increases with increasing mass flow rate, indicating that increasing mass flow rate promotes the thermodynamic instability when the mass flow rate is below 1.2 g/s, while restrains the thermodynamic instability when the mass flow rate exceeds 1.2 g/s.
The difference between maximum and minimum temperature drops and the heating power-to-mass flow rate ratio corresponding to the starting point.

The effects of inlet temperature on thermodynamic instability
Figure 6 shows the power–temperature drop characteristic curves of tests 1, 4, and 5 and the variations of outlet wall and fuel bulk temperature with time corresponding to the starting points.
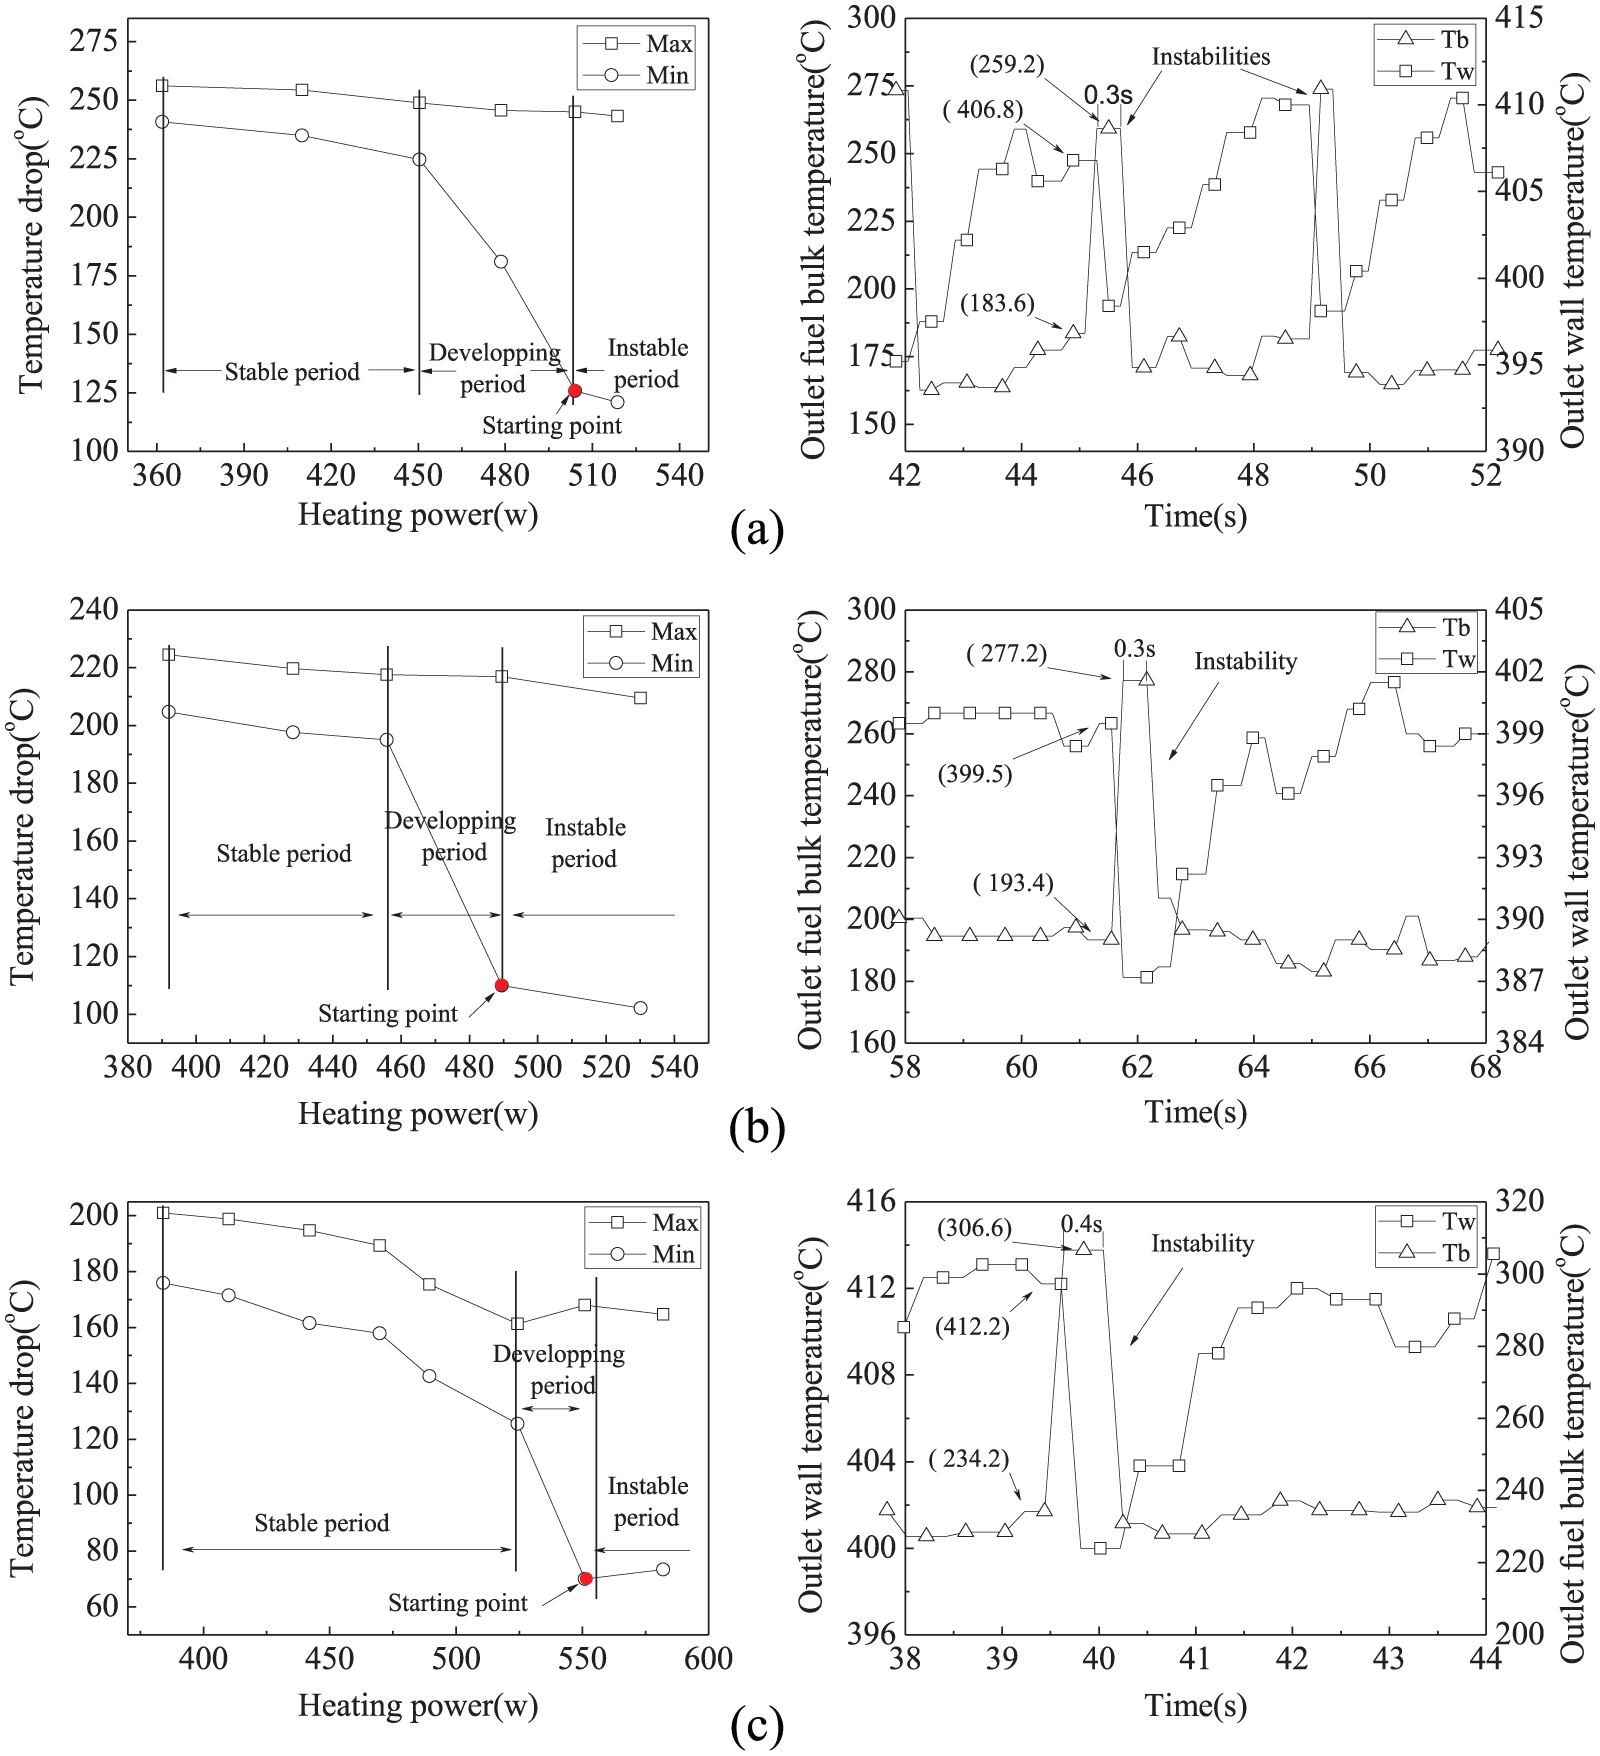
The effects of inlet temperature on thermodynamic instability (mass flow rate = 1.0 g/s, operating pressure = 3.0 MPa): (a) inlet temperature = 17°C, (b) inlet temperature = 37°C, and (c) inlet temperature = 62°C.
The power–temperature drop characteristic curves in Figure 6 show that the heat-transfer process of all three different inlet temperatures can be divided into three periods. In the stable period, the maximum and minimum temperature drops decrease synchronously and slowly when inlet temperatures are 17°C and 37°C, while decrease synchronously and obviously when inlet temperature is 62°C. In the developing period, the maximum temperature drop changes little and the minimum temperature drop decreases obviously when mass flow rate is 1.0 and 1.2 g/s, while the maximum temperature drop increases and the minimum temperature drop decreases obviously when inlet temperature is 62°C. In the instable period, the maximum and minimum temperature drops of all the three different inlet temperatures change slowly.
The variations of outlet wall and fuel bulk temperature with time show that when instability occurs, the variation trend of fuel bulk temperature of the three different inlet temperatures are the same, that is, the fuel bulk temperature first increases to the top sharply and remains still for about 0.3 s and then decreases sharply to the bottom; the variation trends of wall temperature of the three different inlet temperatures are the same, that is, the wall temperature first decreases to the bottom sharply and then increases gradually.
The difference between maximum and minimum temperature drops and the heating power-to-mass flow rate ratio corresponding to the starting point are shown in Table 4. It can be seen from Table 4 that the difference between maximum and minimum temperature drops decreases with increasing inlet temperature, indicating that increasing inlet temperature causes the strength of the thermodynamic instability to decrease; the heating power-to-mass flow rate ratio decreases first and then increases with increasing inlet temperature, indicating that increasing inlet temperature promotes the thermodynamic instability when inlet temperature is below 37°C, while restrains the thermodynamic instability when inlet temperature exceeds 37°C.
The difference between maximum and minimum temperature drops and the heating power-to-mass flow rate ratio corresponding to the starting point.

The effects of operating pressure on thermodynamic instability
Figure 7 shows the power–temperature drop characteristic curves of test 1, 6, and 7 and the variations of outlet wall and fuel bulk temperature with time corresponding to the starting point.
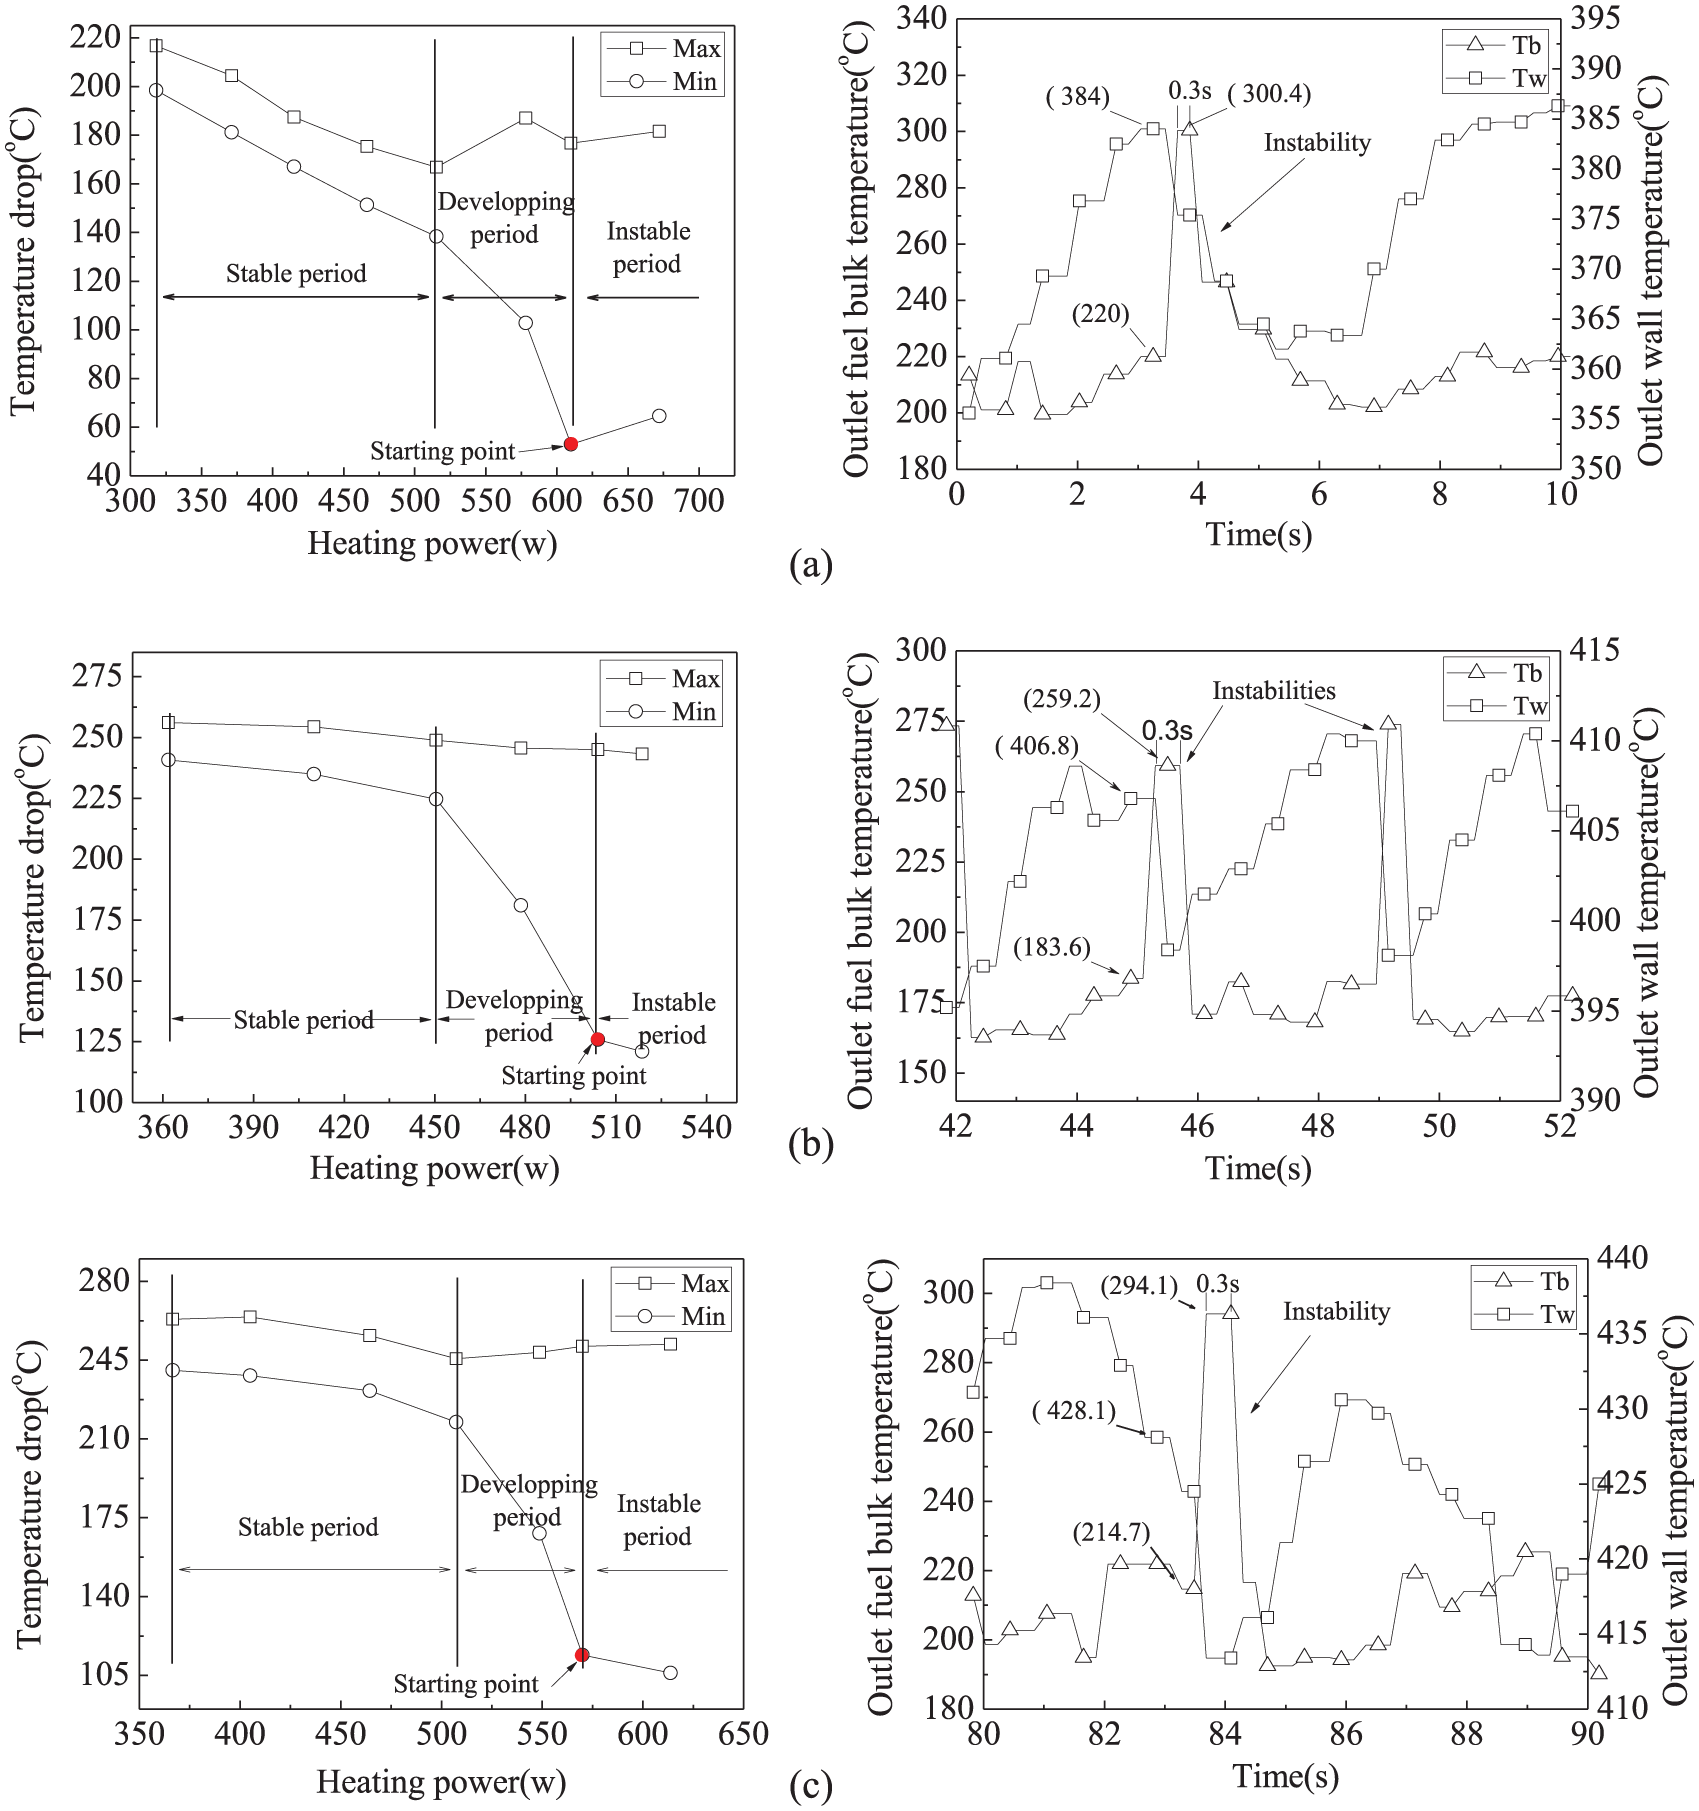
The effects of operating pressure on thermodynamic instability (mass flow rate = 1.0 g/s, inlet temperature = 17°C): (a) operating pressure = 2.5 MPa, (b) operating pressure = 3.0 MPa, and (c) operating pressure = 4.0 MPa.
The power–temperature drop characteristic curves in Figure 7 show that the heat-transfer process of all three different operating pressures can be divided into three periods. In the stable period, the maximum and minimum temperature drops decrease synchronously, obviously when the operating pressure is 2.5 MPa, while decrease synchronously and slowly when the operating pressures are 3.0 and 4.0 MPa. In the developing period, the maximum temperature drop increases and the minimum temperature drop decreases obviously when the operating pressure is 2.5 MPa, while the maximum temperature drop changes little and the minimum temperature drop decreases obviously when operating pressures are 3.0 and 4.0 MPa. In the instable period, the maximum and minimum temperature drops of all the three different operating pressures change slowly.
The variations of outlet wall and fuel bulk temperature with time show that when instability occurs, the variation trend of fuel bulk temperature of the three different operating pressures are the same, that is, the fuel bulk temperature first increases to the top sharply and remains still for about 0.3 s and then decreases sharply to the bottom; the variation trends of wall temperature of the three different operating pressures are the same, that is, the wall temperature first decreases to the bottom sharply and then increases gradually.
The differences between maximum and minimum temperature drops and the heating power-to-mass flow rate ratio corresponding to the starting point are shown in Table 5. It can be seen from Table 5 that the difference between maximum and minimum temperature drops decreases first and then increases with increasing operating pressure, indicating that increasing operating pressure causes the strength of the thermodynamic instability to decrease when the operating pressure is below 3.0 MPa and increase when operating pressure exceeds 3.0 MPa; the heating power-to-mass flow rate ratio decreases first and then increases with increasing operating pressure, indicating that increasing operating pressure promotes the thermodynamic instability when operating pressure is below 3.0 MPa, while restrains the thermodynamic instability when the operating pressure exceeds 3.0 MPa.
The difference between maximum and minimum temperature drops and the heating power-to-mass flow rate ratio corresponding to the starting point.

Generating mechanism of thermodynamic instability
It can be seen from Figures 5 –7 that the minimum temperature drop decreases steeply in the developing period of all tests, while the maximum temperature drop changes little relatively, indicating that the heat-transfer intensity strengthens when thermodynamic instabilities occur. The statistical results of instabilities corresponding to the starting points of all tests are shown in Table 6, in which Tb1 and Tb2 are the outlet fuel bulk temperatures before and after the onset of instability, Re1 and Re2 are Reynolds numbers calculated based on the published thermal properties21–23 corresponding to Tb1 and Tb2, Tw is the outlet wall temperature before the onset of instability, Tpc is the corresponding pseudo-critical temperature, Tdet is defined as Tdet =|Tw – Tpc|/Tpc, and P is the operating pressure.
The statistical results.

Tb1: outlet fuel bulk temperature before the onset of instability; Re1: Reynolds number corresponding to Tb1; Tb2: outlet fuel bulk temperature after the onset of instability; Re2: Reynolds number corresponding to Tb2; Tw: outlet wall temperature before the onset of instability; Tpc: corresponding pseudo-critical temperature; Tdet: Tdet =|Tw – Tpc|/Tpc; P: operating pressure.
Ordinarily, the fluid within the tube is under laminar flow when Reynolds number is below 2300, is under transition flow when Reynolds number is in the range of 2300–10,000, and is under vigorous turbulent flow when Reynolds number is above 10,000. It can be seen from Table 6 that the outlet fuels all change from transition flow to vigorous turbulent flow except test 3 when thermodynamic instabilities occur. The heat transfer is obviously enhanced by the vigorous turbulent flow when thermodynamic instability occurs, which agrees with the results determined from the power–temperature drop characteristic curves.
Moreover, the outlet wall temperatures are all around the corresponding pseudo-critical temperature except test 3 before the onset of thermodynamic instability. When the wall temperature approaches the pseudo-critical temperature, the temperature of fluid adjacent to the wall reaches the pseudo-critical temperature. Sharp decreases of the density and viscosity result in the fluid changing from transition flow to vigorous turbulent flow, in which the heat transfer is significantly enhanced. The temperature of fluid thus increases sharply while the wall temperature decreases steeply. The fluid regains transition flow once the temperature of the fluid adjacent to the wall decreases to the state lower than the pseudo-critical temperature. Therefore, the temperatures of the wall and fluid return to the initial state.
Before the onset of thermodynamic instability, the wall temperature of test 3 is 321.6°C, which is far below the pseudo-critical temperature, indicating that the density and viscosity of the fuel do not decrease sharply. Moreover, the outlet Reynolds number of test 3 is 10,527 before the onset of thermodynamic instability, indicating that the flow pattern does not change when instability occurs. Therefore, it can be determined that the thermodynamic instabilities of test 3 are not aroused around the outlet.
Figure 8 shows the variations of Tw7 and outlet fuel bulk temperature with time corresponding to the starting point of test 3, in which Tw7 is 45 mm from the outlet. It can be seen from Figure 8 that the variation trend of Tw7 is same as that of all the other tests, and before the onset of thermodynamic instability Tw7 is 409.5°C, which is around the pseudo-critical temperature. Therefore, it can be determined that the thermodynamic instabilities of test 3 are aroused around Tw7. When the thermodynamic instability occurs at Tw7, the fuel temperature around Tw7 increases sharply, resulting in a sharp increase in the outlet fuel temperature, and the outlet wall temperature increases sharply with the outlet fuel temperature, as shown in Figure 5(c).
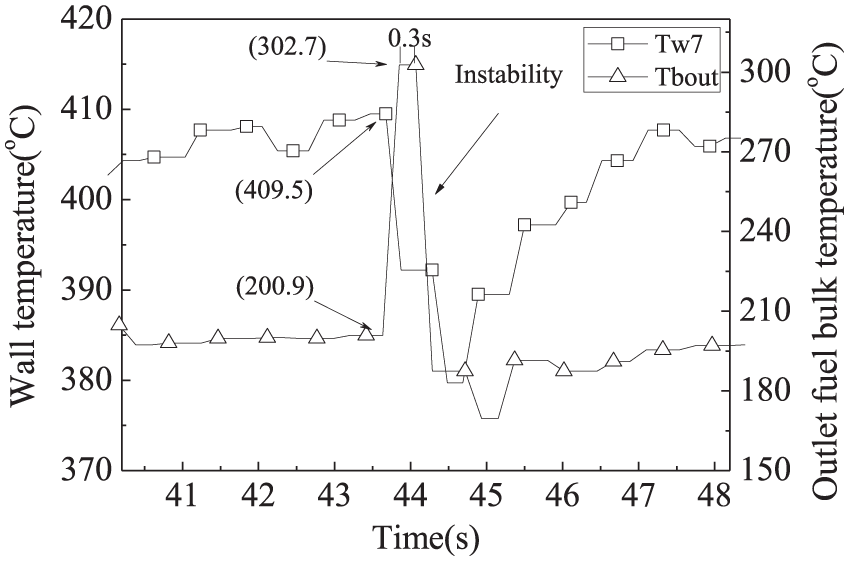
The variations of Tw7 and outlet fuel bulk temperature with time (min = 1.5 g/s, Tin = 17°C, P = 3.0 MPa).
Action mechanism of operating parameters on the thermodynamic instability
The most important parameter of the instability is its intensity. The intensity of the instability is related to two factors, which is the kinetic energy of the flow and the oscillatory extent. The intensity of the instability can be attained as: intensity = kinetic energy × oscillatory extent. The intensity of the instability can be represented by the temperature drop, and the kinetic energy can be represented by the mass flow rate. Before the onset of thermodynamic instability, the temperature of the fuel adjacent to the wall is around the pseudo-critical point, while the fuel bulk temperature is far below the pseudo-critical point. When the instability occurs, the fuel bulk temperature is close to the pseudo-critical point. Thus the difference between the wall temperature and the fuel bulk temperature (gradient of fuel temperature) can represent the oscillatory extent of the instability.
The gradient of fuel temperature and the temperature drop in tests 1–3 are shown in Table 7. As can be seen, although the oscillatory extent (gradient of fuel temperature) decreases, the intensity of the instability (temperature drop) increases with increasing mass flow rate. The results indicate that the effects of mass flow rate on the instability are not linear, as shown in Figure 9. An increase in mass flow rate will decreases the oscillatory extent of the instability, while increases the kinetic energy of the flow. When mass flow rate is increased from 1.0 to 1.5 g/s, the effect on the flow’s kinetic energy dominates the change of the instability, which causes the intensity of the instability to increase.
The effect of mass flow rate on the instability.


The effects of mass flow rate on the intensity of instability.
The gradient of fuel temperature and the temperature drop in tests 1, 4, and 5 are shown in Table 8. As can be seen, the intensity of the instability (temperature drop) decreases with increasing inlet fuel temperature which results from the decrease of the gradient of fuel temperature. The effect of inlet fuel temperature on the instability is shown in Figure 10.
The effect of inlet fuel temperature on the instability.


The effects of inlet temperature on the intensity of instability.
The effects of operating pressure on instability are not linear because of the properties of supercritical fuel change obviously with pressure near the critical point. The pseudo-critical temperature increases while the density and viscosity change rates decrease when the operating pressure increases as shown in Figure 11. However, increasing the pseudo-critical temperature causes the strength of the thermodynamic instability to increase, while decreasing density and viscosity change rates causes the strength of the thermodynamic instability to decrease. When operating pressure is near the critical point, the strength of the thermodynamic instability is primarily influenced by the change rates of density and viscosity. When operating pressure is above 3.0 MPa, the strength of the thermodynamic instability is primarily influenced by the change of pseudo-critical temperature.

The effects of operating pressure on the intensity of instability.
The effects of mass flow rate, inlet temperature, and operating pressure on the system stability are not linear because the system stability is also influenced obviously by Reynolds number of the flow. In tests 3, 5, and 6, Reynolds numbers are increased with increasing mass flow rate, increasing inlet temperature, and decreasing operating pressure, respectively. An increase in Reynolds number restrains the onset of instability, which is compatible with the results of a study by Brad and Michael. 19
Conclusion
A series of heated tube experiments were performed to investigate the thermodynamic instabilities that occur when heating a supercritical endothermic hydrocarbon fuel. In these tests, RP-3 flowed vertically upward through circular a tube of 300-mm long, 1-mm thick, and 3 mm in outer diameter at supercritical pressures.
Mass flow rate, inlet temperature, operating pressure, and heat flux were varied in an effort to determine the conditions that trigger the instabilities. A “power–temperature drop” characteristic curve is used to analyze the mechanism of thermodynamic instabilities. The experimental results indicate that the heat-transfer process in the heated tube with increasing heating power can be divided into stable period, developing period, and instable period. The thermodynamic instabilities are found to occur in the instable period and behave as the transition of heat-transfer mode, which is primarily caused by the acute decrease in fuel density and viscosity near the pseudo-critical temperature region.
The generating mechanism of thermodynamic instability is determined from the experimental results. When the wall temperature approaches the pseudo-critical temperature, the temperature of fluid adjacent to the wall reaches the pseudo-critical temperature. Sharp decreases of the density and viscosity result in the fluid changing from transition flow to vigorous turbulent flow, in which the heat transfer is significantly enhanced. The temperature of fluid thus increases sharply, while the wall temperature decreases steeply. The fluid regains transition flow once the temperature of the fluid adjacent to the wall decreases lower than the pseudo-critical temperature. Therefore, the temperatures of the wall and fluid return to the initial state.
The intensity of the instability is related to two factors, which are the kinetic energy of the flow and the oscillatory extent. An increase in mass flow rate decreases the oscillatory extent of the instability, while increases the kinetic energy of the flow. When the mass flow rate is increased from 1.0 to 1.5 g/s, the effect on the kinetic energy of the flow dominates the change of the instability which causes the intensity of the instability increase. Whereas an increase in inlet temperature causes the fuel temperature gradient to decrease, which in turn reduces the instability. The effects of operating pressure on instability are not linear. The intensity of the thermodynamic instability decreases with increasing operating pressure because it is primarily influenced by the change rates of density and viscosity when operating pressure is around the critical point. The intensity of the thermodynamic instability increases with increasing operating pressure because it is primarily influenced by the change of pseudo-critical temperature when the operating pressure is above 3.0 MPa. The system stability is obviously influenced by Reynolds number interactive with mass flow rate, inlet temperature, and operating pressure. An increase in Reynolds number restrains the onset of instability.
Footnotes
Acknowledgements
The authors would like to express their thanks for the support from the National Natural Science Foundation of China (grant nos.: 91441123 and 11142010).
Handling Editor: Assunta Andreozzi
Declaration of conflicting interests
The author(s) declared no potential conflicts of interest with respect to the research, authorship, and/or publication of this article.
Funding
The author(s) received no financial support for the research, authorship, and/or publication of this article.