
Abstract
Oil liquid sloshing is the sloshing of free oil liquid surface in the fuel tank filled partially. The variable conditions of vehicle mainly include braking, acceleration, and deceleration. It is verified that the simulation method is reliable by the test. In this study, numerical simulations are carried out to study the sloshing of free oil liquid surface under the variable conditions of vehicle, and the key factors influencing variable conditions are acceleration value of oil liquid sloshing, the lasted time of acceleration, and the amount of fuel filled. The numerical results of oil liquid sloshing under variable conditions are compared. The results show that the influence of the amount of fuel filled on oil liquid sloshing and evaporative emission is greater than that of the other two factors under the same working conditions. The time-area values of acceleration lasted time of 1 s are bigger than that of 4 s and the time-area values of 50% fuel filled are bigger than that of 25% fuel filled during the same time of sloshing, and the change law of evaporative emission is the same as that of time-area values.
Introduction
Liquid sloshing refers to the movement or vibration of the free liquid surface in the tanks filled partially under the influence of external factors. Liquid sloshing is a phenomenon in many engineering fields such as space aviation, highway transportation, maritime transportation, and mathematics. The sloshing of free liquid surface can be generated by giving an initial impulse, or an initial disturbance to the free liquid surface.1,2 The variable conditions of vehicle mainly include braking, acceleration, and deceleration.
Liquid sloshing in tanks attracts great attention by many scholars. Some achievements of the research were published by Ibrahim et al. 3 The main achievements are about nonlinear and parametric sloshing dynamics, impact dynamics of liquid sloshing, sloshing–structure interaction and so on. Yu and Chu 4 have studied computational simulation of nonlinear liquid sloshing in tank vehicle. In this study, the nonlinear sloshing of liquid was investigated by a pendulum equivalent model. It provides a theoretical basis to improve the driving stability of tank vehicle. Zheng et al. 5 established rollover dynamics model of the tank vehicle by three methods. The modified model effectively improves the accuracy of tank vehicle’s roll stability in driving. Zou and Wang 6 had created a simplified mechanical model to study fluid–structure interaction for liquid sloshing of a rectangular tank under a horizontal excitation. The computational cost has been greatly reduced by the model. Akyildiz and Unal7,8 analyzed the pressure of liquid sloshing in rectangular tanks with and without baffles in numerical and experimental methods. A new experimental device has been designed to study the nonlinear behavior and damping characteristics of liquid sloshing in a rectangular tank filled partially. The results of numerical analysis were compared with the experimental results and had been corrected. The three-dimensional (3D) dynamic of liquid sloshing in tank filled partially was performed by Amir Kolaei et al. The free liquid surface under generalized coordinates was obtained by using the higher order boundary element method, and the force and torque of liquid sloshing were obtained by a new finite element method, which can reduce computation amount.9,10
Using computational fluid dynamics (CFD) method for solving the Navier–Stokes equation, the liquid sloshing can be simulated by simulation software such as volume of fluid (VOF) method and smoothed particle hydrodynamics (SPH) method. VS Sanapala and other researchers used CFD method to analyze the dynamics of liquid sloshing, and the method of simulation control was applied to fuel consumption in a storage tank. The free surface displacement, pressure distribution, and forces and moments of liquid sloshing under the influence of harmonic excitation can be obtained by CFD.11,12 Celebi and Akyildiz 13 took finite difference method to solve the equation and determined free surface by VOF method. The VOF technology was used to track free surface of liquid sloshing in moving tank, and the position of free surface was obtained in the process of liquid sloshing. AM Aly et al. used the incompressible smoothed particle hydrodynamics (ISPH) method to simulate liquid sloshing in the problems of pressure calculations and nonlinear liquid sloshing. In the longtime simulation of nonlinear sloshing problems, the robustness and accuracy of the ISPH method are presented. 14
From the above, liquid sloshing is studied by mathematical model, structural optimization, computational simulation, and so on. However, oil liquid sloshing in fuel tanks of vehicle has seldom been studied under the variable conditions of vehicle. In fact, oil liquid sloshing could cause a lot of adverse problems such as causing internal noise in fuel tank, stopping fuel supply at high speed, damaging to parts, and increasing evaporative emission. It is extremely less about study of oil liquid sloshing in fuel tank of vehicle and the influence of the free oil liquid surface area on evaporative emission during oil liquid sloshing.
Evaporative emissions mainly include refueling losses, 15 diurnal losses, hot soak losses, and running losses. Running losses refers to the fuel vapor escaping from the fuel system during vehicle running.16,17 In particular, running losses is more obvious in hybrid vehicles. The number of vehicles in China is large and gasoline vehicles are the main ones. In order to meet the higher emission standards of fuel tanks and reduce air pollution, it is necessary to study oil liquid sloshing and running loss of fuel tank under variable conditions of vehicle. This research can not only be useful for energy saving but can also greatly reduce the amount of evaporation pollution to environment.
Like water in containers, oil liquid is easy to evaporate under the influence of external factors. The main factors influencing evaporative emission of oil liquid are the quality of oil liquid, the temperature in the fuel tank, the area of free oil liquid surface, the vapor pressure in the fuel tank, and so on. When the oil liquid is stationary in the fuel tank, the main factors are almost unchanged and the evaporative emission of oil liquid is stable for quite a long time. When the vehicle is in variable conditions, the only influence factor is the change of free oil liquid surface area. Therefore, it is necessary to study the law of oil liquid sloshing and the change of free oil liquid surface area under this condition. The research of this process is about the running loss of oil liquid. The mechanism of oil liquid evaporation during this process is similar to make the hot water cooler by alternating two cups with filling water in a short time. The most direct factor of influencing the change of free oil liquid surface area and oil liquid sloshing is the geometry of the fuel tank, especially the plastic fuel tank with complex shape. In order to find out the sloshing law of free oil liquid surface area under variable conditions, the shape of fuel tank used in this work is regular geometry.
Computational setups
This section briefly describes the governing equations, the creation and discretization of 3D models, the correlation and convergence verification of computational method, and experimental investigation. The study of oil liquid sloshing is carried out in a rectangular fuel tank under variable conditions of vehicle.
Governing equations
It is very difficult to track the free surface area of liquid sloshing in the process of fast moving tank by test, but the computer simulation is easy to obtain. At present, the VOF method is the best way to track the free surface area. So the numerical results presented are based on VOF models in this study.
The wall of the fuel tank is assumed to be rigid, and the fuel is considered to be nonviscous and incompressible, and only irrotational. The geometry of the fuel tank is rectangular, and the motion of fuel tank is linear. This part briefly describes the fluid motion equations under variable conditions.
As shown in Figure 1, X0Y0Z0O0 represents a fixed Cartesian coordinate system and XYZO is the Cartesian coordinate system of motion. The O0 point is defined as the fixed reference point in the inertial space, and the O point is the origin in the motion coordinate system. In the Cartesian X0Y0Z0O0 coordinate system, the vector of the O point relative to the O0 point is r1. In Figure 1, ABCD is the free oil liquid surface in a rectangular fuel tank.

Moving tank showing inertia and moving coordinates.
Arbitrarily, point P in the free surface meets the equation in the fluid domain. The equations are as follows


where

For irrotational flow, the curl of the velocity vanishes, that is,

The negative sign is optional, and in some cases, it may be removed provided the analysis preserves the sign convention. Introducing equations (3) and (4) into equation (2) gives
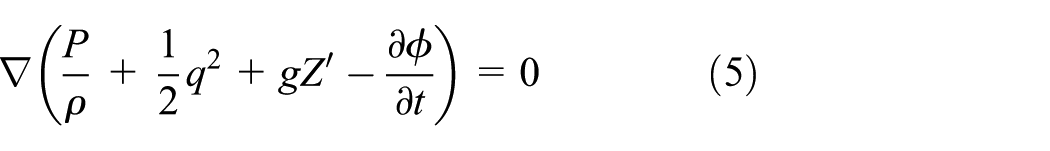
Upon integrating equation (5) one obtains

where F(t) is an arbitrary function of time. In this article, F(t) refers to the inertia force of oil liquid sloshing in the variable condition of vehicle.
For the above equations of fluid motion, it is only applicable to incompressible fluids, so the fluid must meet continuous conditions

The equation after introducing equation (4) takes the form

The creation and discretization of 3D models
The schematic diagram of a 3D fuel tank is shown in Figure 2 in this study. The yellow part is the fuel with a height of h. The fuel tank is fixed on vehicle chassis. No relative movement between the fuel tank and the vehicle chassis is assumed. The X direction is forward direction of vehicle. The volume of the fuel tank is 40 L. The length of the fuel tank is defined as a (a = 666.67 mm), width b (b = 300 mm), and height c (c = 200 mm). The fuel depth in the diagram is h (h = 50 mm). There are 338,247 nodes for simulation in mesh of finite element model. The center point, center line, and edge interface of oil liquid are shown in Figure 3.

Schematic diagram of a 3D fuel tank with 25% fuel filled.

Defined initial elements of a 3D fuel tank.
The correlation and convergence verification of computational method
Figure 4 depicts temporal variation of oil liquid pressure for different grid sizes in the same working condition. Grid sizes are selected as 10, 12, and 15 mm, respectively. It can be seen from Figure 4 that when the mesh size is 10 or 12 mm, the pressure value of oil liquid is almost the same. Considering the accuracy and economy of computation, the grid size is set to 12 mm in this work.

Temporal variation of oil liquid sloshing pressure for different grid sizes.
To verify the convergence of the calculate method, three different step times are set to 0.0015, 0.0025, and 0.0055 s, respectively. The history curves of oil liquid sloshing pressure at the center point with different step time are shown in Figure 5. It can be observed from Figure 5 that the history curves obtained with different step time (Δt = 0.0015 s and Δt = 0.0025 s) are almost the same. Therefore, the calculate method is convergent. Considering the economy of computation, the step time is set to 0.0025 s.

The history curves of oil liquid sloshing pressure at the center point with different step time.
Experimental investigation
It is very difficult to obtain the changes of free oil liquid surface area in the process of rapid sloshing. In order to verify the reliability of the simulation method, the pressure of oil liquid sloshing is measured by test. In the present study, an experimental setup of oil liquid sloshing system is illustrated in Figure 6. The fuel tank is fixed on the platform. The platform moves linearly and repeatedly under the action of power device. The liquid with the equal density to gasoline is filled into the fuel tank, taking up 25% of the fuel tank volume. Oil pipes are installed at the center of the fuel tank front surface, and pressure sensors are installed at the end of the oil pipes. The pressure history curves of oil liquid sloshing at the center point with different acceleration values are shown in Figure 7. According to the comparison between simulation results and experimental data, the simulation method is reliable.

Experimental setup of oil liquid sloshing system: (a) schematic diagram of test structure and (b) diagram of test equipment installation.

The pressure history curves of oil liquid sloshing at the center point with different acceleration values: (a) 0.1g, (b) 0.2g, (c) 0.3g, and (d) 0.4g.
Results and discussion
The present study focuses on the law of oil liquid sloshing and the changes of free oil liquid surface in a rectangular fuel tank under the variable conditions. The simulation analysis is carried out under the influence of three main factors, which are acceleration value of oil liquid sloshing, the lasted time of acceleration, and the amount of fuel filled. To start with, numerical data are presented under different acceleration values of oil liquid sloshing in the “Acceleration value of oil liquid sloshing” section. In “The lasted time of acceleration” section, influence factor is two different lasted time of acceleration. In “The amount of fuel filled” section, influence factor is the amount of fuel filled.
Acceleration value of oil liquid sloshing
The oil liquid is filled in the fuel tank. Oil liquid sloshes under the combined action of gravity and inertia force in the fuel tank when acceleration value of the moving vehicle changes. At the same time, the area of free oil liquid surface is changed continuously as oil liquid sloshes. As the acceleration value of oil liquid sloshing changes, the time-area value also changes constantly. The time-area value is the product of the time and the free oil liquid surface area at the corresponding time. The time-area value is a main parameter to measure evaporative emission of oil liquid.
Experimental setup of oil liquid sloshing system is shown in Figure 6. The pressure history curves of oil liquid sloshing at the center point with different acceleration values are shown in Figure 7. According to the comparison between simulation result and experimental data, the simulation method is reliable.
Figures 8 and 9 show the history curves of the first 4 s under the combined action of gravity and inertia force, and that of the latter 4 s is only under the action of gravity.

The related history curves of oil liquid sloshing under different acceleration conditions: (a) the history curves of pressure at the center point, (b) the history curves of pressure on the center line, (c) the history curves of the flow velocity of oil liquid mass, and (d) the history curves of the flow velocity of oil liquid volume.

The related history curves of free oil liquid surface area under different acceleration conditions: (a) the history curves of free oil liquid surface area, (b) the history curves of the change rate of free oil liquid surface area, (c) the history curves of the change acceleration of free oil liquid surface area, and (d) the history curves of time-area values.
The history curves of oil liquid sloshing pressure at the center point and on the center line can be obtained from Figure 8, and so do the history curves of the flow velocity of oil liquid mass and volume with different acceleration values. The basic characteristics of oil liquid sloshing are obtained from the related history curves of oil liquid sloshing, and the change of free oil liquid surface is reflected at different angles. In Figure 9, the related history curves of free oil liquid surface area are shown under the conditions of 0.1g, 0.2g, 0.3g, and 0.4g.
As shown in Figure 8(a), with the increase of acceleration value, the amplitude of sloshing pressure at the center point and on the center line, the flow velocity of oil liquid mass and oil liquid volume also increases in the history curves. The increase of acceleration value is not proportional to the increase of those four evaluating indicators. It is obtained from Figure 8 that the amplitude attenuation of oil liquid sloshing pressure under the combined action of gravity and inertia force is faster than that only under gravity. As the acceleration value of oil liquid sloshing increases, the amplitude of the first three history curves increases in Figure 9, and this phenomenon is more prominent under the condition of 0.4g. The amplitude increase of history curves is disproportionate to the acceleration increase. Comparing the time-area values at 8 s in Figure 9(d), the influence of gravity and inertial force on evaporative emission of oil liquid is greater than that of gravity only.
Figures 10 and 11 show oil liquid pressure contours and the position diagrams of free oil liquid surface at different times under different acceleration conditions, respectively. The oil liquid pressure contours can reflect oil liquid pressure during oil liquid sloshing, which can provide a theoretical basis for the structure design of fuel tank. The position of free oil liquid surface under different working conditions can reflect the overall sloshing state of oil liquid, and the free oil liquid surface area is calculated by VOF.

Oil liquid pressure contours under different acceleration conditions at different time.

The position diagrams of free oil liquid surface under different acceleration conditions at different time.
The lasted time of acceleration
The inertia force of oil liquid sloshing is directly determined by the acceleration value of oil liquid sloshing. However, the position of oil liquid sloshing is influenced by the lasted time of acceleration. The different oil liquid position determines the area of free oil liquid surface, so the lasted time of acceleration has an influence on the area of free oil liquid surface.
Figures 12 and 13 show the related history curves of oil liquid sloshing and the area of free oil liquid surface by the different acceleration lasted time at 0.4g. In each diagram, the acceleration lasted time of one curve is 1 s and that of the other curve is 4 s. After the inertia force is canceled, the oil liquid is continuously sloshed for 4 s only under the gravity.

The related history curves of oil liquid sloshing with different acceleration lasted time at 0.4g: (a) the history curves of pressure at the center point, (b) the history curves of pressure on the center line, (c) the history curves of the flow velocity of oil liquid mass, and (d) the history curves of the flow velocity of oil liquid volume.

The related history curves of free oil liquid surface area with different acceleration lasted time at 0.4g: (a) the history curves of free oil liquid surface area, (b) the history curves of the change rate of free oil liquid surface area, (c) the history curves of the change acceleration of free oil liquid surface area, and (d) the history curves of time-area values.
It is obvious that the amplitude attenuation of the related history curves is very large under the acceleration lasted time of 1 s in Figure 12. However, the acceleration lasted time of 1 s often occurs at the point brake of vehicle, which occurs frequently. From the history curves of oil liquid sloshing pressure in Figure 12, it can be seen that the oil liquid sloshing pressure under the acceleration lasted time of 1 s is smaller than that of 4 s. At the same time, the amplitude of pressure curves is rapidly attenuated.
The conclusion from Figure 13 is that the change law of free oil liquid surface area is changed by different acceleration lasted time. When the acceleration lasted time is 1 s, the history curves of free oil liquid surface area are linear in Figure 13(a)–(c), and the time-area values obtained by the acceleration lasted time of 1 s are bigger than that of 4 s in Figure 13(d).
Figures 14 and 15 show oil liquid pressure contours and the position diagrams of free oil liquid surface with the acceleration lasted time of 1 and 4 s, respectively . From the simulation results, the pressure of oil liquid sloshing and the position of the free oil liquid surface are changed by different acceleration lasted time.

Oil liquid pressure contours with different acceleration lasted time at 0.4g.

The position diagrams of free oil liquid surface with different acceleration lasted time at 0.4g.
The amount of fuel filled
The amount of fuel filled has great influence on oil liquid sloshing. According to the law of inertia, the more the amount of fuel filled is, the bigger the impacted force is. With the different amount of fuel filled, the free surface area also changes accordingly at the same time. Figures 16 and 17 show the related history curves of oil liquid sloshing and free oil liquid surface area with different amount of fuel filled at 0.4g.
The more the amount of fuel filled is, the bigger the pressure of the oil liquid sloshing is, and the smaller the fluctuation of the related history curves is, as shown in Figure 16. As shown in Figure 17, free oil liquid surface area of 50% fuel filled is all bigger than initial oil liquid surface (as shown in Figure 2).

The related history curves of oil liquid sloshing with different the amount of fuel filled at 0.4g: (a) the history curves of pressure at center point, (b) the history curves of pressure on the center line, (c) the history curves of the flow velocity of oil liquid volume, and (d) the history curves of the flow velocity of oil liquid mass.

The related history curves of free oil liquid surface area with different amount of fuel filled at 0.4g: (a) the history curves of free oil liquid surface area, (b) the history curves of the change rate of free oil liquid surface area, (c) the history curves of the change acceleration of free oil liquid surface area, and (d) the history curves of time-area values.
Figures 18 and 19 show the oil liquid pressure contours and the position diagrams of free oil liquid surface with different amount of fuel filled at the same condition, respectively. It can be seen from Figure 18 that the maximum area of oil liquid sloshing pressure is the transition corner of fuel tank, which is shown as red. As shown in Figure 19, the length of inclined edge of free oil liquid surface with 50% fuel filled is longer than that of 25% fuel filled, which causes free oil liquid surface area of 50% fuel filled to become larger.

Oil liquid pressure contours with different amount of fuel filled at 0.4g.

The position diagrams of free oil liquid surface with different amount of fuel filled at 0.4g.
Summary and conclusion
In this study, oil liquid sloshing in a partially filled fuel tank is numerically investigated under the influence of different factors. The related history curves of oil liquid sloshing and free oil liquid surface area were analyzed. Specific findings from the numerical simulations can be outlined as follows:
An experimental investigation of oil liquid sloshing in the fuel tank with 25% fuel filled was carried out. The reliability of simulation method is verified by comparing simulation results and experimental data of oil liquid sloshing.
For oil liquid sloshing of the same acceleration value, the amplitude fluctuation of the related history curves of free oil liquid surface area under the combined action of gravity and inertia force is larger than that only under the action of gravity. But the time-area values under the combined action of gravity and inertia force are smaller than that only under the action of gravity. For oil liquid sloshing of different acceleration values, the bigger the acceleration value is, the smaller the time-area value is.
Compared with the case where the acceleration lasts time for 4 s, the amplitude fluctuation of the related history curves of free oil liquid surface area is smaller and the time-area values are bigger when the acceleration lasts time for 1 s during the same time of sloshing.
The amplitude fluctuation of the related history curves of 50% fuel filled is smaller than that of 25% fuel filled under the same condition, but the time-area values of 50% fuel filled are bigger than that of 25% fuel filled.
Comparing the time-area values in Figures 9(d), 13(d), and 17(d) at 8 s, the influence of the amount of fuel filled on oil liquid sloshing and evaporative emission is greater than that of the other two factors under the same condition.
In view of the above conclusion, it is necessary to take passive control or active control to reduce the fluctuation of oil liquid sloshing and evaporative emission under the variable conditions of vehicle.
Footnotes
Handling Editor: Michal Kuciej
Declaration of conflicting interests
The author(s) declared no potential conflicts of interest with respect to the research, authorship, and/or publication of this article.
Funding
The author(s) disclosed receipt of the following financial support for the research, authorship, and/or publication of this article: The work was sponsored by the Fund Project for Transformation of Scientific and Technological Achievements from Jiangsu Province (BA2016148) and the Fund Project for Perspective Joint Research of University–Industry Cooperation from Jiangsu Province (BY2015064-09).