
Abstract
The layout of functional areas has a great impact on the implementing of a logistics park. Existing layout models with multiple planning objectives and influencing factors are too complex to be solved. This article puts forward a two-stage layout method for functional areas in logistics parks combining a layer-by-layer analysis process and a multi-objective programming model. Base on the rational setting of functional areas, the optimization of operational processes and the quantification of the interrelations between functional areas, some green logistic goals are achieved in two stages. In the first stage, the method aims at maximizing the comprehensive relationship among functional areas and obtaining the layout structure by the layer-by-layer analysis process. In the second stage, a multi-objective planning model is established to get the location and shape of each functional area, with the goals of minimizing the material handling costs and maximizing the spatial utilization rate. A genetic algorithm is designed to solve the model. Finally, an example is put forward to verify the feasibility of the two-stage layout method, and the comparison with the previous general model is presented. This article provides a new method for the layout planning of function areas in green logistics parks.
Introduction
A reasonable layout of function areas in a logistics park can reduce the internal material handling costs, improve the spatial utilization, and optimize the coordination of different functional areas, so as to achieve the goal of green logistics. 1 The layout problems are complex and are known to be a non-deterministic polynomial-time problem. 2 It is crucial to use scientific methods to arrange the layout of functional areas within logistics parks. From the view of green logistics, the main layout problem is to obtain the locations and shapes of functional areas with their proper relationships, a low cost of material handling, and a good spatial utilization. A precisely quantitative method is needed to solve this layout problem. The existing layout methods for planning a logistics park mostly focus on the systematic layout planning (SLP) method and the mathematical optimization model.
SLP was put forward by Muther 2 based on system analysis method. It makes the layout of facilities evolves from qualitative study to quantitative study. For the lack of exact solving methods, two kinds of improvements are made in the SLP method: simulation optimization and modeling. In terms of simulation optimization, Tang et al. 3 and Zhang et al. 4 combined SLP with the Flexsim simulation software to obtain the layout of a logistics park. They used SLP to get the relative position of operating units and used the Flexsim simulation data to optimize the layout results continuously. Hosseini et al. 5 applied SLP to the multi-floor facility layout and used ARENA simulation software to optimize the result. Hidayat 6 used SLP to draw the comprehensive relationship after detailing the material handling cost and obtained the layout scheme using CARFIT software. In the aspect of modeling, Meller et al. 7 established a mixed integer programming model to solve the optimization problem of facility layout based on SLP. Zhang et al. 8 and Deng and Lin 9 both used SLP to obtain the comprehensive relationships among functional areas and established different models along with the genetic algorithm (GA).
Besides SLP, there are some other mathematical optimization models. Komaki et al. 10 and Amar and Abouabdellah 11 developed a head–tail method to design functional areas. They improved the partially constructed layout using a pair-wise exchange method with the closeness of flow and distance. Yao et al. 12 established a connection facility layout model for subway stations with the aim of improving the transfer efficiency based on data envelopment analysis model. Chen et al. 13 proposed two mathematical programming models based on split line and slicing structure technique respectively to obtain non-rectangular logistics parks layout problem. Asl and Wong 14 investigated the unequal area facility layout problem with the aim of minimizing the total material handling costs. Sun and Gao 15 set up the models for minimizing the total time considering the travel time of road sections and intersections. Zhang et al. 16 proposed an improved multi-objective cooperative co-evolutionary algorithm to solve a layout optimization problem of satellite modules.
In addition, GA is frequently used to solve facility layout problems. Hernández Gress et al. 17 proposed an improved GA using the possible binary variables assignment for the block layout design problem with unequal areas. Gonçalves and Resende 18 present a biased random key GA which can generate high-quality solutions in relatively small computing times for the unequal area facility layout problem. Hasda et al. 19 proposed a new interactive evolutionary GA based on local search algorithm for solving static facility layout problems with unequal compartments.
As mentioned above, for the layout planning of logistics parks, recent researches have made many progresses on the improvement of SLP and some optimization models. However, to the authors’ knowledge, there are some drawbacks as follows:
Most of the existing methods are based on the interrelations between functional areas, but limited literature has studied the basis of their relationships. Exact interrelations require a reasonable calculation foundation, including the operation process of logistics parks and the setting of functional areas.
The layout of functional areas is a comprehensive problem with various objectives and influencing factors. The existing mathematical models are getting more and more computationally intensive, and the convergence of optimal solution becomes more and more difficult.
The previous improvements of SLP solved the locations and shapes of functional areas arduously. Because the quantitative solution for the layout structure has been ignored, all kinds of structures had to be calculated to find the optimal solution, which increased the invalid search greatly.
To solve the first problem above, this article adopts the framework of SLP and puts forward a systematic layout method for logistics parks. It starts from the setting of functional areas and the design of operation process. Then a quantitative analysis method is proposed to get the mutual relations of each pair of functional areas from their logistics and non-logistics relationship. For the second problem, a two-stage layout program is devised to reduce the difficulty of optimization. Dividing multiple targets into two stages can make the calculation and the convergence of optimal solution easy to be done. Furthermore, a layer-by-layer analysis process is created to solve the third problem. The layout structure can be obtained accurately from the first stage and can be inputted into the second stage for determining the locations and shapes of functional areas.
The remainder structure of the paper is as follows. Section “Analytical basis” discusses the setting and relationships of functional areas, the design of operation process in a green logistics park. Following this, section “Two-stage layout method” describes the two-stage layout method in detail, including a layer-by-layer analysis and a multi-objective planning model. An example is applied to verify the entire set of method in section “Case study.” Section “Conclusion” highlights the conclusions of this study and some suggestions for future research.
Analytical basis
Notation definition
For convenient access to the notation involved in this article, there is a unified definition of various notations. The definition of parameter is shown in Table 1, and the definition of variable is shown in Table 2.
The definition of parameter.

The definition of variable.

Problem statement
The core task of logistics park layout is to arrange functional areas (Figure 1). That is, we need to determine the key variables of every functional area,
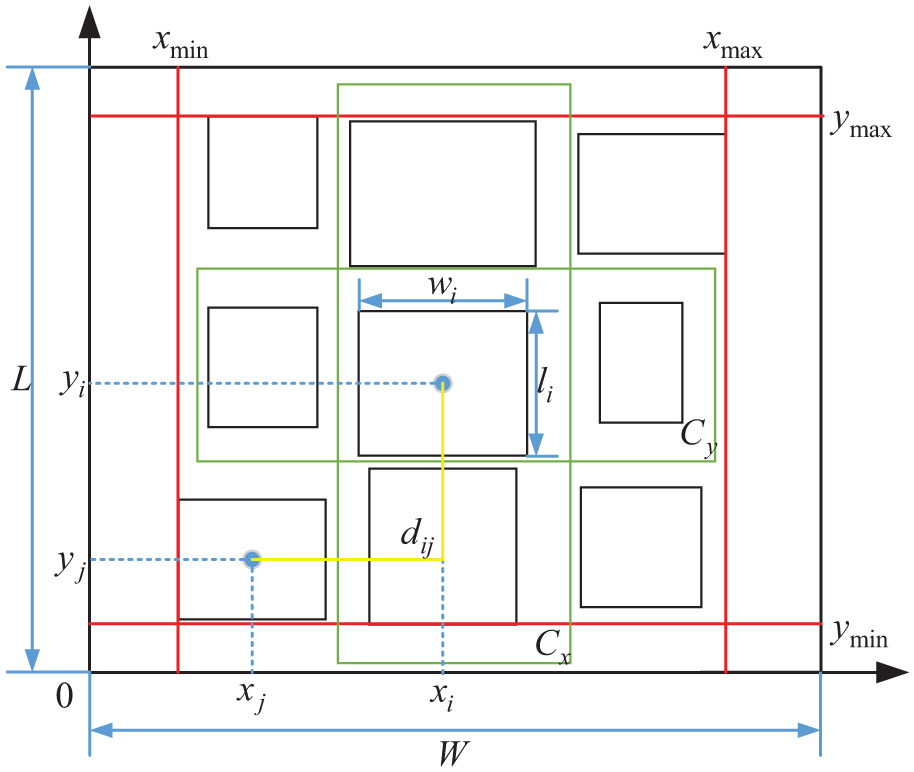
Schematic diagram of layout problem.
To solve the layout problem, the specific steps are set up as following, as shown in Figure 2. First, the integrated interrelation between any two functional areas can be obtained based on the setting of functional areas and operation process. Second, the layout structure can be got through a layer-by-layer analysis process in the first stage. Finally, the locations and shapes of functional areas can be solved by a multi-objective programming model in the second stage.

The steps of solving logistics park layout.
Functional areas
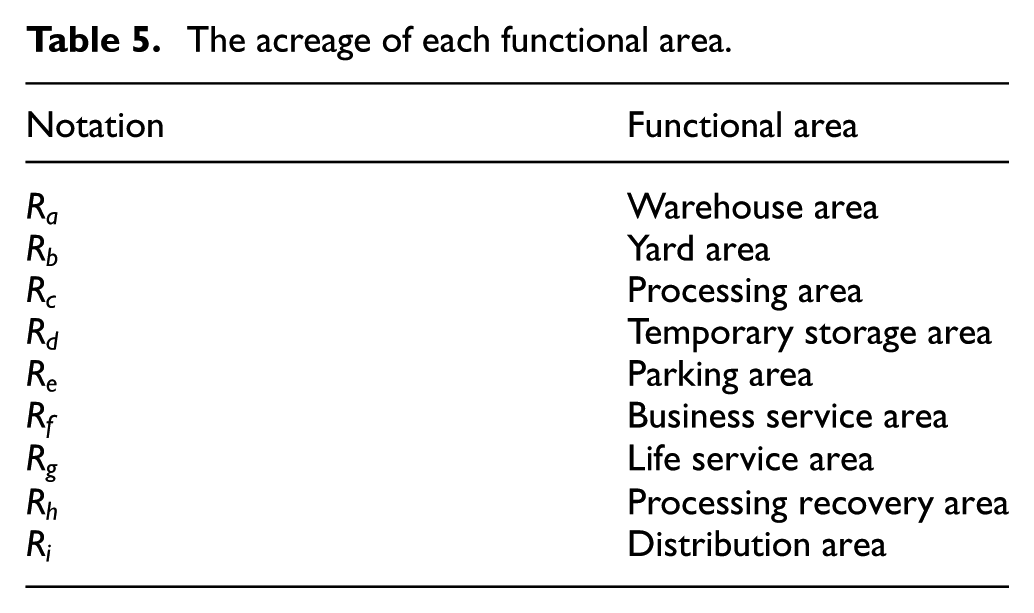
Functional area is the basic spatial unit of a logistics park. The number of functional areas is determined by the required functions. Functional areas need to be set reasonably, so that all working areas can cooperate with each other to complete logistics operations and avoid redundancy and deficiency. Based on the actual functional requirements of a modern green logistics park, its functional areas are generally set as follows 20 :
Warehouse area. It mainly stores the goods with high storage requirements. Its functions include the storage, loading, and distribution of goods.
Yard area. It is used to store large volumes of containers and large pieces of materials. Those can be stacked in the open air.
Processing area. It provides a specific space for processing business such as primary processing, packaging, and the temporary storage for goods after processing.
Temporary storage area. Loading and unloading operations may take a long time, resulting in a backlog of products. A temporary storage place for the undistributed goods is set to alleviate this backlog. It can temporarily store the goods to be distributed, so as to improve the production efficiency of the entire park.
Parking area. It provides parking lots, maintenance, and repair facilities for vehicles and mobile equipments.
Business service area. It is a centralized working area for the trade business between managers and customers.
Life service area. It provides services for employees, such as catering, entertainment, and sports venues.
Recycling treatment area. It centralizes the wastes from processing operations and recycles them to increase their added value. For an instance, the waste water from the processing and life service area can be purified and reused there.
Distribution area. It is responsible for classifying the goods to be transported and processed within the park and preparing them for the distribution.
Any functional area above can be split or combined in line with the actual situation. When a functional area is split into two or more parts, it needs to be treated as two or more separate functional areas. For example, we can divide parking areas into several parts and put them in different places in the park, and they need to be taken as separate areas.
Operation process
Generally, the operations in a green-oriented logistics park contain of loading and unloading, trading, warehousing, waste disposal, circulation processing, temporary storage, distribution, and so on. 21 The operation process is shown in Figure 3.

The operation process in a green-oriented logistics park.
Interrelation between functional areas
The dependency relationships among functional areas are the premise of layout planning. The interrelation between two functional areas includes two relationships. One is the logistics relationship, which is determined by the operation process and the logistics volume. The other is the non-logistics relationship which is determined by the setting of functional areas, 22 such as the linkages and conflicts between functional areas.
Logistics relationship
The logistics relationship can be represented by the logistics intensity. It is the proportion of logistics volume between two functional areas with sequential process relation, as shown in Table 3. 23
Logistics intensity rank.

Non-logistics relationship
There are some typical non-logistics factors between functional areas as follows 24 :
Organizational and management relationship. There may be a collaborative relationship between different functional areas when they complete some business together. Those functional areas should be closely arranged.
Functional relationship. Two functional areas should be close due to their closeness of functions and the continuous utilization of devices.
Environmental relationship. A close layout should be maintained from the perspective of green logistics and low carbon emission.
The non-logistics relationship is qualitative and subjective in some degree. It can be divided into six levels, as shown in Table 4.
Non-logistics intensity degree.

Integrated interrelation
The logistics relationships and non-logistics relationships need to be integrated when planning the layout of operation areas. With the weights of logistics and non-logistics relationships and the quantified levels of logistics intensity and closeness of non-logistics, the integrated interrelation between any two functional areas can be calculated, as in formula (1)

Two-stage layout method
In order to reduce the handling costs and make full use of spatial resources, the functional areas should be arranged closely but do not interfere with each other. In this article, a two-stage layout method is put forward. First, a layer-by-layer analysis method is designed to obtain the layout structure with the goal of maximizing the integrated interrelations of functional areas. Second, a programming model is established with the goals of minimizing the material handling costs and maximizing the spatial utilization. A GA is designed to determine the location and shape of each functional area.
Layout structure design by the layer-by-layer analysis method
There are three steps in the layer-by-layer analysis: selecting the functional area to be allocated, deciding whether to allocate this functional area or not, and arranging the functional area. The specific procedure is shown in Figure 4. The rules of the layer-by-layer analysis are as follows.

Layer-by-layer analysis procedure.
Rule 1: selection
Put functional areas to different layers. The layer of functional areas declines by their integrated interrelation. The pair of functional areas with the greatest integrated interrelation is deployed to the highest layer.
The upper layer should be allocated prior to the lower layer.
The arrangement order of the same layer is based on the frequency of two areas in all the paired functional areas. Calculate the sum of frequency, the higher one should be given priority.
If two or more paired functional areas have the same frequency, the sum of the frequency in their lower layer should be calculated to make sure the arrangement order. If their frequencies are still the same, the sum of the frequency in their further lower layer should be calculated. If their lowest frequencies are still the same, choose one of them randomly.
The procedure of Rule 1 is shown in Figure 5.

Procedure of Rule 1.
Rule 2: judgment
1. Define four sets as follows: A: The generating layout of functional areas. B: The paired functional areas to be allocated. DR: An element in the set B that belongs to B but does not belong to A. DL: An element in the set A that belongs to A but does not belong to B.
From the relationship between set A and set B, it can be determined whether the functional area belongs to DR or belongs to DL. The functional area in set DR can be arranged by Rule 3. The functional area in set DL will be permanently ignored.
2. Determine the relationship between A and B: If there is no element in A, the two elements in B will be set as the functional areas to be allocated. If there is no same element in A and B, B will be temporarily ignored in this round. If A contains all the elements in B, B will be permanently ignored. If A and B have the same elements but B has one element that A does not have, then set
3. Put the functional area to be allocated into Rule 3.
The procedure of Rule 2 is shown in Figure 6.
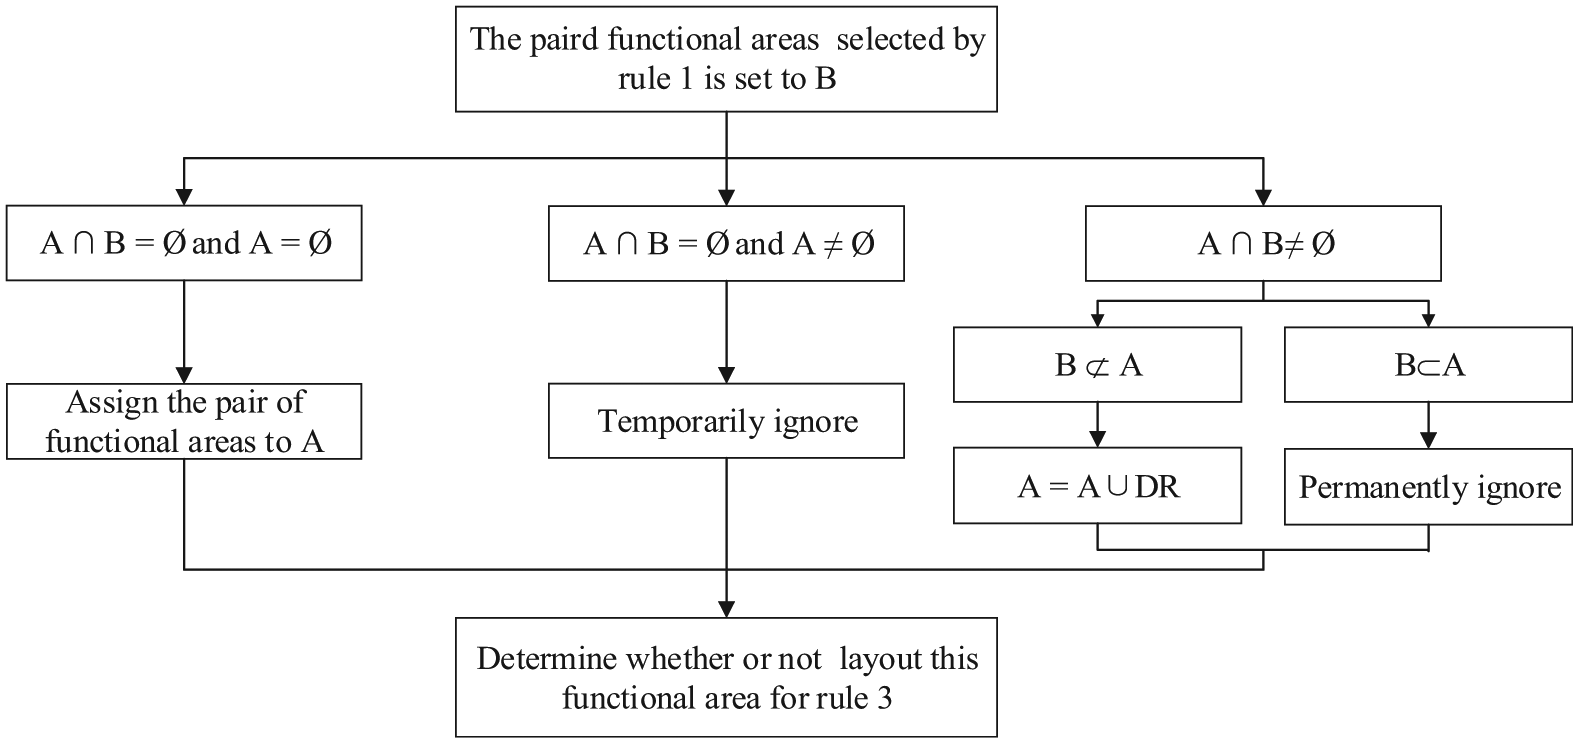
Procedure of Rule 2.
Rule 3: arrangement
There are eight positions around any functional area. Four first-level close positions of a functional area are in the horizontal and vertical orientations, and four secondary-level close positions are in the 45° inclined directions. The first-level locations are prior to the secondary-level positions.
If there is a first-level position around DL, DR is arranged here.
If there are two or more positions, calculate the correlation between DR and the functional areas around those locations, and arrange DR in the position with the highest correlation.
If some correlations are the same, DR should be arranged in a position with the largest number of functional areas in the direction of this position.
If there is no first-level position, arrange DR in a secondary-level position. Similarly, determine the location based on the correlation.
The procedure of Rule 3 is shown in Figure 7.

Procedure of Rule 3.
Location and shape determination by the multi-objective programming model
Multi-objective planning model
Assumptions
The planning logistics park is abstracted as a rectangle and the planning area is known.
Each functional area is abstracted as a rectangle with a known scale, and the aspect ratio changes within a certain range.
The edges of each function area are parallel with the sides of the logistics park, and the channel is set up between two functional areas.
The entrance and exit are set at the midpoint of each function area.
Model construction
The multi-objective planning model is given with two objective functions and eight corresponding constraints, as in formulas (2)–(11)


Subject to
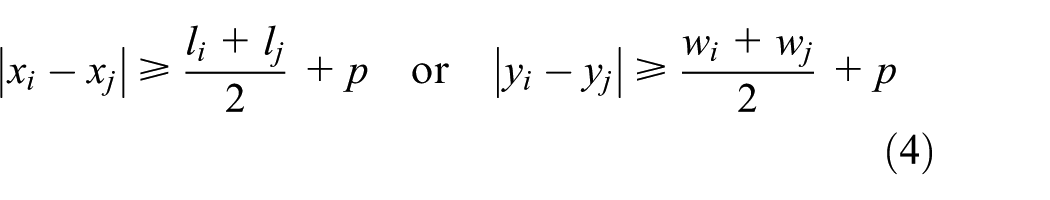


Formulas (2) and (3) are the objective functions. Formula (2) is the minimum of material handling costs between functional areas. Formula (3) is the maximum of spatial utilization. Formulas (4)–(11) are constraints. Formula (4) ensures that no functional area overlap others. Formulas (5)–(8) are obtained from the layout structure. Formulas (5) and (6) represent a fixed interval between the adjacent functional areas. Formulas (7) and (8) represent that the central functional areas do not shift. Formulas (9) and (10) ensure that no functional area exceed the boundaries of the park. Formula (11) ensures the restriction of aspect ratio.
Note that in the first stage, based on the layer-by-layer analysis, we can determine the layout structure, which is the positional relationship between any two functional areas. This relationship can help us to get
Genetic algorithm
A GA is designed to solve the multi-objective planning model. It contains chromosome coding mechanism, individual fitness evaluation, genetic operator, and operation parameters. 25
Coding
One of the layout objectives is to minimize the cost of material handling, which is determined by the distance between any two functional areas. The layout of the logistics park requires the distance between functional areas to be higher precision, so as to calculate the material handling costs accurately. Therefore, the floating-point number is selected for encoding, and chromosomes are represented by the center coordinates and aspect ratios of each functional area. The chromosome form is
Initial population
Chromosomes are generated in a random manner. Be sure of that no functional area overlaps or exceeds the park boundary. If it is not satisfied, regenerate, until M chromosomes are generated.

Fitness function
The GA will seek the minimum value of the objective function. The value of the objective function is positive, so we use the reciprocal representation of the fitness function value. In the large-scale layout optimization problem, the constraint conditions bring great difficulties. Therefore, a penalty function is used to embody the fixed interval constraint and the center invariant constraint, and the penalty value P is a positive enough.
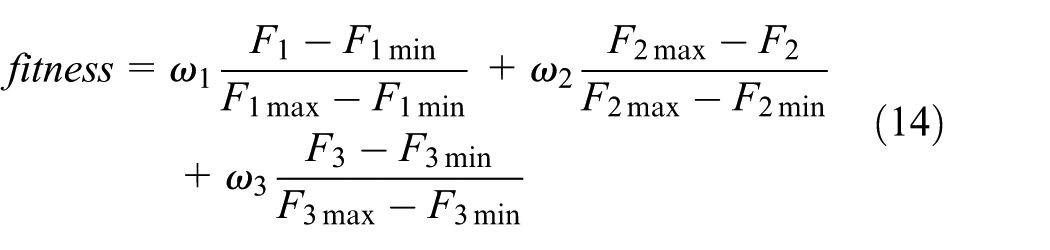
Since the dimensions of two objective functions are different, the normalized processing is performed, and the fitness function after processing is shown in formula (12)

where

Selection operator
A new population is generated by the roulette selection and the fitness-proportionate selection.
Crossover operator
The single-point crossover is used. After two chromosomes cross, determine whether or not the constraints, formulas (4), (9), and (10), are satisfied. If the constraints are not satisfied, cross again.
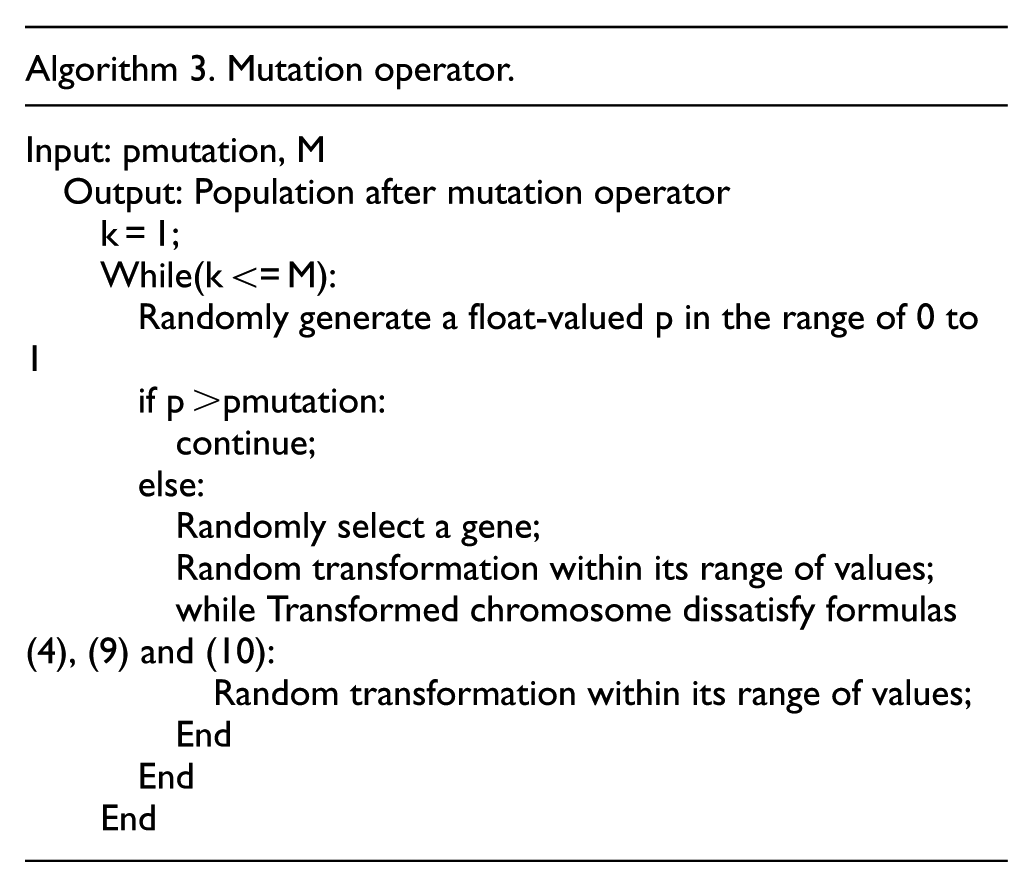
Mutation operator
The standard variation method is adopted. Determine whether to vary according to the mutation probability. After the mutation, determine whether the constraints, formulas (4), (9), and (10), are satisfied. If the constraints are not satisfied, vary again.
Case study
In this section, we design a comparative test to show the superiority of the two-stage layout method. In order to distinguish the results of two different methods, we set the result of the two-stage method as (1) and the result of the previous general method as (2).
Case description
Logistics Park S is planned to be built in the northeast of Changchun city. It is designed as an integrated logistics park including transshipment, warehousing, processing, distribution, business trade, freight forwarding, and other functions. The main service objects are steels and auto parts.
The operation of the whole logistics park requires the cooperation among functional areas. The functional areas and their acreages are shown in Table 5.
The acreage of each functional area.
According to the volume proportion of the materials transported between the functional areas in Logistics Park S, a combination of the operation process and the logistics volume is figured out, as shown in Figure 8.

Combination of operation process and logistics volume.
Interrelation of functional areas
Logistics relationship
According to the method in section “Logistics relationship,” the logistics relationship between functional areas can be obtained, as shown in Table 6.
Logistics relationship.

Non-logistics relationship
According to the method in section “Non-logistics relationship,” the non-logistics relationship between functional areas can be obtained, as shown in Table 7.
Non-logistics relationship.

Integrated Interrelation
According to Tables 6 and 7, with a weighted ratio of 2:1, let Z = 4, E = 3, I = 2, O = 1, U = 0, X =−1, the integrated interrelation between functional areas can be obtained, as shown in Table 8.
Integrated interrelation.

Layout scheme solving
Layout structure
According to the layer-by-layer analysis method in section “Layout structure design by the layer-by-layer analysis method,” we devise a solving program by the MATLAB compiler. Input the integrated interrelation in Table 8, the layout structure of Logistics Park S can be obtained, as shown in Figure 9.

Layout structure.
Location and shape
Parameters of multi-objective model
Set the lower left corner of the region as the origin of coordinates; the X-axis is the length, and the Y-axis is the width.
The setting of individual parameters is mainly based on test results and park scale. According to our experiments,
Values of individual parameters.

For the convenience of calculation,


Parameters of GA
The real number coding method is used for chromosomes. Each chromosome contains 27 genes with 3 genes in one group. The three genes represent the X-axis coordinates, the Y-axis coordinates, and the aspect ratio of the nine functional areas, respectively. The environmental parameters of GA are shown in Table 10.
Environmental parameter setting.

Result
With the GA program written by MATLAB, the optimal population, the mean change trend and the optimal chromosome can be obtained, as shown in Figure 10 and Table 11, respectively.

The trend of optimal solution (1) and mean change of population (1).
Optimal chromosome gene (1).

It can be seen from Figure 10 that the population is converged to a stable state after around 100 generations, and the optimal fitness value is 0.4990. According to the optimal chromosome gene (1) in Table 11, the center coordinate, the length, and width of each functional area can be obtained, as shown in Table 12.
Central coordinate, length, and width of gene (1) (unit: m).

According to Table 12, the final layout scheme of the logistics park is obtained, as shown in Figure 11.

Layout (1) of Logistics Park S.
Result analysis
The previous general method 20 is a mathematical model with the interrelation of functional areas. The aims of the previous model are maximizing the comprehensive relationship among functional areas, minimizing the cost of material handling and maximizing the spatial utilization rate. In order to emphasize the advantages of the two-stage layout method, the previous general method is applied to solve the same problem under GA, and the results of those two methods are compared.
Previous general method
Objective functions
Minimizing material handling costs between functional areas, the same as shown in formula (1);
Maximizing spatial utilization, the same as shown in formula (2);
Maximizing comprehensive relationship among functional areas

There,
Constraints
Do not overlap between any functional area, the same as shown in formula (3);
The boundaries of each functional area do not exceed the boundaries of the park, the same as shown in formulas (8) and (9);
There is a restriction of aspect ratio, the same as shown in formula (10).
Genetic algorithm for solving
To compare the differences between the two methods, the GA solution model here is nearly the same as the two-stage layout method; only the fitness function is modified
There are two main differences between the optimization model in the second stage and the previous general method:
The numbers of objective functions are different. The previous general method has three targets and the two-stage layout method splits three targets into two stages.
The optimization model in the second stage will obtain a detailed design based on layout structure, so its constraints are more than those in the previous general method, as formulas (5)–(8).
Previous general method for park layout
Parameter setting
Most of the parameters are the same as in section “Location and shape.” Here are some different parameters.
The individual parameters include
Values of individual supplementary parameters.
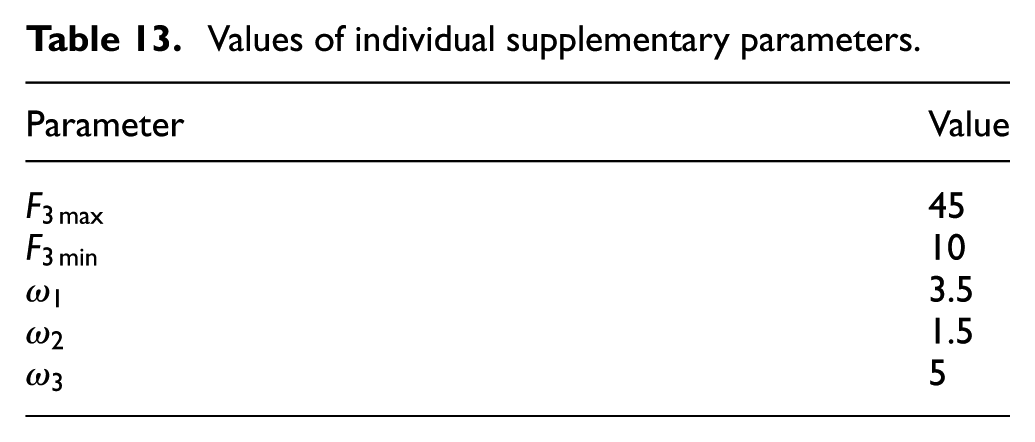
The comprehensive relationship G should be set according to Table 8. Since the values are the same, it is not written in detail here. Chromosome and environment setting are the same as in section “Location and shape.”
Computational result
With the GA program written by MATLAB, the optimal population, the mean change trend, and the optimal chromosome can be obtained, as shown in Figure 12 and Table 14, respectively.

The trend of optimal solution (2) and mean change of population (2).
Optimal chromosome gene (2).

It can be seen from Figure 12 that the population is converged to a stable state after around 100 generations, and the optimal fitness value is 0.8186. According to the optimal chromosome gene (2) in Table 14, the center coordinate, the length, and width of each functional area can be obtained, as shown in Table 15.
Central coordinate, length, and width information of gene (2) (unit: m).

According to Table 15, the final layout scheme of the logistics park was obtained, as shown in Figure 13.

Layout (2) of Logistics Park S.
Comparison
To compare the differences between two methods, the values of the two-stage layout method with three objective functions are calculated. The comparison is shown in Table 16.
The result comparison of two methods.
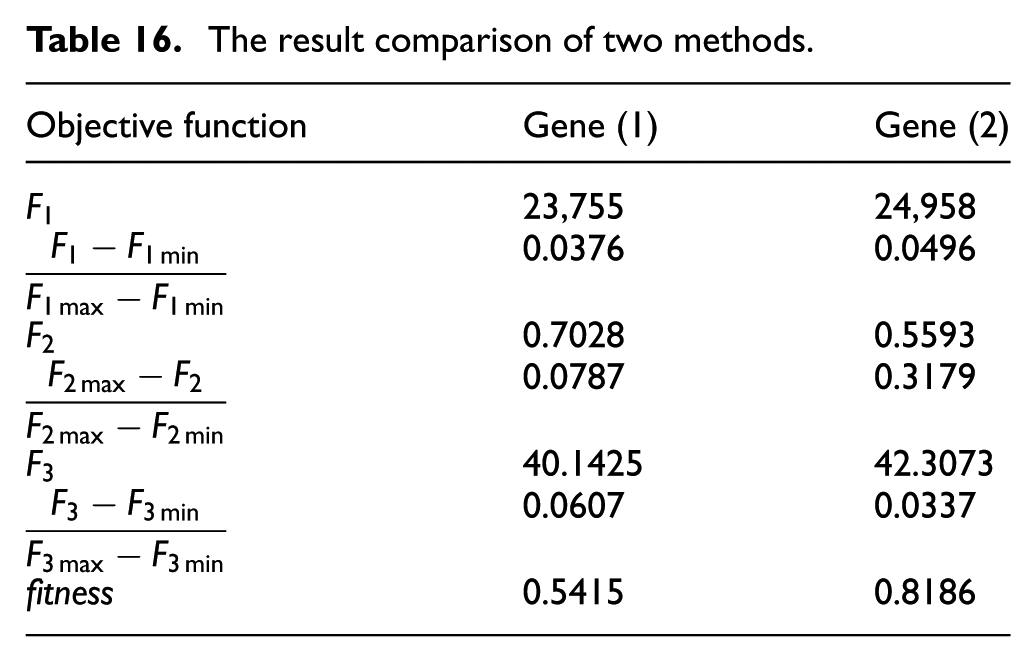
From Table 14, gene (1) is superior to gene (2) in two objective functions,
The reasons are as follows:
The multi-objective model of the two-stage method only has two objective functions
The comprehensive relationship between some functional areas is interference which contradicts the spatial utilization, so the two-stage logistics method is significantly better than the general method in the objective function
The two-stage layout method has fewer objective functions, so it can converge faster when solving.
In summary, when there are some conflicts between the objective functions, the two-stage layout method can solve the conflicting targets separately and get better results. Besides, the result of convergence can be obtained faster using the two-stage layout method when there are more objective functions.
Conclusion
The layout planning of a logistics park is a systematic problem. The existing studies neglect the basis of the relationships among functional areas and the relevance between the layout structure and the detailed layout. Therefore, the previous models have to search the optimal solution in a large scope. This article designs a two-stage layout method to get the overall arrangement scheme satisfying the functional and green demand of a logistics park. The main work and contributions of this article are as follows:
In order to obtain the reasonable interrelations of functional areas, the setting of functional areas and operation process is analyzed in this article. The composition of functional areas is provided to satisfy the functional requirements of a green logistics park and reduce the functional redundancy. Also an efficient operation process is proposed. Those basic elements are the guarantee for the rationality of the layout.
To achieve the optimal layout quickly, a two-stage approach is designed. In the first stage, the layout structure is obtained using the layer-by-layer analysis method which aims at maximizing the integrated interrelation between functional areas. In the second stage, the midpoint coordinates and shapes of every functional area are determined by the multi-objective programming model which aims at minimizing the costs of material handling and maximizing the spatial utilization rate. When a multi-objective problem is solved in a staged way, the solving difficulty is reduced largely.
For decreasing the search workload while planning the detailed layout, a layer-by-layer analysis is provided to achieve a quantitative layout structure. The analysis method has three rules, selection, judgment, and arrangement. Through those three rules, we can get the layout structure with the maximum comprehensive relationship among functional areas.
Although this study has made big innovations in the internal layout of a logistics park, it still has some insufficiency and is worth some further research. The subsequent research can introduce the influence of the road network structure and design a model with the consideration of smoothness. In addition, the study assumes that all functional areas are rectangular, but there may be different shapes in practice. Further study needs to be made on those assumptions.
Footnotes
Handling Editor: Jiangchen Li
Declaration of conflicting interests
The author(s) declared no potential conflicts of interest with respect to the research, authorship, and/or publication of this article.
Funding
The author(s) received no financial support for the research, authorship, and/or publication of this article.