
Abstract
The cruising taxi industry has been greatly impacted by the development of the ride-hailing taxi services like the Didi and Uber. The service orders of cruising taxis fell 35% or more. To intervene the conflicts between the cruising and ride-hailing taxis, system dynamics model of cruising taxicab price was proposed by considering the competitive relationships between online ride-hailing and cruising taxis. The proposed model was calibrated and validated by the taxi operational data in Ningbo. Simulation experiments were designed to explore the impact of the cruising taxi price changes on the balance of market supply and demand. Simulations were divided into two scenarios: one was under the different levels of supply and demand at peak and low peak; the other was under the different proportions of ride-hailing taxi. The results indicate that (1) the market supply and demand are close to equilibrium during peak hours when the price increases by ¥0.6 per kilometer. The increased price can reduce the peak demand level effectively and also increase the total earning of cruising taxis; (2) when the service order ratio of cruising taxis to ride-hailing taxis accounts for about 10:4.5 and 10:8, the price increases by ¥0.6 per kilometer and decreases by ¥0.4 per kilometer to achieve the equilibrium of demand and supply, respectively. That is, when the cruising taxis have an advantage over the ride-hailing taxis, the price of cruising taxis should be raised to gain more benefits. Instead, the cruising taxis price should be decreased to improve their competitiveness.
Introduction
As an important part of the city’s comprehensive transportation system and a supplement of urban public transport system, taxicabs provide personalized transport services to the public. 1 By the end of 2015, there were 4627 taxis in Ningbo and their passenger volume completed accounts for about 25% of public transport. However, the trips of the cruising taxis were dropped by more than 35% over a 3-year period in Ningbo under the influence of ride-hailing service like the Didi and Uber. 2 Many taxi strikes against Didi and Uber happened in many cities in China. 3 In order to solve the conflicts between the ride-hailing services and the traditional cruising taxicabs, the Ministry of Transportation has issued the regulation on deepening reform and promoting the healthy development of taxi industry in China. The regulation clearly announces that it is necessary to establish a dynamic adjustment mechanism of taxicab price for adjusting equilibrium of supply and demand in taxi industry. 4
Actually, the price of cruising taxicabs is regulated by the government in China. 5 The pricing system of local government only regulates the highest standard and permits the taxicab companies to choose the reasonable fare under the highest price autonomously and change the price periodically. 6 However, the taxi companies only follow the highest price and never float the price because there is not an adjusting method of taxi price. Meanwhile, the pricing system of local government does not consider the competition with the ride-hailing taxi. 7 Thus, an unreasonable pricing strategy leads the cruising taxi at an unfavorable competitive position. Many scholars studied on the influential factors of the taxi pricing system.8,9 The uniform pricing mode was provided for the governmental guidance and only regulated the fixed price.10,11 Because the taxi market was motivated by temporally non-stationary demand and supply, the uniform and single price was unable to adapt to the supply and demand dynamics. 12 It also restricts market competition and weakens the price adjustment for the equilibrium of demand and supply. A flexible pricing mechanism is a useful method to keep the taxi vacancy rate under an optimal level. 13 However, there was little work on the topic of dynamic taxi pricing strategies considering the competition between cruising and the ride-hailing taxis.
Therefore, the system dynamics was applied to establish the dynamic pricing model of the cruising taxis by considering the competitive relationship with online ride-hailing taxis. Meanwhile, the proposed model also intensified the price adjustment for the equilibrium of demand and supply. Then, the cruising taxi prices under peak and low-peak levels of demand were analyzed by simulation experiments. The prices under the different service order ratios of cruising taxis to ride-hailing taxis were analyzed for gaining the competitive advantages. The results can provide technical support for the sustainable development of the cruising taxi industry.
Methodology
The cruising taxi pricing system is a multi-variable, multi-stakeholder (taxi drivers, operators, passengers), multi-feedback complex system.14,15 There are many uncertain factors in the process of its development and evolution. Meanwhile, the various factors interact with each other and each variable is constantly evolving and changing. For these difficulties, the system dynamics model was applied to reflect the various influential factors and solve problems concerning modeling of complicated system. 3
System dynamic model of the cruising taxi price
Analysis on the influential factors of the cruising taxi price
Based on the theory of urban traffic planning, the influential factors include many aspects: taxi demand, taxi supply, taxi attraction rate, the number of total taxis, taxi revenue, taxi income, operating cost of taxi, and the growth rate of taxi vehicles. Attraction rate of different traffic modes was applied to describe the competitive relationship between the cruising and ride-hailing taxi. As shown in Figure 1, a cause–effect relationship chart for taxi pricing system was presented by analyzing the relationships among the influential factors. The transmission chain of the influential factors was generated logically by the feedback loops.

Cause and effect relationship chart for the cruising taxi pricing system.
System flow diagram and structural equation model
Based on the established system causal diagram, the relationships among the parameters and variables were determined by the actual data in Ningbo city. As shown in Figure 2, system flowchart of the cruising taxi pricing system was concluded by analyzing the cause and effect relationships with the Dynamic System method. The state variables consist of the attraction rate, fare of change, and taxi growth rate. A delay function was brought to describe the market effect of the new taxi which would be launched after a period of time.
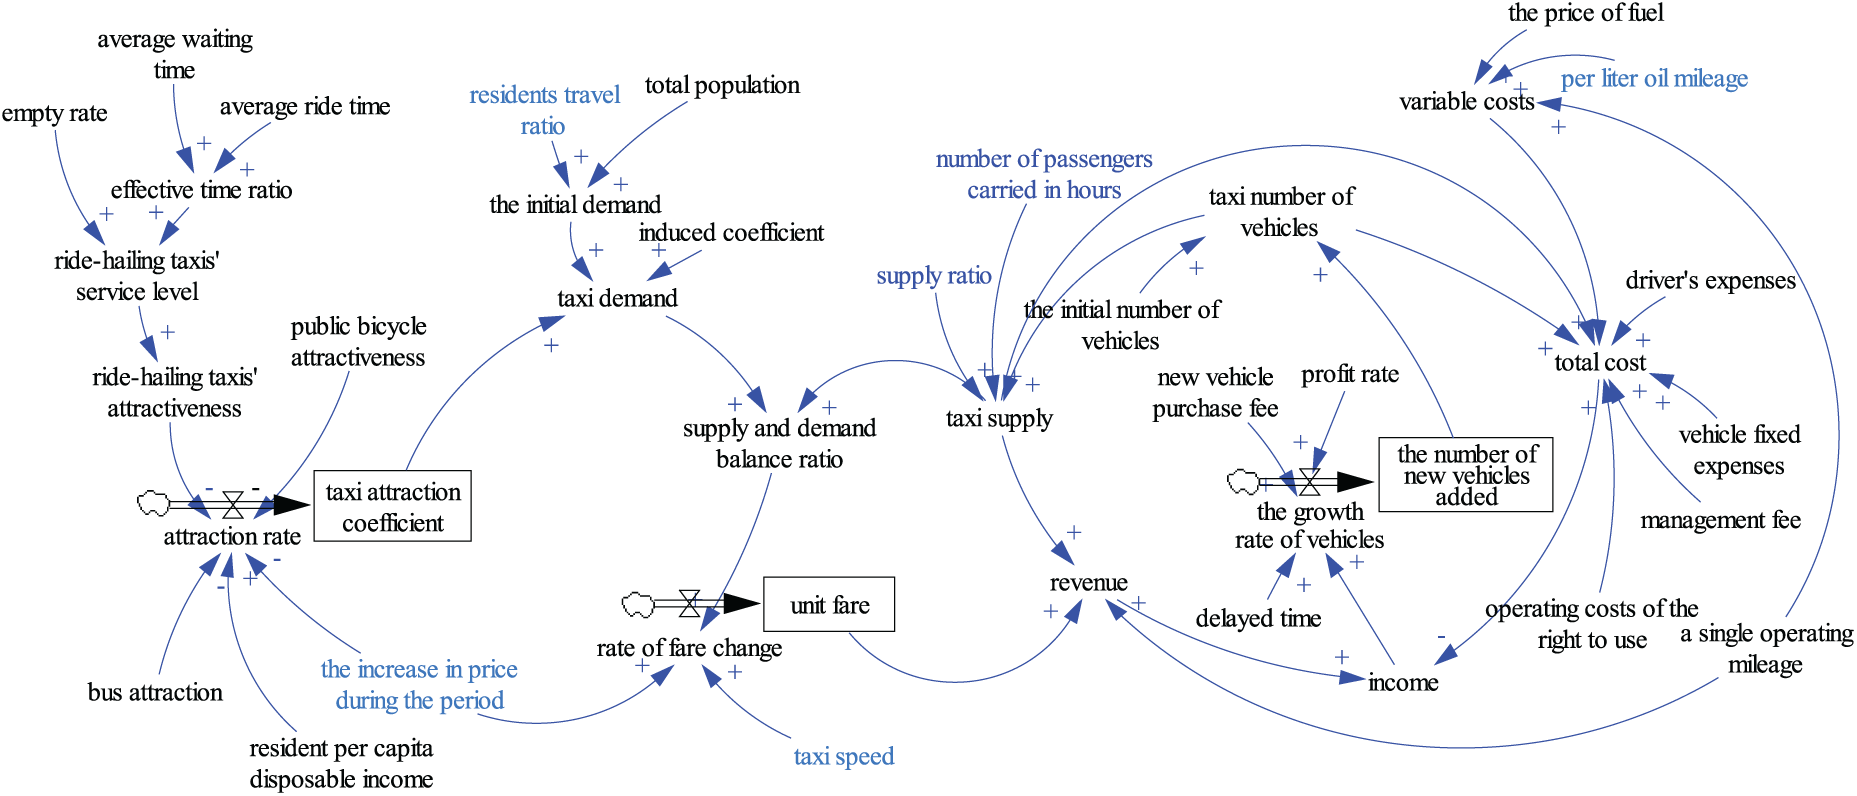
System flowchart of the cruising taxi pricing system.
The structural equations among the variables contained in Figure 2 were as follows:
A1 supply and demand balance ratio = taxi demand/taxi supply
A2 taxi supply = taxi number of vehicles • supply ratio • number of passengers carried in hours
A3 taxi number of vehicles = the initial number of vehicles + the number of new vehicles added
A4 taxi demand = the initial demand • taxi attraction coefficient • induced coefficient
A5 the initial demand = total population • residents travel ratio
A6 variable costs = a single operating mileage • the price of fuel • 24 • 30/mileage per liter of oil
A7 total cost = (variable costs • taxi supply) + (driver’s expenses + vehicle fixed expenses management fee + operating costs of the right to use) • taxi number of vehicle
A8 income = revenue - total cost
A9 effective time ratio = average ride time /(average ride time + average waiting time)
A10 ride - hailing taxis’ attractiveness = (ride - hailing taxis’ service level)/β1 (13.8)
A11 ride - hailing taxis’ service level = empty rate •β2(0.8) + effective time ratio •β3(0.8)A12 revenue = taxi supply • unit fare • a single operating mileage • 24 • 30 •β4(0.63)
The rate equations and delay functions contained in Figure 2 are as follows:
R1 attraction rate = (ln(residents per capita disposable income) - (the increase in price during the period •β5(4) + bus attraction + public bicycle attractiveness + ride - hailing taxis’ attractiveness))•β6(1/80)
R2 rate of fare change = supply and demand balance ratio •β7(0.075)+
In the formula,
Data collection and validation of the model
The data mainly came from the database of Ningbo taxi management information system. The operational data of the cruising taxi were calculated. Based on the latest Origin–Destination (OD) survey and questionnaire survey in Ningbo, the proportions of residents choosing a cruise taxi and a ride-hailing taxi were obtained. A survey on the ride-hailing taxi was conducted during peak hour (7:00 a.m. to 9:00 a.m. or 4:30 p.m. to 7:00 p.m.), and the operational data of the ride-hailing taxi were collected. After simple processing, the data are shown in Table 1.
Ningbo taxi operation–related parameter table.

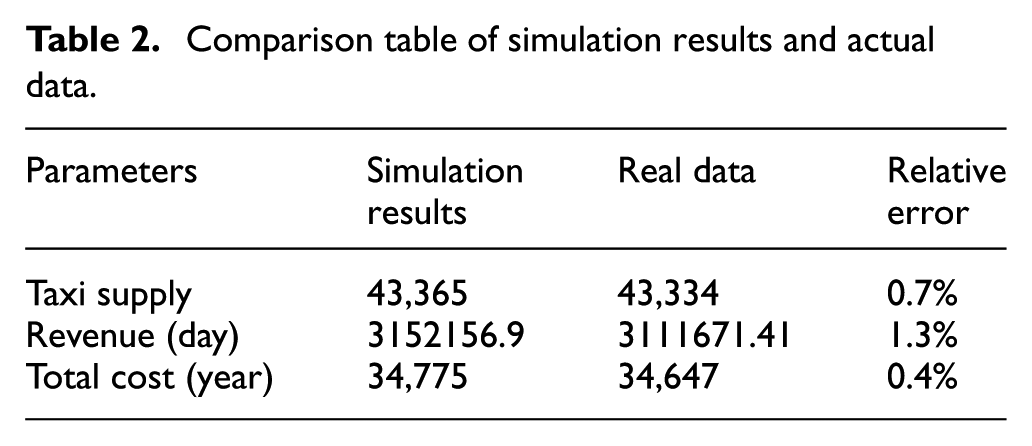
The effectiveness of the proposed model was calibrated and validated by the taxi operational data in Ningbo. To compare with the actual operating data of Ningbo taxi in 2017, the absolute errors between the observed results and simulated results are less than 5% in Table 2, which indicates that the proposed method is effective for simulating the cruising taxi pricing system.
Comparison table of simulation results and actual data.
Model application
Taken the cruising taxis in Ningbo as an example, simulation experiments were designed to explore the impact of the cruising taxi price changes on the balance of market supply and demand. Simulations were divided into two conditions: one was under the different levels of supply and demand at peak and low peak; the other was under the different proportions of ride-hailing taxi. The impact of price fluctuation on supply and demand balance was analyzed. In the simulation, travel sharing ratio of ride-hailing taxis in the market was applied to describe the attraction of ride-hailing taxis.
Analysis on dynamic adjustment of taxis prices at peak and low-peak demand level
Operational data indicate that the demand of the cruising taxis is higher during peak hours than low-peak hours. However, the drivers are not willing to work during the peak hours, and the number of the drivers reduces because of traffic jam. This leads to the shortage of the cruising taxis and makes it harder for passengers to ride. In order to motivate the taxi drivers to work harder during peak hours, increasing the driver’s earnings is the most straightforward way to increase the taxi supply through increasing the taxi’s price. Meanwhile, the peak demand of passengers was reduced by increasing the taxi’s price because the traveler would not choose the taxi with the high cost based on travelers’ mode choice behavior. The increased price of taxi is effective for decreasing the demand and increasing the supply, so as to achieve the equilibrium of supply and demand. On the contrary, the taxi demand is low and the vacancy rate of taxi is high during the low-peak hours. Dropping the taxi price is an effective way to increase the attraction rate of taxis.
According to the actual data analysis of taxi market survey in Ningbo, the increase in taxi prices that most residents can accept is ¥0.4 per kilometer to ¥1 per kilometer. Therefore, the simulation uses 0.2 as the incremental value and chooses a lower limit of 0.2 and an upper limit of 1.2 as the analysis object (the same below). As shown in Figure 3, the line “peak 1,”“peak 2,”“peak 3,”“peak 4,”“peak 5,” and “peak 6” represent the values of the variable (“the increase in price during the period”) is ¥1.2 per kilometer, ¥1 per kilometer, ¥0.8 per kilometer, ¥0.6 per kilometer, ¥0.4 per kilometer, and ¥0.2 per kilometer. As shown in Figure 3(a), price fluctuation can change the balance of supply and demand in the taxi market. The supply–demand ratio of “peak 4” basically balances supply and demand in the market (taking the average of the middle section, the supply–demand ratio is about 1, the same below). Therefore, it is more appropriate to increase the price by ¥0.6 per kilometer during peak hours. In addition, the proportion of passengers who choose the cruising taxi declines as the taxi price rises, but the overall earning of the cruising taxi still increases in Figure 3(b)–(d).

Simulation results for peak hours under different prices: (a) the equilibrium ratio of taxi supply and demand, (b) rate of price change, (c) taxi attraction coefficient, and (d) taxi income.
As shown in Figure 4, line “low peak 1,”“low peak 2,”“low peak 3,”“low peak 4,”“low peak 5,” and “low peak 6” indicate that the values of the variable (“the decrease in price during the low-peak hour”) are −¥0.2 per kilometer, −¥0.4 per kilometer, −¥0.6 per kilometer, −¥0.8 per kilometer, −¥1 per kilometer, and −¥1.2 per kilometer. As shown in Figure 4(a), the supply–demand ratio of “low peak 3” basically balances supply and demand in the market. Therefore, it is appropriate to consider decreasing the price of ¥0.6 per kilometer during low-peak hours. As shown in Figure 4(b), the attraction coefficient of cruising taxis increases with the decrease in the price. That means the decreased price increases the number of taxis’ service order in the low-peak hours.

Simulation results for low-peak hours with different prices: (a) taxi supply and demand balance ratio and (b) taxi attraction coefficient.
Analysis on the dynamic adjustment of taxi prices under the competitive conditions of ride-hailing taxis
The simulation analysis on the dynamic adjustment of taxi price was carried out by considering the competitive conditions of ride-hailing taxis in the market. The competitive relationships between ride-hailing and cruising taxis were described by the proportion of their travel sharing in the market. Based on the real taxi data in Ningbo city, two scenarios of simulations were implemented. First, the service orders of the cruising taxis in the market enhance (called advantage in the following text) as the attraction of the ride-hailing service decreases. Second, the service orders of the cruising taxis in the market weaken (called disadvantage) with the growth of the ride-hailing taxi. The current service order ratio of cruising taxis to ride-hailing taxis is 10:6.5 (data from Ningbo City Administration of Customs). Taking the current ratio as a control group, the dynamic adjustment strategies of the cruising taxi price under the different conditions of competitive advantage (e.g. 10:4.5) and disadvantage (e.g. 10:8) were simulated, respectively.
The ratio is 10:4.5 (i.e. the proportion of the ride-hailing service in the mode of residents’ travel is about 0.045). As shown in Figure 5(a), the supply and demand of the cruising taxi under different levels of the price are described. The line “ride-hailing taxi” is for the control group, and lines “a,”“b,”“c,” and “d,” respectively, mean the unit price increases ¥0.2, ¥0.4, ¥0.6, and ¥0.8 (the same in the following). The results show that when unit price increases by ¥0.6, the supply and demand basically reached a status of equilibrium. Similarly, the ratio is 10:8. As shown in Figure 5(b), when the unit price reduced to ¥0.4, supply and demand basically reached a status of equilibrium.

Operating results of cruising taxis under different price conditions: (a) 10:4.5 and (b) 10:8.
Similarly, the service order ratios of cruising taxis to ride-hailing taxis account for 10:7, 10:7.5, 10:8, and 10:10, and the prices for the cruising taxi decrease ¥0.1 per kilometer, ¥0.3 per kilometer, ¥0.4 per kilometer, and ¥0.6 per kilometer, respectively. When the cruising taxi holds a competitive disadvantage, it can decrease the price moderately to reduce the loss of income and improve its own competitiveness. When the service order ratios are 10:6.5, 10:5.5, 10:5, and 10:4.5, the cruising taxi prices increase ¥0.1 per kilometer, ¥0.3 per kilometer, ¥0.4 per kilometer, and ¥0.6 per kilometer. It can be found that when the cruising taxi is in a competitive advantage, it can increase the price moderately to obtain more benefits. According to the data of the Ningbo Taxi Management Information System, 5000 people apply for the registration of the qualification certificate for the ride-hailing taxi. But, only about 1200 people passed the certification test. The competition between ride-hailing and cruising taxis in the market business is unclear. Therefore, it is necessary to propose different tactics for adjusting the price of the cruising taxi in view of the different proportion of the service sharing in the market.
Conclusion
In order to promote the further reform of the taxi industry in China, a system dynamics model of cruising taxicab price was proposed by considering the competitive relationships between online ride-hailing and cruising taxis. The parameters were calibrated and validated by the operational data of cruising taxis and ride-hailing taxis in Ningbo. Then, simulation experiments were designed to explore the impact of the cruising taxi price changes on the balance of market supply and demand. The results indicate that the dynamic pricing strategy has significant influence on the balance of supply and demand of taxi. The peak demand was effectively controlled by the rise in the price. That means higher price reduces the proportion of citizens who choose the cruising taxis as a travel mode. But the increased price can still ensure the increase in the total earning of cruising taxis. Taking the operational data of taxi in Ningbo as an example, the results show that the supply and demand are close to equilibrium during peak hours when the price increases by ¥0.6 per kilometer on the current standard of the price. It is helpful to reasonably adjust the relationship of taxi demand and supply using price lever.
The simulation experiments about the competition between cruising taxis and ride-hailing taxis were also designed for improving the competitiveness of the cruising taxi. The results indicate that the dynamic price of the cruising taxi can also solidify and strengthen its position in competition with the ride-hailing taxi. Although the market relationship between cruising taxis and ride-hailing taxis are regulated clearly by the Ministry of Transportation, the ride-hailing taxi market is unstable, easily influenced by outside factors like the security issues, the capital issues and the public defense. Therefore, it is necessary to propose dynamic pricing tactics for the cruising taxi in view of the different proportion of the service order sharing in the taxi market. In this article, the competitive relationships between ride-hailing and cruising taxis were described by the proportion of their travel sharing in the market. Based on the real taxi data in Ningbo, two scenarios of simulations were implemented: First, cruising taxis have an advantage over ride-hailing taxis. When the service order ratio of cruising taxis to ride-hailing taxis accounts for about 10:4.5, the price increases by ¥0.6 per kilometer; second, cruising taxis have a disadvantage over ride-hailing taxis. When the service order ratio of cruising taxis to ride-hailing taxis accounts for about 10:8, the price decreases by ¥0.4 per kilometer. The results mean that when the cruising taxis have higher competitiveness than the ride-hailing taxis, the price of cruising taxis should be raised to gain more benefits. Instead, the cruising taxis price should be decreased to improve their competitiveness. The dynamic price is useful for the cruising taxi to gain fair competition with online ride-hailing taxi.
Footnotes
Acknowledgements
The authors would like to express their sincere thanks to the anonymous reviewers for their constructive comments on an earlier version of this manuscript.
Handling Editor: Hai Xiang Lin
Declaration of conflicting interests
The author(s) declared no potential conflicts of interest with respect to the research, authorship, and/or publication of this article.
Funding
The author(s) disclosed receipt of the following financial support for the research, authorship, and/or publication of this article: This research is supported by the National Natural Science Foundation of China (Nos 51408322 and 71861006) and Natural Science Foundation of Jiangsu Province (BK20150747).