
Abstract
Due to the development of thin slab hot rolling technology, hot rolling thin strip at a higher speed is inevitable. As a result of high-speed rolling, thin slab is deformed at a wide range of strain rate inside the rolling zone. Because the flow stress of steel is strongly dependent on strain rate at elevated temperature, it is imperative to consider its variation when calculating roll force and roll pressure. By substituting time with speed and length, strain rate variation is obtained. A strain rate–dependent flow stress curve for non-oriented silicon steel is implemented into Karman equation to calculate rolling pressure distribution. It is revealed that the rolling force can be effectively reduced by decreasing the radius of work roll. It is further revealed that the appearance of strip/roll surface sticking is more likely at the exit of rolling zone than the neutral point, because strain rate reaches zero and the flow stress drops at the exit. Combined with Influence Function Method for elastic deformation of roll surface, the proposed model can predict roll force with a good accuracy compared with industrial data.
Introduction
Deformation resistance stress generated during strip rolling has a direct impact on rolling pressure and roll force. Roll force is a key parameter in the process control of hot strip rolling, and its computational accuracy directly determines thickness precision, strip shape quality, and rolling stability.1,2 Therefore, getting a more accurate roll force has received substantial attention among researchers worldwide.3,4 During hot strip rolling process, the strip is rolled at 1050°C–850°C. In this temperature region, the strip displays strong viscosity besides elasticity and plasticity. In other words, the deformation stress of strip is strongly dependent on strain rate.5,6 Consequently, roll pressure and roll force are by this means influenced by strain rate and the viscosity of strip during hot rolling, respectively.
There is shear effect in thick plate rolling, but it is negligible in strip rolling process. 7 Finite element method 8 serves as an indispensable tool for rolling force prediction, but its calculation cost is unbearable for online use. 9 Karman equation 10 remains to be one of the most welcomed roll force models. Le and Sutcliffe 11 investigated thin foil rolling under large roll deformation by coupling Karman equation for pressure prediction with Influence Function Method for roll deformation. Wang et al. 12 developed an analytical slab method in the context of asymmetrical cold rolling. Based on the assumption that the plate is deformed under full sticking friction condition, Razani et al. 13 developed an asymmetrical model to study thick plate rolling. Chen et al. 14 improved the Karman equation to incorporate sticking friction in the context of hot strip rolling. However, the effect of rate dependency on roll force is seldom discussed in previous studies. Furthermore, the steel micro-scale behavior also closely relates to strain rate.15,16 Crystal scale dynamic recovery and dynamic recrystallization are induced by strain rate, and these effects in turn relax the resistance stress curve.17–19 Therefore, strain rate dependency or viscosity deserves a more in-depth investigation in the context of roll force calculation during hot strip rolling.
This article introduces elastic-viscous-plasticity into Karman equation for predicting rolling pressure during industrial hot thin strip rolling process. For the sake of completeness, the authors also include the effects of strip and work roll elastic deformation. Stick/slip friction criterion is judged by resistance stress to prevent the friction stress from exceeding resistance stress. An industrial application is made on the last stand of a CSP® hot finishing rolling mill, 20 as shown in Figure 1. It consists of seven-stand four-high rolling mill, and the strip is non-oriented silicon steel. The loopers are positioned at inter-stand to control strip flow. The strip is first threaded through the seven stands, run-off table (ROT), and coiled by coilers. Once the strip is threaded, tension stress in strip is established. The rolling speed is the largest at the last stand, and it has to be reduced when rolling the head and tail of strip.

Illustration of seven-stand hot finishing rolling in CSP® industrial line.
Chemical composition of non-oriented silicon steel and its deformation resistance stress
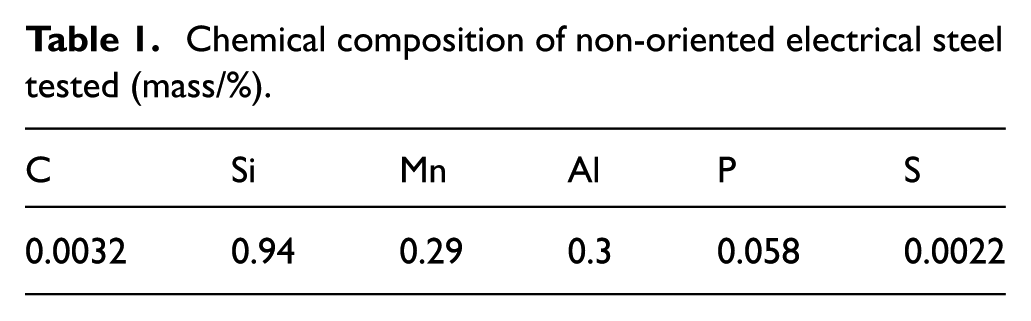
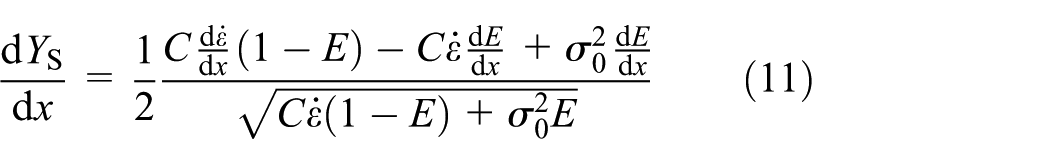
The chemical composition of the rolled non-oriented steel is listed in Table 1. Hot compression experiments were conducted in a wide temperature range from ferrite to austenite and at various strain rates by Gleeble 3500. 11 A flow stress model based on dislocation theory is proposed in equation (1), in order to describe its deformation resistance stress at different strain and strain rates at a rolling temperature of 850°C

where
Chemical composition of non-oriented electrical steel tested (mass/%).
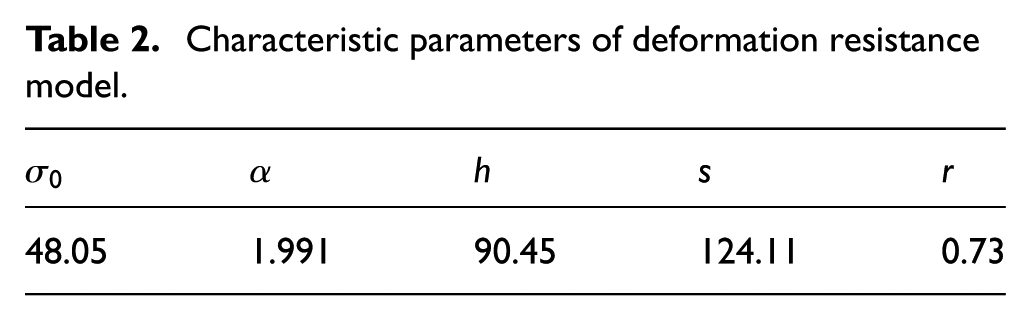
Characteristic parameters of deformation resistance model.
Development of a strain rate–dependent Karman equation
Karman equation
Figure 2 shows that the rotating work roll bites in the strip and reduces its thickness inside the rolling region. Through force equilibrium equation in vertical direction, the unknown compression pressure

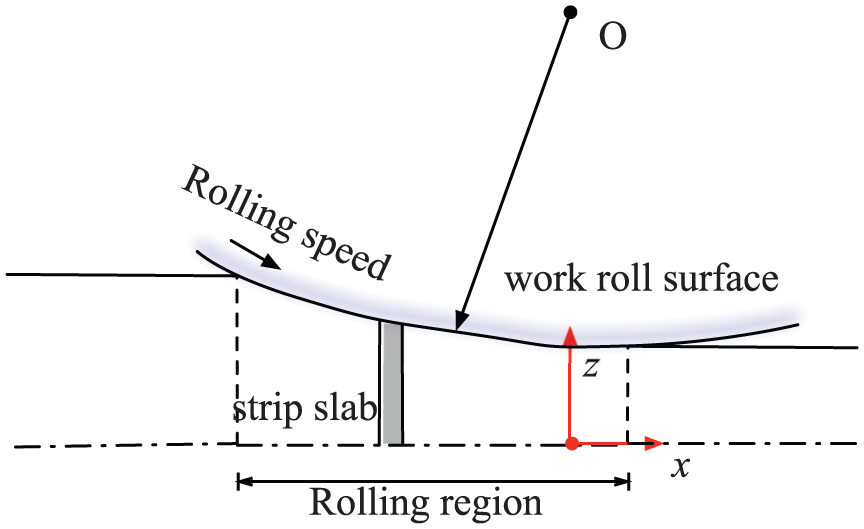
Illustration of the roll bite zone.
Equilibrium equation in horizontal direction further gives the Karman equation in equation (3) for the thin slab element shown in Figure 3

where

Force diagram on a strip slab element.
Calculation of work roll surface elastic deformation
Roll deformation and its contour are responsible for plate shape. And the above calculated vertical pressure on node i has to be interpolated onto the work roll surface to calculate the resulted elastic deformation of work roll surface at node j and roll center O, as shown in Figure 4. A linear shape function in x and a step function in y are used to discretize the pressure distribution in equation (4)

with

and

where w is the strip’s width. So that the radial elastic deformation of the work roll surface can be calculated by Boussinesq approximation 21 in equation (7)

where
In practice, z is neglected from equation (7). The real elastic deformation of work roll surface uf can be calculated by equation (8)

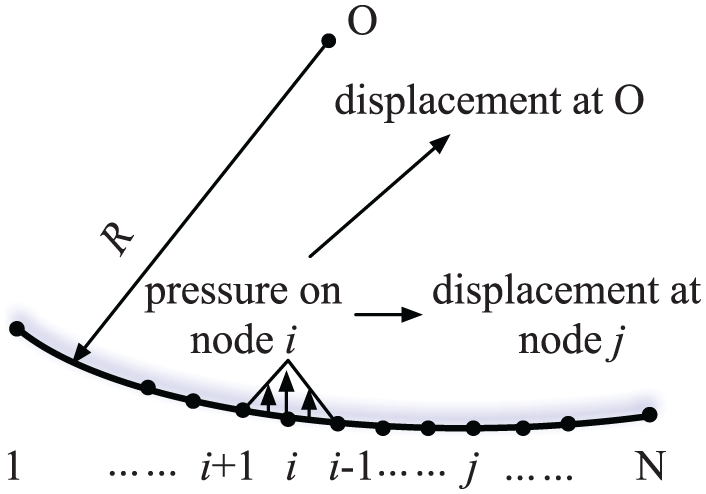
Meshing on the work roll surface.
These hand-calculated expressions are the influence function coefficient of work roll elastic deformation. They are computed and stored as a vector.
Calculation of strain and strain rate
Considering an infinitesimal slab element shown in Figure 3 during strip rolling process, the strain can be calculated by equation (9)

where t is the slab thickness at x and

where V is the speed at position x and
where

Friction regulation
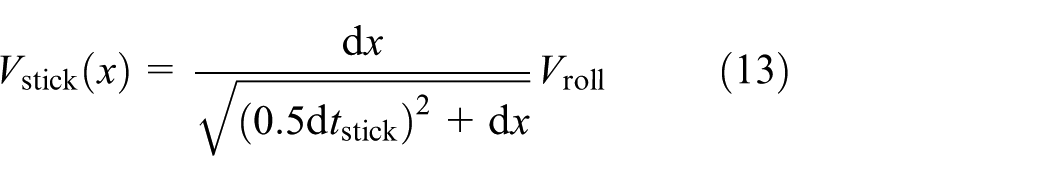
The horizontal speed of strip and roll are equal at the neutral position of the rolling region, so that the speed at every location can be calculated forward and backward in accordance with the friction regulation by equation (12)

where the positive sign is for the backward slip/stick friction at entry and the negative sign for the forward friction near the exit, and
where

Strip elastic deformation
The vertical elastic strain of the strip is given by equation (15)

where

where the first term on the right side of equation (16) can be neglected, so that equation (17) is derived
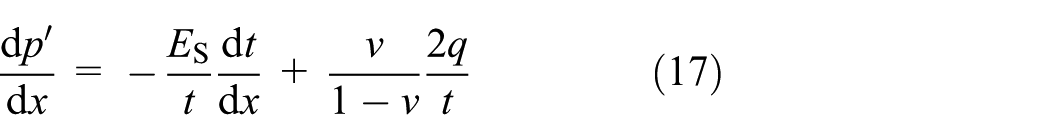
Combine equations (17) and (12), so that the rolling pressure in elastic zone under slipping friction condition can be calculated by equation (18). As soon as the friction exceeds resistance stress, the rolling pressure is calculated by equation (19)


Strip plastic deformation
In the plastic region, a Tresca yield criterion is assumed by equation (20)

Substituting equation (20) into equation (3), equation (21) is obtained

Combining equation (21) with equation (12), the rolling pressure in plastic region under slipping friction can be calculated by equation (22)

Once the slipping friction exceeds deformation resistance stress, the strip is deformed by sticking friction and the rolling pressure is calculated by equation (23)

Horizontal tension stress is simultaneously integrated by a fourth-order Runge–Kutta method throughout the bite zone

Solution procedure
The solution proceeds with one inner iteration for the neutral point calculation and a global iteration for the deformed work roll surface calculation. The flow chart of the procedure is shown in Figure 5. The solution proceeds as follows: first, the roll surface is divided into 400 dividends in x, and the strip is divided into 8000 slab elements. For the inner iteration, the strip thickness distribution and slip/sticking condition are taken as known from the previous iteration and then the resulted velocity at every location of x is calculated by equations (12)–(14). Strain and strain rate are calculated using equations (9) and (10) starting from neutral point to the entry/exit. The deformation resistance stress and its derivative are calculated by equations (1) and (11). Then, starting from the entry point, integrate equations (18) and (24) under slipping friction, or equations (19) and (24) under sticking. As soon as yield condition (20) is satisfied, integrate equation (22) or equations (23) and (24) until thickness re-increase in the bite region, then elastic unloading takes place, again using equation sets (18 or 19) and (24). A combined bi-section and secant method is used to determine the neutral point position, so that the exit tension stress is equal to the front tension and friction condition is stable. For the outer iteration, the calculated vertical pressure distribution is taken as known, but slowly updating by a relaxation factor, so that the elastic deformation of roll stack can be obtained by equation (7). This problem is fully determined, as soon as we assign the exit thickness at the lowest point of deformed work roll surface. The inner and outer iterations are judged converged when a given residual of stress and work roll shape are achieved. It is found that guessing an initial neutral point located closer to the exit than the entry point is beneficial for convergence. 4-7 iterations are needed to achieve convergence, and the CPU cost can be within second @4 GHz Inter Core i7.
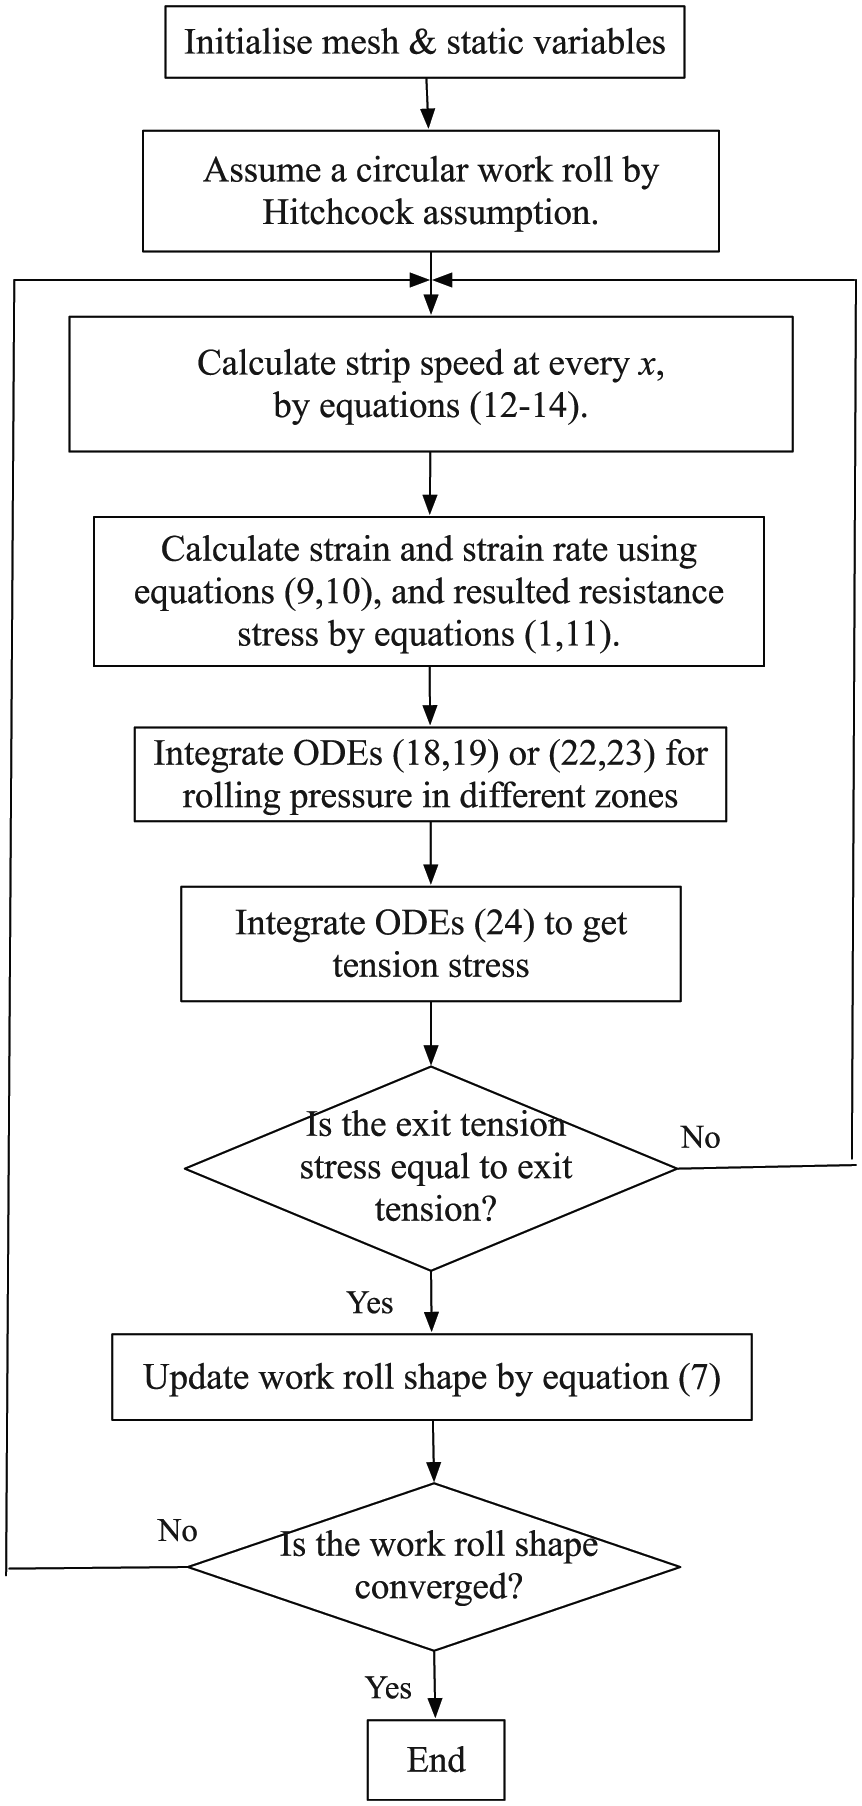
Flow chart of the solution procedure.
Results and discussion
Under different ratios of rolling speed/radius, industrial data were obtained. The control parameters are as follows: back/front tension was 13.75/0 MPa, entry/exit thickness was 2.866/2.325 mm, the elastic modulus of roll was 210 GPa, and the temperature of strip was 850°C. The work roll radius and rolling speed are the varying parameters. The friction coefficient is determined and checked by one set of the industrial data, and it is set as 0.1. With the increase in the speed/radius ratio, the rolling force first increases and then decreases, as shown in Figure 6. The calculated results show the same tendency. The effect of work roll contour and resulted strip shape on roll force is proven to be about 7% by calculation of the proposed model.

Comparison between calculated force and measured values.
The calculated stress distributions are shown in Figure 7. It can be seen that the rolling pressure first increases from zero to the highest value at the neutral point, where the shear stress reverses its sign. The distribution of horizontal stress shows that the strip is under tension at the entry of rolling region because of the add back tension and then the strip is under compression as it moves to the neutral point. After reaching the lowest compression stress, the horizontal stress increases to zero at the exit. The largest value of flow stress also appears near the neutral point and drops at the exit of rolling region. It is because the strain rate is at the largest value at the entry and drops to zero at the exit, while strain of strip increases from zero to largest, as shown in Figure 8.
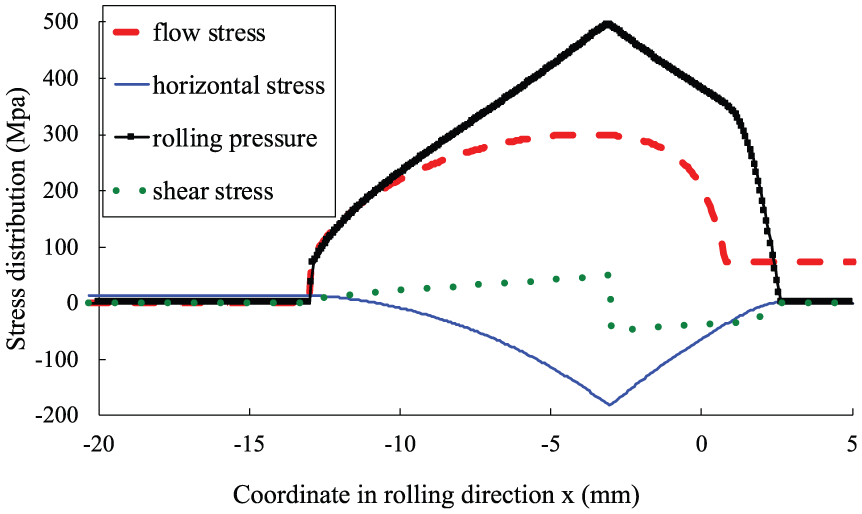
Stress distributions in rolling region.
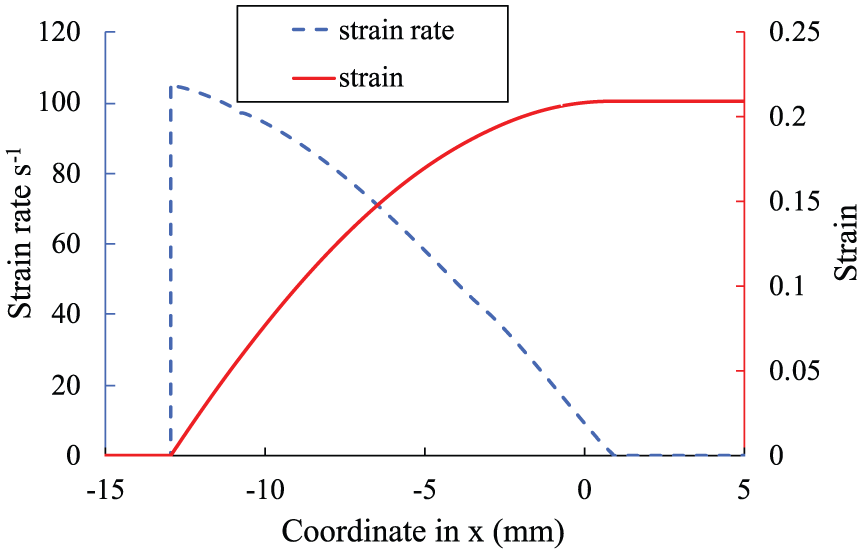
Calculated strain and strain rate distribution.
There is a positive correlation between speed/radius ratio and strain rate, as shown in Figure 9. As the strain rate gets larger, the flow stress becomes larger. Although the flow stress and strain rate reach the largest value with respect to the largest speed/radius ratio, the contact length however is the smallest, because the radius is the smallest, which results in the lowest rolling force. Calculated rolling forces against varying roll radius and rolling speed are shown in Figure 10. As can be seen that at a constant radius, the increase in rolling force is slower than the increase in rolling speed. At the same rolling speed, the rolling force increases almost linearly as the roll radius increases.

Maximum strain rate and flow stress with different speed/radius ratios.

Calculated rolling force against different radius and speed.
To further study the stick/slipping friction regulation during hot strip rolling, rolling pressure and shear stress under various friction coefficients are calculated. They are shown in Figures 11 and 12, respectively. When the friction coefficient is small (miu = 0.1), there is no occurrence of sticking friction. As the coefficient increases to 0.2, the sticking criterion is first met near the end of plastic deformation zone. The second sticking zone appears at the neutral point when the friction coefficient is increased to 0.3. As for the rolling pressure, it does not further increase with the increase in friction coefficient. The roll surface deformation is still moderately small, and the contact length of strip and work roll extends more toward downstream than upstream.

Rolling shear stress under varied friction coefficient.

Rolling pressure under varied friction coefficient.
Conclusion
A new analysis is presented for hot rolling thin strip including rate dependency. The proposed model can predict rolling force inside the rolling region at a low computational cost. Instead of assuming a constant yielding resistance stress and neglecting viscosity, the present model calculates strain rate explicitly by substituting time with velocity and length in the rolling region. Then, a strain rate–dependent deformation resistance stress curve for non-oriented steel is implemented into Karman equation for hot strip rolling.
The model suggests that resistance stress first reaches the highest value at neutral point and drops at exit, because the decreasing strain rate cancels the increasing of strain. When the rolling speed is increased, the strain rate and deformation resistance stress are increased. Using smaller roll radius, the rolling force can be effectively reduced, because the length of rolling region becomes smaller. Friction regulation plays a vital role in calculation of roll force, because it prevents the roll pressure from becoming too large due to increased friction coefficient.
Compared with industrial data, the proposed model can predict rolling force with a good accuracy; further work is needed to describe more accurately flow stress of steel under high strain rate and the varying temperature inside the rolling region.
Footnotes
Handling Editor: Michal Kuciej
Declaration of conflicting interests
The author(s) declared no potential conflicts of interest with respect to the research, authorship, and/or publication of this article.
Funding
The author(s) disclosed receipt of the following financial support for the research, authorship, and/or publication of this article: This research was supported by National Natural Science Foundation of China (No. 51604024), Beijing Natural Science Foundation (No. 3182026), the Tribology Science Fund of State Key Laboratory of Tribology (No. SKLTKF16B11), and Fundamental Research Funds for the Central Universities (No. FRF-TP-17-002A2).