
Abstract
To provide helpful suggestions to bus companies regarding reducing the number of bus accidents and improving public transportation safety, we further researched the relationship between driving skills and driving behaviors; bus drivers from six bus companies of the Hefei Bus Group were investigated. The reliability and validity of the Driver Behaviour Questionnaire, the Driver Skill Inventory, and 287 valid questionnaires were tested; the relationships between the Driver Behaviour Questionnaire and Driver Skill Inventory factors were explored; and their influence on traffic accidents was analyzed by structural equation modeling. Significant positive associations were found between driving experience and safety motive, whereas negative relationships were found between errors and safety motive. Safety motive has a negative effect on violations, and violations are the most important factor leading to traffic accidents. Therefore, bus companies should enhance safety education, and interventions should not only directly relate to the involvement of bus drivers in traffic accidents but also consider the role played by violations.
Introduction
Buses are commercial vehicles designed and equipped for urban and suburban transportation. Buses are also among the most important means of public transportation for urban residents living and working in China. 1 In recent years, the Chinese government has introduced a series of policies to encourage the development of public transportation and has prioritized public transport. Urban residents are increasingly inseparable from public transportation. At the same time, as a kind of urban transportation mode that can adapt to sustainable development, public transportation must provide safe, fast, and comfortable travel conditions for urban residents. The rationale for prioritizing the development of public transportation is to ensure the safety of public vehicles and sustainable development. The development of road traffic is a double-edged sword because it can lead both to many disasters and benefits to people. Buses can carry numerous people, and in 2015, 76.54 billion passengers were transported by public transport lines in China. 2 Buses are a relatively slow mode of transport over short driving distances, because of the large number of bus passengers, in the event of a traffic accident, numerous casualties and substantial economic losses could occur. In addition, the magnitude of congestion due to collisions involving buses could be greater than normal for its size. The occurrence of public transport traffic accidents threatens the travel safety and travel efficiency of the general public (pedestrians, drivers, and passengers).
Various research results have shown that humans represent the most important factor of all factors leading to traffic accidents. More than 90% of accidents are due to human involvement, and drivers are directly responsible in 81% of accidents. Therefore, the driver is the main cause of traffic accidents. 3 Professional drivers are exposed to traffic conditions for long periods of time and are more likely to have traffic accidents. 4 Driving behavior refers to the driving operation performed by the driver for a certain driving purpose. Driving behavior is mainly influenced by the driver’s cognition and motivation. A driver’s unsafe driving behavior is the main cause of road traffic accidents, which has been recognized all over the world. 5 The same also applies to bus drivers. 6 Given the large number of lives carried on a bus, the bus drivers have a major security responsibility. Once the accident happens, it will cause bad social impact. Therefore, to prevent traffic accidents effectively and enhance the safety of public transportation, studies on the factors of bus drivers are of great significance both in theory and in practice.
Domestic and foreign scholars have conducted many studies investigating the driving behavior of bus drivers. Regarding personality traits, the effects of altruism, job burnout, 7 public awareness, and social anxiety 8 on the driving behaviors of bus drivers have been studied. Verma et al. 9 explored the relationship between sensory-seeking behavior and the occurrence of accidents in Indian bus driver samples. Useche et al. 10 studied the impact of social psychological factors and fatigue related to work pressure on the dangerous driving behaviors of bus drivers. Tiznado et al. 11 conducted a study investigating the Santiago Public Transport System in Chile and found that economic incentives could effectively improve the performance of drivers. Amponsah-Tawiah and Mensah 12 believe that the safety atmosphere is negatively correlated with risky behaviors, such as speeding, violations, and inattention.
There are also many studies conducted by domestic and foreign scholars on the aberrant driving behavior of bus drivers. Shi and Zhang 7 investigated the relationship among an altruistic personality, aberrant driving behaviors, and the potential role of burnout. YW Huang et al. 8 examined bus drivers’ self-consciousness, social anxiety, and aberrant driving behaviors. In a large sample of bus drivers, Mallia et al. 13 used a personality-attitudes model to assess whether personality traits predict aberrant self-reported driving behaviors (violations, errors, and lapses), both directly and indirectly, through the effects of attitudes toward traffic safety. In addition, previous studies have often considered risky driving behavior. Măirean and Havârneanu 14 evaluated the relationships among the better-than-average effect, aggressive driving, and risky driving behavior. Hayley et al. 15 suggested that poor emotional control may impede an individual’s ability to make safe behavioral decisions while driving. Scott-Parker et al. 16 examined the driving purposes reported by young drivers, including the relationship with self-reported risky driving behaviors, including offenses. Yi 17 studied the influencing factors and mechanisms of the formation of bus drivers’ poor driving behavior using a combination of a questionnaire design and an empirical study investigating mainstream traffic behavior, traffic security, and traffic sociology. Regarding the research methods of driving behavior, some scholars adopted a real vehicle test 18 while others use questionnaire.19,20
Driving skill is also a main influencing factor of driving behaviors. Consolidating and realizing this series of complex new action systems requires repeated practice. Driving skill refers to the ability of the driver to control a vehicle safely in a specific road traffic environment. High levels of driving skills are conducive to the driver’s ability to identify and react to dangerous objects and events in the traffic environment, to evaluate the information input around the vehicle integrally, and to make his or her corresponding driving behavior consistent with the goal of safe driving. Zhuang et al. 5 established a regression model and found that driving skills have a significant predictive effect on risky driving behavior. The results from a study of Australian and Finnish drivers showed that those with good driving skills have more dangerous driving behaviors. 21 However, current studies on the driving behaviors of bus drivers and the occurrence of accidents ignore the influence of the most basic driving skill factor. Especially in China, where there are a large number of vehicles and people, the road traffic environment is more complicated, and the driving skills of bus drivers are more demanding.
To more comprehensively understand the drivers’ driving behavior, a questionnaire assessing driving behavior is used. The Driver Behaviour Questionnaire (DBQ) and the Driver Skill Inventory (DSI) were introduced in this study. The DBQ is one of the most widely used instruments for measuring self-reported driving behaviors. Reason et al. 22 proposed the first DBQ, which contained a total of 50 items, in 1990. Martinussen et al. 23 conducted a DBQ investigation involving Danish drivers and ultimately identified the following three types of driving behaviors: violations, errors, and lapses. Thereafter, many scholars have used the DBQ to conduct studies. Martinussen et al. 24 also measured aberrant driving behavior using the original DBQ to test the factorial validity and reliability of the instrument across different subgroups of Danish drivers. Özkan and Lajunen 25 developed an instrument for measuring positive driver behaviors to investigate the relationships among these behaviors, DBQ scales (violations and errors), aggression, traffic offenses, and accidents. According to Martinussen, driving behavior can be assessed by measuring self-reported driving skills. The DSI is used to measure perceptual-motor skills and safety skills. 23 According to W Zhang et al., 26 the factors of the DSI are “safety consciousness,”“technical driving skill,” and “risk perception.” Driving skills were also measured by the DSI in the study by XL Zhang. Based on a factor analysis, driving skills include the following three aspects: basic driving skills, advanced driving skills, and safety driving skills. 27 Driving skills, which were measured by a 28-item DSI by Chang et al., 28 are grouped into a three-factor structure, containing basic skills, advanced skills, and safety motives.
Therefore, this article describes a cross-sectional study that was conducted using the questionnaire survey to evaluate the relationship between the driving skills and driving behaviors of motorists in Hefei, China, and to explore the impact of driving skills and driving behaviors on accidents. This article aims to explore the driving skills and driving behaviors of Chinese bus drivers and their impact on traffic accidents to provide suggestions regarding the management of bus drivers and improving the safety of the bus system.
Materials and methods
Materials
The questionnaire consists of three parts: demographic information, the DSI, and the DBQ. The demographic information included gender, age, driving experience, education level, penalty points in 2016, penalty points in 2017, the number of accidents in 2016, the number of accidents in 2017, and so on. In addition, the drivers’ rewards and punishments were investigated. The DSI and the DBQ are based on the classic questionnaires, which have been widely used in the industry.
Driving Behaviour Questionnaire
The DBQ is used to evaluate the drivers’ dangerous driving behaviors and has been widely used at home and abroad.29–31 In addition to the original DBQ comprising 50 items as described in a study by JT Reason et al., 22 many scholars have developed different versions in recent years. For example, the Swedish DBQ (DBQ-SWE) contains 104 items, 32 and the revised version for French drivers includes 41 items. 33 To avoid an excessive number of time-consuming questions resulting in participants feeling tired and a low completion rate, a DBQ with 27 items 34 was used as the initial survey scale in this article. The higher the score, the greater the propensity to drive dangerously.
Driving Skill Inventory
The DSI 32 was used to evaluate the driving skill level of the drivers. The drivers were required to answer in the form of self-report, and each item was scored on a 5-point Likert-type scale ranging from 1 (complete nonconformity) to 5 (total consistency). The higher the score, the better the driving ability.
Participants
A total of 321 bus drivers from six bus companies of Hefei Bus Group participated in the study. All bus drivers volunteered to participate in the questionnaire. They were told that their personal information would not be disclosed and that it would take 15–20 min to complete the questionnaire. Since 34 drivers provided incomplete information on the questionnaire, their data were excluded, resulting in 287 valid questionnaires being ultimately obtained. The participants included 252 males and 36 females ranging in age from 22 to 58 years old and with an average age of 38.8 years (standard deviation (SD) = 8.7). These participants had an average driving experience of 14.4 years (SD = 8.4), and their average experience driving buses was 9.1 years (SD = 7.2). In 2016 and 2017, the proportion of drivers with penalty points was 12.5% and 10.1%, respectively, and the proportion of drivers who had traffic accidents was 29.3% and 33.8%, respectively.
We conducted a random selection of drivers at the parking lots of six bus companies belonging to the Hefei Bus Group and asked if they would like to participate in a survey, and the volunteers completed the questionnaires.
Data analysis
An exploratory factor analysis (EFA) was used to extract the factors of the DBQ and DSI, and the reliability was determined by Cronbach’s α coefficient. The Pearson correlation coefficient method was used to analyze the correlations among the demographic variables, rewards, punishments, and the DBQ/DSI. Finally, the establishment of the structural equation model involved the study of the relationship between several latent variables, in an attempt to explore the relationship between DBQ and DSI factors and their impact on bus traffic accidents.
Results
Reliability and validity testing of the DBQ and DSI
To ensure the dependability and effectiveness of the research results, scales with high reliability and validity are required. The Kaiser-Meyer-Olkin (KMO) test statistics for the DBQ and DSI are 0.891 and 0.916, respectively, both of which are greater than the standard value of 0.5. Moreover, the results of Bartlett’s sphericity test all reached the significance level (p < 0.01), which indicated that there were shared factors among the variables and that factor analysis could be performed. 35
Project analysis
The main purpose of project analysis is to eliminate less effective items. The correlation coefficient between each item and the total amount should not be lower than 0.4, and the correlation must reach a significance level of p < 0.05. The correlation coefficient between the score of each item on the scale and the total score of the scale is shown in Table 1. We deleted the items that could not meet the above restrictions in the scale, specifically three items (1, 7, and 16) on the DSI and four items (1, 4, 14, and 19) on the DBQ.
The correlations between the total items and total scores (r).

p < 0.05; **p < 0.01.
Note: The boldface in table 1 refers to items that do not meet the constraint.
EFA
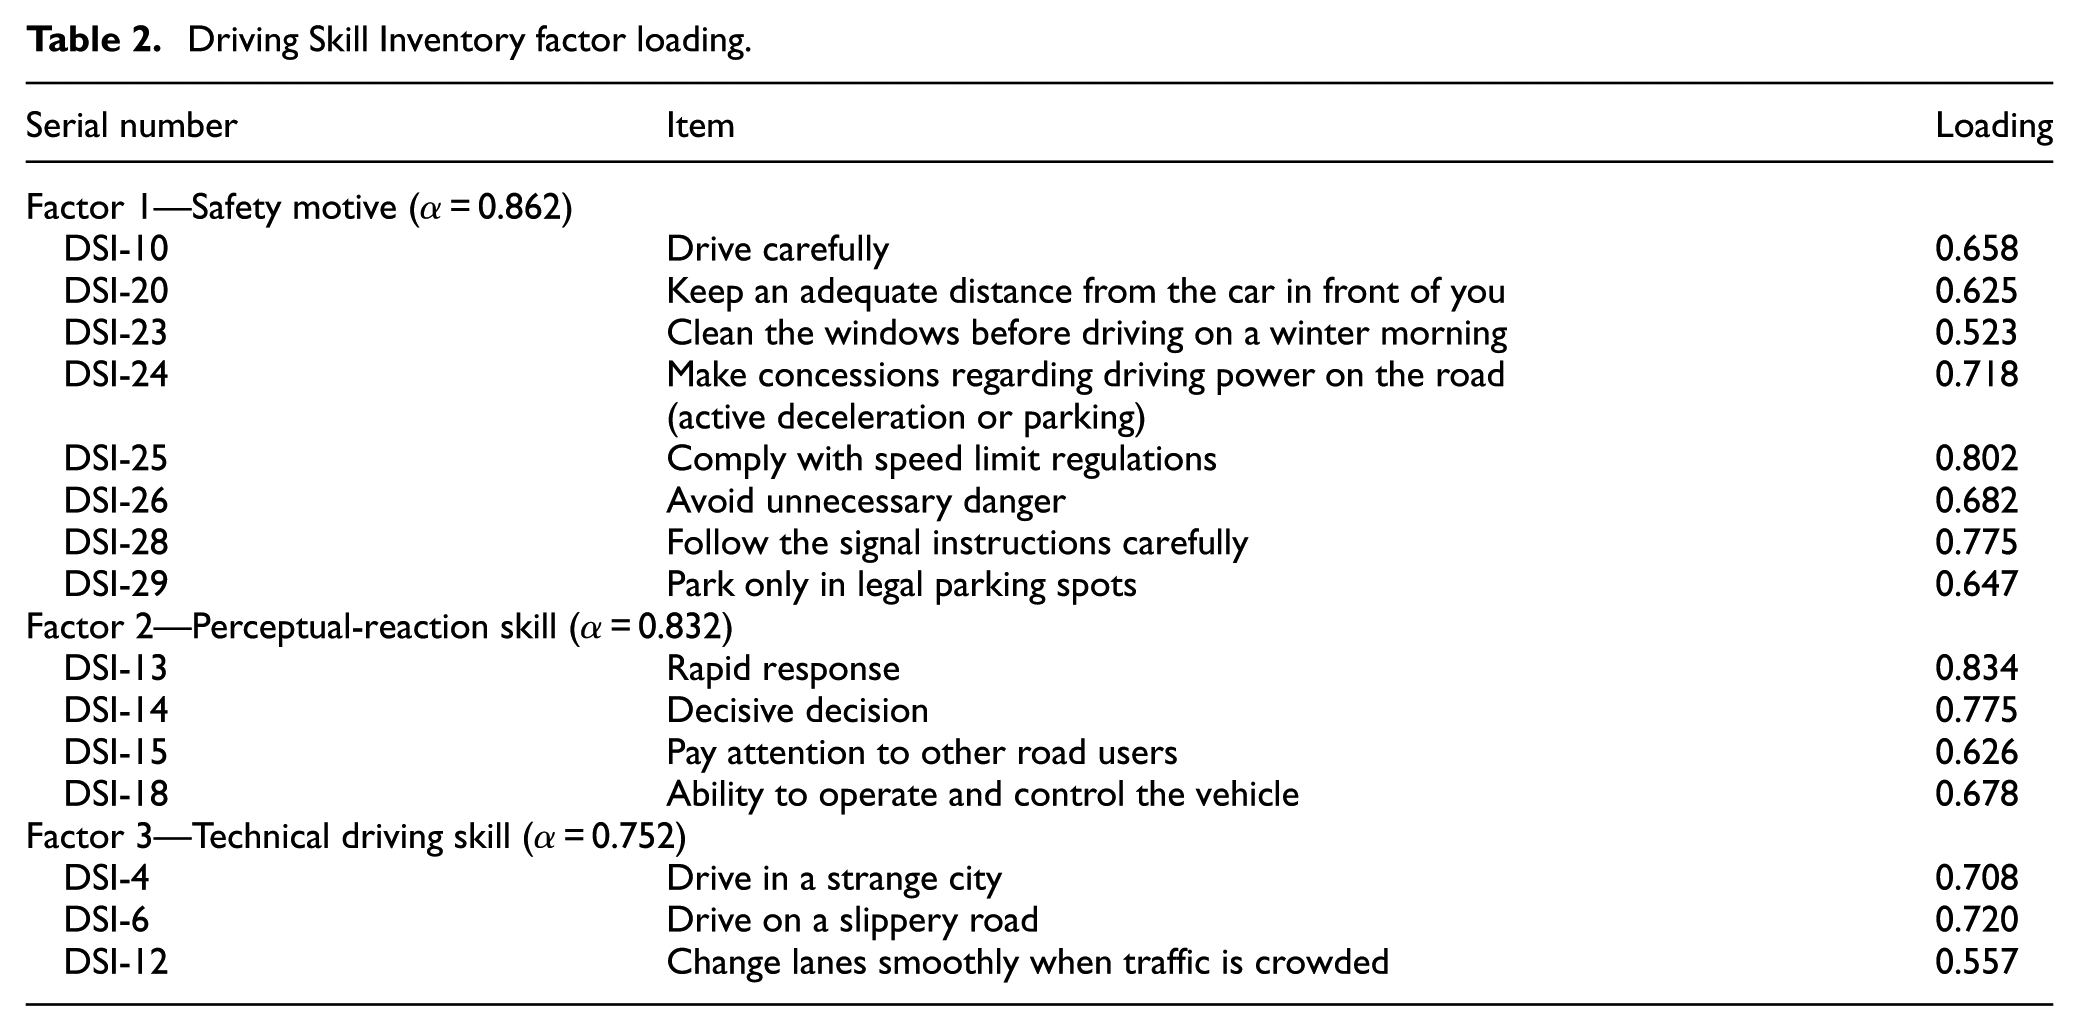
EFA was performed on the remaining 26 items on the DSI and the remaining 23 items on the DBQ. Principal component analysis was used to maximize the variance rotation. The items on the DSI were divided into the following three factors: “safety motive,”“perceptual-reaction skill,” and “technical driving skill.” The factor load of each item should be greater than 0.5, and items that cannot meet the constraint condition in the scale are deleted. The revised DSI scale contained 15 items, and a total of 56.3% of the total variance is explained. The specific results of the factor loading are shown in Table 2. The DBQ is also divided into the following three factors: “violations,” “errors,” and “lapses.” The revised DBQ scale contains 15 items, and a total of 54.2% of the total variance is explained. The specific results of the factor loadings are shown in Table 3. The factor structure is consistent with the theoretical concept, and the questionnaire structure has good validity.
Driving Skill Inventory factor loading.
Driving Behavior Questionnaire factor loading.

Reliability analysis of the revised scale was performed using Cronbach’s α coefficient to measure the reliability of the scale. When Cronbach’s α coefficient of the total scale is greater than 0.7, and the combination reliability of each factor is greater than 0.6, the conditions indicate that the scale is acceptable.36,37 Cronbach’s α coefficients of the revised DBQ and DSI scales in this study were 0.853 and 0.894, respectively, and the combined reliability of each factor was between 0.670 and 0.862, which indicates that the questionnaire has ideal reliability and can be used for correlation analysis and structural equation modeling.
Correlation analysis between demographic information and the DBQ/DSI
To explore the relationship among gender, age, driving experience, and the drivers’ rewards and punishments and the DBQ/DSI, the Pearson correlation coefficient method was used for the analysis. The specific results are shown in Table 4. Gender is significantly negatively correlated with technical driving skill, that is, female drivers’ driving skills are lower than those of male drivers, which can also explain the positive correlation between female drivers and errors. There is a significant correlation among age, driving experience, safety motive, and errors. Specifically, older bus drivers with high driving experience have higher safety awareness and fewer chances of committing errors. Whether reward is significantly and positively related to the safety motive and technical driving skill and whether punishment is significantly and positively related to violations are unknown. Our findings indicate that the rewarded driver has a higher safety awareness and better technical driving skills, while the punished driver is more likely to commit violations. Perceptual-reaction skill showed a weak correlation with demographic variables and reward and punishment experiences.
Correlation analysis results.

p < 0.05; **p < 0.01.
Structural equation model
To further analyze the relationship between the drivers’ driving skills and driving behavior factors and explore the impact of these various factors on the occurrence of accidents, a structural equation model was constructed. Using the factor structure discussed in the previous section, such as the latent variable, and using the number of accidents in 2016 and 2017 as the dependent variable, the initial structural equation model was established and included 6 latent variables and 32 observed variables.
The calculation was performed by AMOS21.0, and the paths for which the relationships among the variables are not significant, that is, the path with a p-value greater than 0.05, were deleted and corrected according to the correction coefficient. Since there are no significant correlations between technical driving skill and the other variables, latent variables related to the technical driving skill were deleted, and the standardized estimation result of the structural equation model was finally obtained as shown in Figure 1.

The structural equation model is modified.
The results show that the safety motive has a significant negative impact on driver violations, errors, and lapses (r = –0.60, p = 0.000; r = –0.45, p = 0.000; r = –0.35, p = 0.000); thus, the higher the safety motive, the less likely the bus driver is to have violations, errors, and lapses. In addition, the safety motive has the greatest impact on violations, the second-greatest impact on errors, and the least impact on lapses. Perceptual-reaction skill has a significant positive impact on violations (r = 0.39, p = 0.003), but no effect on errors and lapses was found.
Violations represent an important factor leading to bus traffic accidents and had a significant positive impact on the number of accidents in 2016 and 2017 (r = 0.25, p = 0.000; r = 0.19, p = 0.004). Errors and lapses have no significant impact on the occurrence of accidents. The drivers’ safety motive and perceptual-reaction skill had no direct impact on the number of accidents in 2016 and 2017 but indirectly led to bus traffic accidents by influencing driver violations.
To test the degree of fit, the structural equation model, the chi-square degree of freedom ratio, the absolute mean fitting index (standardized root mean square residual (SRMR)), the root mean square error of approximation (RMSEA), the normed fit index (NFI), the non-normed fit index (Tucker–Lewis index (TLI)), the comparative fit index (CFI), and other indices are used to test the degree of fit between the evaluation model and the original data. The evaluation criteria and test results of each fit index of the model are shown in Table 5. All the evaluation indexes satisfied the discriminant standard, which indicated that the modified structural equation model fits the observation data well.
Results of model fitting index test.

SRMR: standardized root mean square residual; RMSEA: root mean square error of approximation; NFI: normed fit index; TLI: Tucker–Lewis index; CFI: comparative fit index.
Discussion
This article aims to explore the impact of Chinese bus drivers’ driving skills on driving behavior performance and to research the impact of driving skills and driving behavior on public transport traffic accidents with the number of traffic accidents in 2016 and 2017 as the dependent variables. Bus travel is still one of the main modes of public transportation in China, and we hope to provide management measures for bus companies to reduce the number of bus accidents and improve public safety.
The assessment found that female bus drivers report having fewer skills than males, which is similar to findings observed in other driver groups. 38 Notably, females are less likely to brag about their skills; thus, females report fewer skills, which should be further explored in future studies. Female drivers are more likely to commit errors, which is consistent with the findings reported by Tao et al. 39 Age and driving experience are effective predictors of safety motive and wrong behavior as older drivers with more driving experience have a higher safety awareness and are less likely to display negative behaviors. Whether the company rewards the driver for good performance plays a positive role in driver’s safety motive, Tiznado et al. 11 also found that bus drivers are likely to associate bonuses with work performance; thus, the reward mechanism is an effective measure for promoting safe driving. Whether the driver is punished or not is significantly positively related to the violation, indicating that the driver’s punishment may be caused by illegal driving. The demographic variables (gender, age, and driving experience) are not significantly correlated with reward and punishment experiences and perceptual-reaction skills.
Previous research results divided the DSI into two dimensions, that is, perceptual-motor skills and safety skills, and found that perceptual-motor skills are significantly correlated with violations, errors, and lapses. 23 The correlations between the technical driving skill and the three types of driving behaviors are not significant in this article, which could be because the research objects selected in this article do not include novice drivers—all drivers were experienced drivers with good technical driving skills—and this is the most significant difference between our research and previous research. Consistent with the findings reported by Martinussen et al., 23 the drivers’ safety motive has a significant negative impact on the drivers’ violations, errors, and lapses; thus, the higher the drivers’ safety motive, the lower their probability of engaging in dangerous driving behavior. Taking effective measures for education and management to improve the safety motive of bus drivers is of great significance in reducing dangerous driving behaviors.
Perceptual-reaction skill has a significant positive predictive effect on violations. This finding may be explained by the rich driving experience of the drivers and their overconfidence in their ability to respond. Bus drivers believe that even if there are violations, such as speeding and passing on the right side, they can guarantee safety. Bus companies should correct these types of misconceptions of the driver to ensure that the drivers are clearly aware of the potential risks of the violations and thus reduce the occurrence of violations.
The violation is the only factor that has a significantly predictive effect on bus accidents. The more the violations, the more the accidents. Robertson and Baker 40 also verified the relationship between road violations and traffic accidents and found that drivers with fatal traffic accidents had significantly higher-than-normal average violation records over a 2-year period. Rajalin 41 also found that even in traffic accidents with nonresponsible parties, 20% of the drivers have more speeding violations in daily driving. The safety motive and perceptual-reaction skill had no direct impact on the number of accidents in 2016 and 2017, but positively affect drivers’ violations and indirectly affect the occurrence of traffic accidents.
Reducing illegal driving behavior is the core of reducing the involvement of bus drivers in traffic accidents. The results of this study are conducive to the initiatives of bus companies to educate drivers, specifically regarding the following points.
First, driver safety education should be conducted regularly, and driver misperceptions of regulations should be corrected in a timely manner to enhance drivers’ awareness of the risk of accidents and reduce the probability of violations. Regarding safety education, a combination of educational resources should be provided to all employees and key drivers, especially drivers with illegal driving behaviors. These drivers should register and compile records, focus on management, and keep education records of relevant training. In terms of the frequency of safety education, the safety order system should be maintained before the daily departure, and bus drivers should receive this information by the safety management personnel of the bus company. Drivers must adhere to the monthly safety education regular meeting system, thus requiring all members to participate. In terms of the content of safety education, it is advisable to use various means, such as broadcasting traffic accident videos and analyzing the causes of traffic accidents to improve the quality of safety education.
Second, it is important to establish a sound incentive mechanism, change the “negative incentives” based on punishments into “positive incentives” based on rewards, scientifically set assessment indicators, and provide regular (monthly) mental and material rewards to outstanding drivers, which can effectively improve drivers’ safety motive and reduce the occurrence of violations, thus decreasing the number of bus traffic accidents and improving traffic safety. For example, Hefei Bus Group is fully implementing the star service management system, selecting star drivers regularly and setting levels of 1 to 5 stars. The higher the star level, the higher the service level. The star drivers can obtain star badges according to their star levels and can also receive corresponding bonus incentives. The star management system is currently comprehensively promoted in Jinan, Shandong, Zhengzhou, Henan, and so on and may effectively reduce the occurrence of bus traffic accidents.
Third, adherence to the implementation of the bus driver’s “mentoring system” is important. Good bus driving regulations are essential to reducing the number of traffic violations. To become a new qualified bus driver, in addition to having a bus driver’s license, one should also recognize an excellent old driver as a teacher and enforce a more rigorous master’s inspection. Generally, to be employed, the driver needs to follow the master for a period of time to learn how to drive. Then, drivers must continue correct their driving behavior under the guidance of their mentor’s follow-up observation. After passing the master’s inspection of their driving skills, civilized driving, and so on, one can drive the bus alone to participate in the operation. This process does not generally less than 3 months in duration.
There are certain limitations in this study. The research data are based on self-reported questionnaires. The answers will be affected by social expectations or memory bias. The bus drivers are only from Hefei in the study sample, and in the future, we can continue to observe bus drivers in other cities for a comprehensive analysis.
Conclusion
This study explores the relationship between driving skills and driving behavior in a group of bus drivers and reveals the factors leading to bus traffic accidents. The results show that age and driving experience are significantly correlated with safety motive, and safety motive has a negative impact on violations. Therefore, bus companies should enhance safety education and establish a sound incentive mechanism based on rewards. In addition, the important findings of this study highlight the central influence of violations, which are important concerns in any attempt to reduce the rate of bus traffic accidents. Thus, when planning interventions and campaigns aiming to reduce the involvement of bus drivers in traffic accidents, efforts should be made to reduce the incidence of violations. Thus, interventions should not only be directly related to the involvement of bus drivers in traffic accidents but also consider the role played by violations. By assessing the relationship between driving skills and driving behaviors among Chinese bus drivers, we can provide helpful suggestions to bus companies regarding reducing the number of bus accidents and improving public transportation safety.
Footnotes
Handling Editor: Marianna Imprialou
Declaration of conflicting interests
The author(s) declared no potential conflicts of interest with respect to the research, authorship, and/or publication of this article.
Funding
The author(s) received no financial support for the research, authorship, and/or publication of this article.