
Abstract
In order to strengthen the safety of highway roadsides, it is necessary to take targeted measures according to the roadside hazards, so there is an urgent need to develop research on risk evaluation of highway roadside accidents. Based on accident simulation analysis and the form of accident after vehicles run to the roadside, the rollover risk of roadside accident is classed into four grades, namely, no departure from the ground, slight departure from the ground, one or two turnovers, and more than two turnovers. The factors involved in the causes of roadside accidents of different rollover risks are studied, and the thresholds of driving speed, sideslope gradient, and sideslope height are given. A Bayesian network for risk evaluation of roadside accidents is constructed. Based on the factor thresholds for the causes of roadside accidents, the calculation methods of the probability of different rollover risks of roadside accidents are carried out according to a single factor, two factors, and three factors. The typical cases of roadside accidents are analyzed and the calculation results of the Bayesian network show that the probability of one or two turnover accidents is 0.939, which is consistent with the results of roadside accident simulation tests, proving the accuracy of the risk evaluation methods for highway roadside accidents.
Keywords
Introduction
By the end of 2016, China’s total highway mileage reached 4,696,300 km, and roadside accidents accounted for about half of accidents, in which more than three people died. Statistics for Beijing and Guizhou area showed that roadside accidents accounted for about a quarter of all accidents, leading to a 40% mortality rate and severe injury rate of more than 50%. Identifying the sources of roadside hazards and evaluating the risk of roadside accidents have become problems to be resolved.
Zegeer et al.
1
reported that a 27% reduction in run-off-road (ROR) crashes could be achieved by flattening a sideslope from
Objectively speaking, there is no essential difference between the division into three levels, four levels, or five levels and the division into seven levels in the United States and all divided according to the main factors affecting the level of roadside risk, which is determined by a qualitative formulation. Although they have played a certain role in engineering practice, there are still some problems, such as the blurring of the boundary between the levels and the lack of foundation of the fundamental theory. At present, quantitative measurement of roadside risk is still not mature, due to incomplete roadside accident data. The high risk of roadside accidents means that real vehicle tests are not feasible. This article uses accident simulation software to study the influence of speed and roadside environment on the rollover risk of the accident after the car leaves the lane for the roadside, determines the thresholds of roadside accident factors causing roadside accidents of different grades based on the form of roadside accident, and constructs a Bayesian network which can accurately calculate roadside accident probability, in order to realize a quantitative evaluation of the roadside accident risk.
Simulation test and influence factor analysis of roadside accident
Factors influencing roadside safety
Driving speed is the main factor leading to roadside accidents. When a vehicle makes a turn, a high speed will result in an excessively large lateral force, so the vehicle will drive to the roadside. The related research21,22 results also showed that driving speed is not only one of the main causes of traffic accidents but also the most effective parameter for predicting highway traffic accidents. In addition, some scholars carried out some researches. Roque and Jalayer 23 propose that single-vehicle crashes in rural areas have higher likelihood of fatality than crashes in urban areas owing to the higher speed limits. Xie et al. 24 suggested that roadside accidents on interstate highways are more likely to be fatal, which can be caused by the higher average speed.
Slope is also an important factor affecting roadside accident severity. The forms of slope comprise embankments, cuttings, and semi-filled and semi-excavated embankments. Compared to cuttings, embankments (related to steep sideslopes) are more likely to lead to turnover and other severe roadside accidents. Some studies also confirmed this point, Jalayer and Zhou 12 obtained that the segments with steep sideslopes might experience more roadside crashes by reliability analysis. Lord et al. 25 proved that sideslopes have a significant impact on the frequency and severity of roadside accidents. Wang et al. 26 made a statistical analysis that 54.54% of accidents occurred on a 4%–5% steep sideslope, which is about 10 times that of 3%–4% sideslopes and 20 times that of the less than 3% sideslopes. Therefore, this article mainly studies slopes in the form of embankments. Related studies 3 have categorized slopes into four types: slope >1:2 (dangerous slope), 1:2 >slope >1:3 (non-returning slope), 1:3 >slope >1:6 (returning slope), and slope <1:6 (safe slope). Slope heights are categorized into three kinds: height <4 m (low slope), 4 m <height <10 m (medium slope), and height >10 m (high slope). In general, when the slope height is fixed, the steeper the slope, the greater the turning speed of the vehicle and the more severe the roadside accident. When the slope is fixed, the higher the slope, the more likely it is to cause serious consequences in the case of a road accident.
In addition, factors affecting roadside safety include roadside obstructions that the vehicle may hit when falling down the slope. Considering the randomness of the distribution of obstacles, this article does not consider them for the time being. In addition, roadside guardrails are also seen as obstacles, and the object of this study has no roadside guardrail. Therefore, this article selects three indexes, namely driving speed, sideslope, and slope height, for the roadside accident simulation test.
Simulation test of roadside accident
PC-Crash software is widely used in traffic accident simulation and reconstruction analysis, as it has many advantages, such as abundant vehicle databases and the ability to simulate vehicle dynamics and kinematics accurately. Based on the provisions of representative vehicle types adopted in highway operating speed prediction as stipulated in “Specifications for Highway Safety Audit” (No. JTG B05-2015), the wheelbase of small vehicles is ⩽3.5 m and that of oversized vehicles is >3.5 m. From the PC-Crash vehicle database, BMW320 is selected to represent small vehicles, and the Auwaerter Eurostar Scania-1 is used to represent oversized vehicles.
In addition, the pavement adhesion coefficient, transverse crown slope, lane width, horizontal curve radius, longitudinal road slope, slope gradient, slope height, and other parameters can be determined in combination with the mechanism of occurrence of different roadside accidents based on the Technical Standard of Highway Engineering (No. JTG B01-2014) and other relevant specifications.
After the parameters of the simulation test have been determined, the values of driving speed, sideslope, and slope height are determined for the simulation test of the roadside accident in order to obtain test results on whether the vehicle will roll over after driving to the roadside, the rollover angle, and whether there will be a crash, thereby determining the indicator thresholds of different forms of roadside accidents. Based on the research results of survey data and slope on highway operation speed in the existing research, the driving speeds set in the test are 40, 60, 80, 100, and 120 km/h; the slope heights are 1.5, 3.5, 5.5, 6, 7.5, 9.5, and 11.5 m; and the slope gradients take 38 different values between 1:0.1 and 1:7.7. The number of rollovers and speed changes of the vehicle are recorded as a result of the simulation test. The experiment consists of 225 groups, the simulation scene is shown in Figure 1, and the results of the simulations are shown in Tables 1–3, respectively.

Simulation test of roadside accident.
Statistics of number of turnovers under different slope conditions.

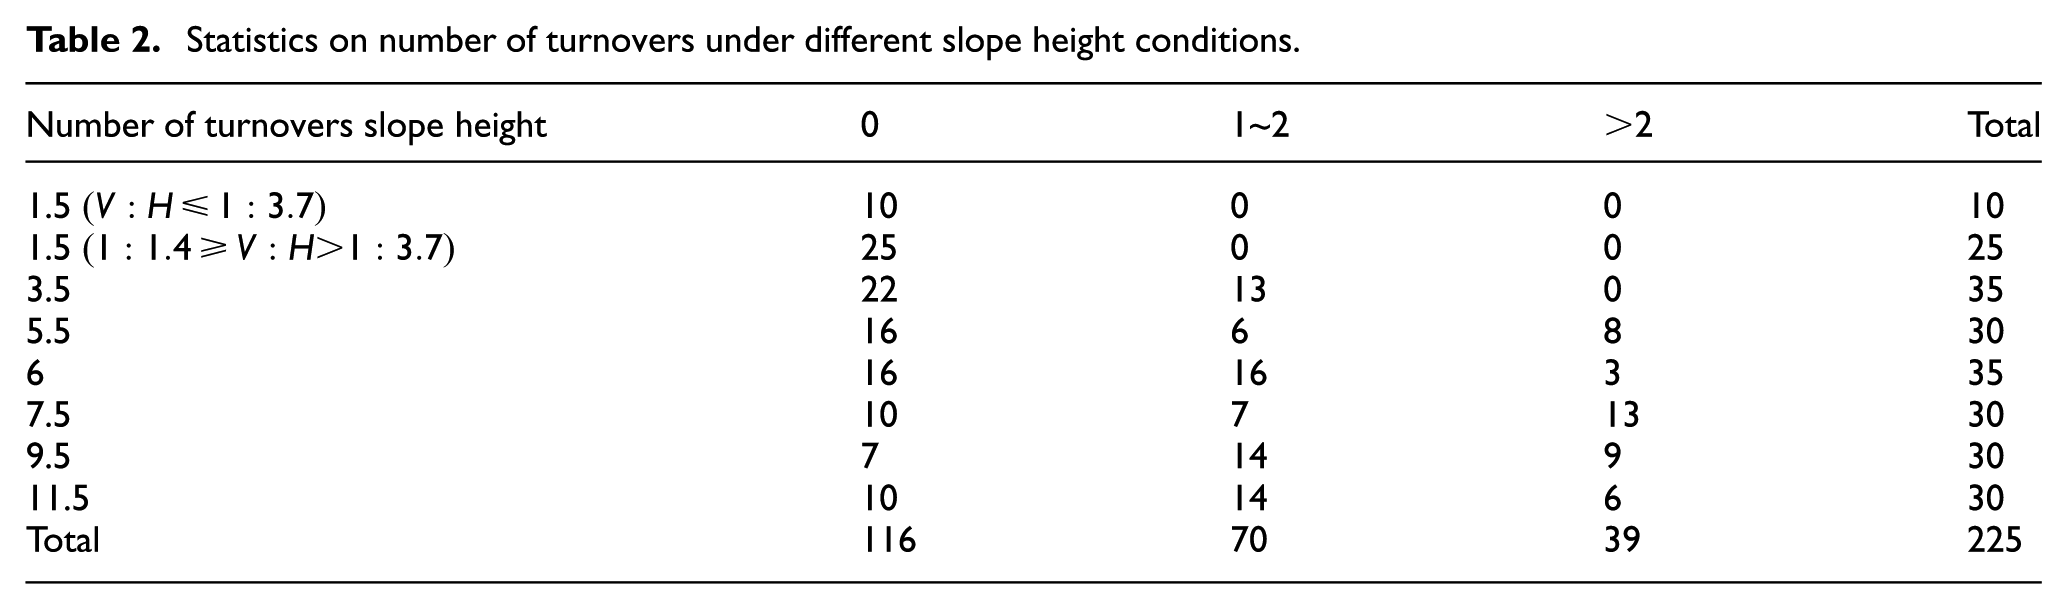
Statistics on number of turnovers under different slope height conditions.
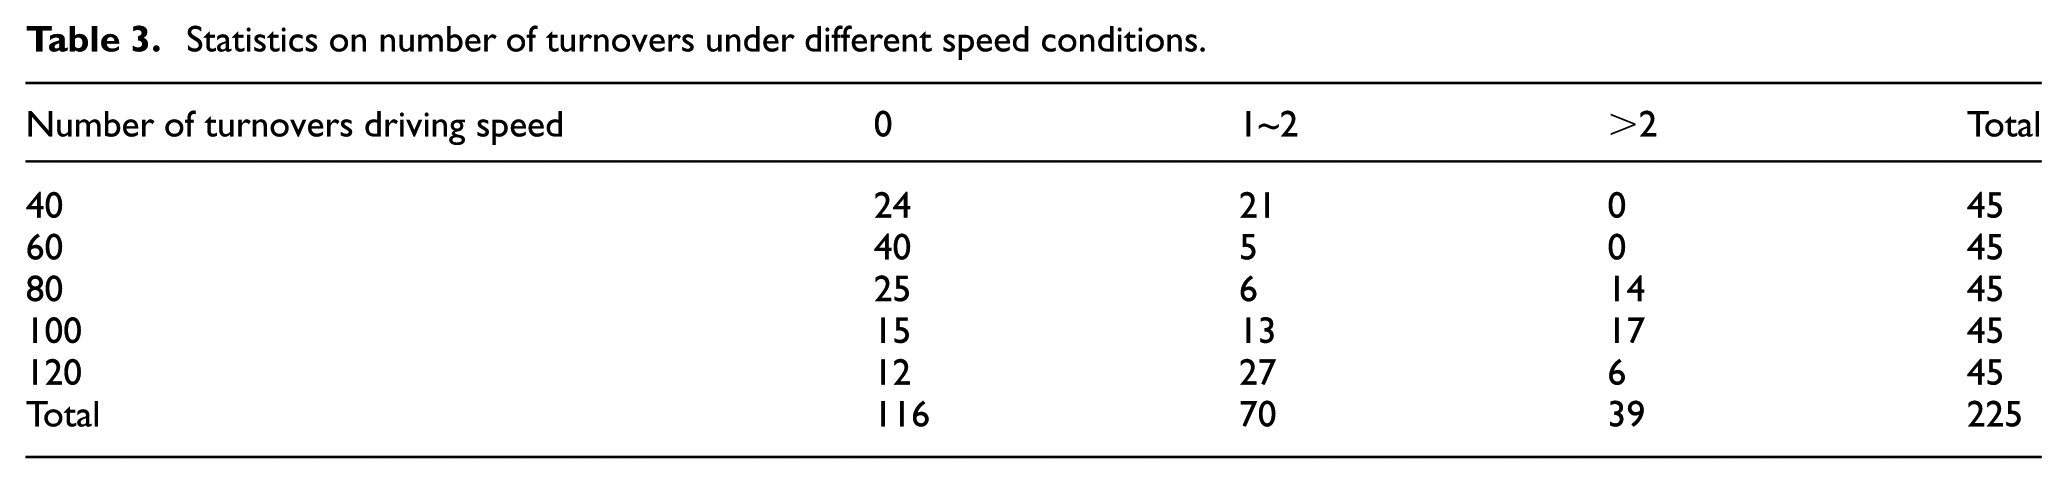
Statistics on number of turnovers under different speed conditions.
Single-factor analysis of roadside accident
On the basis of the test results provided by the PC-Crash software, the following circumstances may occur after the vehicle drives to the roadside:
The slope is gentle, and the roadside is shallow. The vehicle does not leave the ground after driving to the roadside, there are no casualties, and the vehicle can drive back to the highway and continue to drive as normal.
The slope is moderate and the roadside is moderate. The vehicle does not leave the ground after driving to the roadside and there are minor injuries. The vehicle is likely to return to normal driving.
The slope is steep and the roadside is deep. The vehicle has at most two rollovers (one rollover is defined as a 90° lateral turn of the vehicle) and there are serious injuries. The vehicle cannot resume normal driving.
The slope is very steep, and the roadside is very deep. The vehicle has at least two turnovers and death occurs. The vehicle is badly damaged.
Using SPSS statistical analysis software, correlation analysis was carried out on the test data of rollover times, slope gradient, speed change, slope height, and driving speed, and the results are listed in Table 4. In the Table 4, ** indicates a significant correlation at the 0.01 level (bilateral). Now the number of rollovers is defined as the rollover risk of the accident, it means that the more times the rollover, the greater the rollover risk is. The results show that the driving speed, the slope, and the height of the slope have a significant impact on the number of rollovers and the change in speed and it means that there is a positive correlation between the single factors and the indicators of the rollover risk of the accident. The steeper and higher the slope and the faster the driving speed, the more likely it is that the vehicle will roll over.
Correlation analysis of indicators of roadside accidents.

indicates a significant correlation at the 0.01 level (bilateral).
Relationship between sideslope and roadside accident risk
The number of rollovers on different slopes is shown in Table 1. The analysis of the simulation test results shows that as the slope gradient gradually steepens, the number of turnovers experienced by the vehicle gradually increases, meaning an increase in rollover risk. When the slope gradient
Relationship between slope height and roadside accident risk
Statistics on the number of turnovers under different slope heights are shown in Table 2. The analysis of the simulation test results shows that the probability of vehicle turnover accidents increases with increasing height of the slope. In addition, at a fixed slope height, the roadside accident rollover of risk increases with increasing slope gradient and increasing driving speed.
When the slope height is
Relationship between driving speed and roadside accident risk
Statistics on the number of turnovers under different driving speed conditions are shown in Table 3. The analysis of the simulation test results shows that as a whole, the probability of vehicle turnover increases with increases in driving speed. The threshold of driving speed for vehicle departure from the ground is
Thresholds of factors causing roadside accidents
The four degrees of rollover risk of no departure from the ground, slight departure from the ground, at most two turnovers (where a rollover is defined as a lateral turn of the vehicle by 90°), and more than two turnovers of the vehicle after driving to the roadside are defined as roadside accidents at Levels I, II, III, and IV. According to the test results, the corresponding thresholds of slope gradient, slope height, and driving speed of roadside accidents at Levels I, II, III, and IV can be obtained, as listed in Table 5. One point needs to be noted that when either slope height is
Thresholds of indicators in roadside accidents.

Prediction of roadside accident risk
Using the regression analysis method, it is very difficult to deal with the complex nonlinear relationship between the roadside accident risk and the roadside environment index, but a Bayesian network has the function of backward inference. Under the premise that a roadside accident of a certain risk occurs, the trained Bayesian network can be used to carry out reverse calculation to analyze the possibilities of objective factors leading to roadside accidents. Therefore, this article uses a Bayesian network to carry out research on the risk evaluation of roadside accidents.
Application and construction of Bayesian network
Bayesian networks originated from Bayesian statistical analysis theory, which was proposed by Judea Pearl in 1986. It is a method of describing uncertain knowledge and reasoning problems. With the advancement in statistical modeling techniques and computing capabilities, Bayesian approach has been the common and rigorous approach for traffic safety research. Park et al. 27 used empirical and full Bayes methods to estimate the safety effects of roadside barriers with different crash conditions. Alarifi et al. 28 accurately predicted the number of collisions at intersections and segments along corridors by a Bayesian multivariate hierarchical spatial joint model. Schneider IV et al. 29 applied a negative binomial model based on full Bayes’ methods and demonstrated that both horizontal curvature and passenger vehicle volumes significantly contribute to increase truck crashes. Flask and Schneider IV 30 also established a full Bayesian negative binomial model with mixed effects which can account for some of the uncertainty inherent in the accident data.
The construction of a Bayesian network includes the determination of the network structure and the evaluation of conditional probabilities. The topological structure of the Bayesian network built in this article is shown in Figure 2.

Topological structure of the Bayesian network.
Training of Bayesian network
The slope gradient, slope height, and driving speed are set as
According to the Bias theorem

The
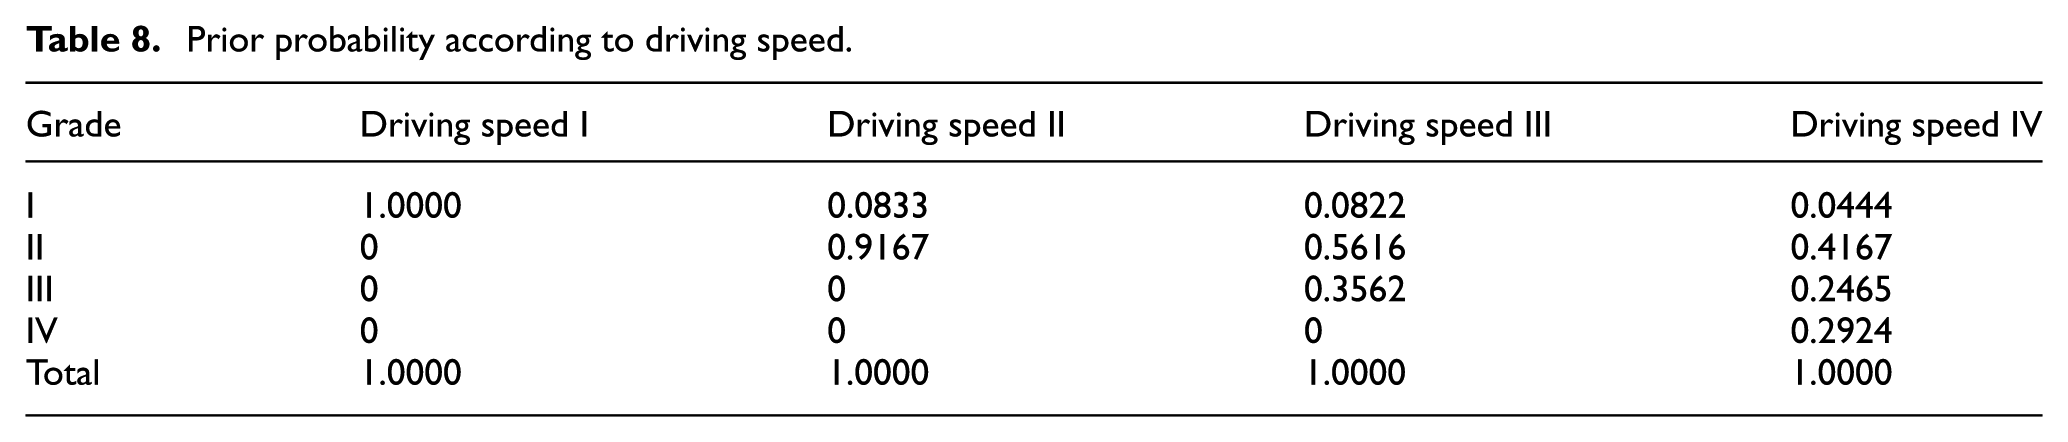
According to the accident simulation test results, the prior probabilities of the roadside accidents at different rollover risks according to the three indicator thresholds corresponding to Table 5 are obtained, as shown in Tables 6–8. In terms of the slope gradient, I means that
Prior probability according to sideslope gradient.

Prior probability according to sideslope height.

Prior probability according to driving speed.
From Table 6, the probability of a Level I roadside accident is 100% at slope gradient I
According to formula (1) and Table 6, the probability of the slope gradient falling into each of the above four levels can be calculated in the case of Level I roadside accidents


In the same way, the probability of having a Grade II, III, or IV roadside accident at a slope gradient falling into each of the above four levels can be calculated, and the calculation results are listed in Table 9.
Conditional probability according to sideslope grade.

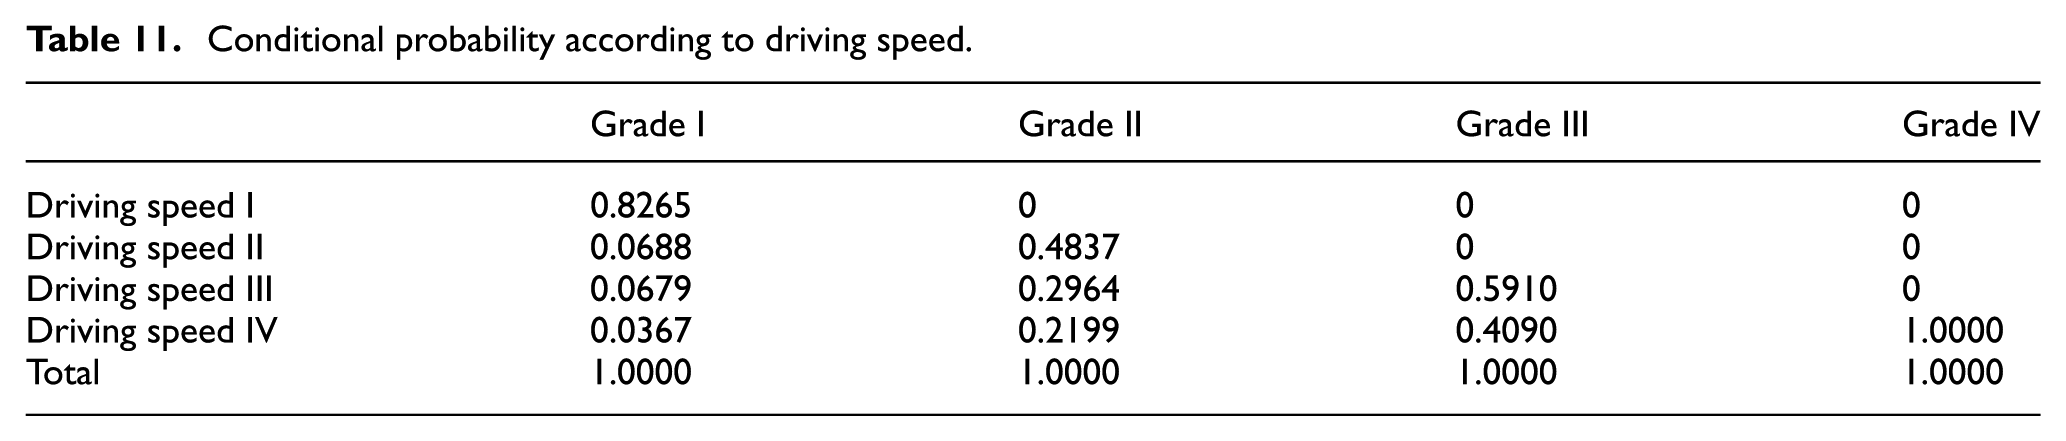
The calculation of the conditional probability according to driving speed and slope height is the same as that for the slope gradient, and the results are listed in Tables 10 and 11, respectively.
Conditional probability according to sideslope height.

Conditional probability according to driving speed.
The results of conditional probability according to the three indicators in Tables 9–11 are put into the topological structure of the Bayesian network; that is, the modeling of Bayesian network can be completed. By setting of the range of each indicator, calculation of the probability of roadside accidents of different rollover risks can be carried out.
Inference and prediction by Bayesian network
According to the Bayesian network in this article and conditional probability theory, different values of different indicators are set to predict the probability of roadside accidents of different rollover risks.
Single-factor inference
In the case of a known state of any of the indicators slope gradient

For example, when the slope gradient is 1:3, which is within the range of Level III, and the other indexes are unknown, the process of calculation of the probability of roadside accidents of different rollover risks is as follows


Similarly, the probability of roadside accidents of different rollover risks occurring when the value of the slope gradient falls into the range of Grade I, II, or IV and the values of other indicators are unknown can be calculated. In the case in which the values of slope height and driving speed are of a certain grade and the values of the other two indicators are unknown, the calculation of the probability of roadside accidents of different rollover risks is the same as that of the slope gradient.
Double-factor inference
When a node H (with m states) has more than one argument

In the case of known states of any two indicators among the slope gradient

For example, when the slope gradient is 1:3, the slope height is 3 m, meaning that the slope gradient and slope height fall into the range of Level III, and the value of the driving speed is unknown, the process of calculation of the probability of occurrence of roadside accidents of different rollover risks is as follows
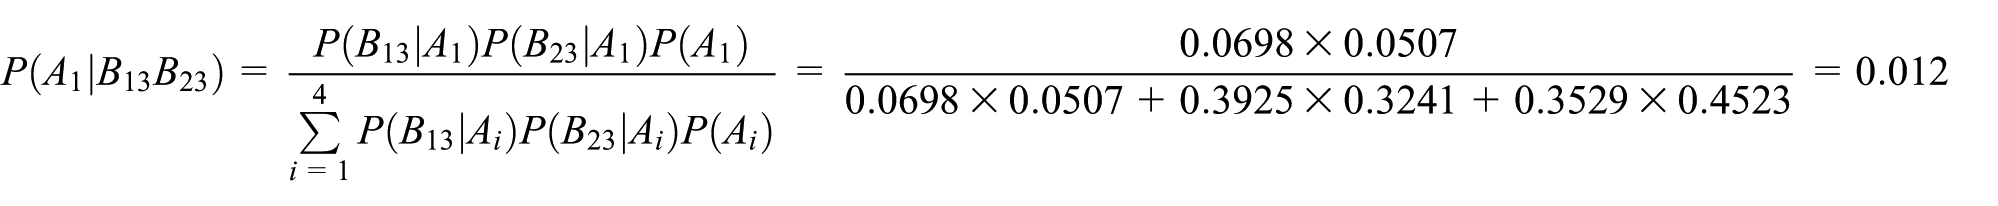

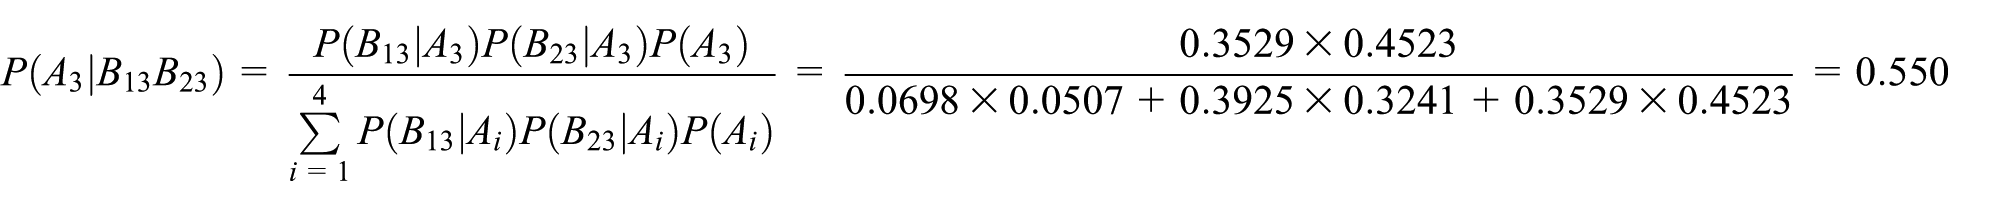

Similarly, the probability of roadside accidents of different rollover risks occurring when the values of slope gradient and slope height fall into the range of Grade I, II, or IV and the value of driving speed is unknown can be calculated. In the case in which the values of the slope height and the driving speed are of a certain grade and the value of slope height is unknown, the calculation of the probability of occurrence of roadside accidents of different rollover risks is as above.
Three-factor inference
In the case of known states of the slope gradient

For example, in the case of a slope gradient of 1:3, a slope height of 3 m, and a driving speed of 60 km/h, the values of slope gradient, slope height, and driving speed fall into the range of Level III, and the calculation process is as follows


Similarly, the probability of roadside accidents of different rollover risks occurring when the values of slope gradient, slope height, and driving speed fall into the ranges of Level I, II, and IV can be calculated.
Case analysis
Accident cases
In June 2013, at Line K13+620 of the County Highway X125 from Suo Er Ba Si Tao Scenic Area to Changji via Miaoergou Township in Xinjiang, a bus carrying 36 passengers (allowed load of 37 passengers) turned over on the left embankment, leading to 15 deaths and 21 injuries, causing direct economic losses of 8,780,000 Yuan.
Accident investigation
The inspection period of the vehicle was valid until 2016, the grade of technical evaluation was first grade, and the permitted types of driver were A1 and A2. The accident section was Grade 4 mountainous highway with asphalt pavement presenting an “S” curve. The turning radius was 20.35 m, and the longitudinal gradient was 9.2%. The shoulder was soft without any protective measures and a good line of sight. When the accident occurred, the pavement was slippery, and the speed of the bus was 42 km/h.
Cause of the accident
The direct reason was that the driver was speeding on the turning section of the steep slope in the mountainous area, an improper operation, which led to the turnover. The indirect reason was that the section does not have effective safety measures.
Risk evaluation of roadside accident
The driving speed was 42 km/h, which belongs to Level III, and the slope gradient and slope height were both in the range of Grade IV. These values were put into the Bayesian network to calculate the probability of roadside accident risks, and the probability of occurrence of roadside accidents of different grades could be obtained. The probability of the bus turning over up to twice was 0.939, while the probability of the bus coming off the ground slightly was only 0.061. It can be considered that the bus was likely to turn over when driving to the roadside, but at most twice. PC-Crash software was used to simulate the accident. The parameters were set as follows: radius of horizontal curve
Conclusion
Based on the accident simulation and analysis, this article studies that the driving speed, the slope, and the height of the slope have a significant impact on the number of rollovers by the regression analysis method; categorizes the rollover risk of roadside accidents; gives the thresholds of factors causing the accidents of different rollover risks by PC-Crash simulation software; then puts forward a method of evaluating the risk of highway roadside accident based on a Bayesian network; and confirms its effectiveness by a typical cases of roadside accidents. This proposed method can accurately calculate the probability of roadside accident and achieve a quantitative evaluation of the roadside accident risk. In the study on threshold categorization of factors causing roadside accidents, this study assumes that there are no roadside obstacles, and only selects the driving speed, slope gradient, and slope height to construct a Bayesian network that calculates the probability of occurrence of a roadside accident of a certain risk. Actually, there are many roadside obstacles not considered (e.g. roadside guardrails, traffic signs, utility poles, trees, walls, ditches, buildings, and culverts) also affecting roadside accident risks. Hence, the factor of roadside obstacles will be incorporated in further studies.
Footnotes
Handling Editor: Hai Xiang Lin
Declaration of conflicting interests
The author(s) declared no potential conflicts of interest with respect to the research, authorship, and/or publication of this article.
Funding
The author(s) disclosed receipt of the following financial support for the research, authorship, and/or publication of this article: This research was sponsored by the National Natural Science Foundation of China (grant no.: 51778063) and the MOE Layout Foundation of Humanities and Social Sciences (grant no.: 18YJAZH009).