
Abstract
The real weight on bit is difficult to observe or estimate in highly deviated wells and extended-reach wells since complex loads are acted on drill string. Near-bit measurement while drilling tools, which are generally used to address this issue, can only measure axial forces based on axial strains instead of the real WOB. Axial forces on near-bit drill string are mainly controlled by buoyancy force of drilling fluid, circulating pressure, and other factors. To some extent, the measured data can be corrected by force analysis. It should be noted that experiments must be conducted to study the influences of differential pressure and temperature on measured WOB data of near-bit measuring tool. This article presents calculating method of real WOB via correction of measured data, based on force analysis of a self-developed near-bit measuring tool and experiments on influences of differential pressure and downhole temperature. Field test indicates that higher deviation angle will lead to a greater difference between real WOB and the indicated value at wellhead. Multi-well testing data verification indicates that this method is effective and reliable in extracting real WOB, and helpful to accurately identify the running state of bottom-hole assembly.
Introduction
As the number of complex structural wells, such as highly deviated wells and extended-reach wells, are increasing in recent years, more challenges and risks are faced in drilling operation. Friction and torque are difficult to control, which leads to serious backing pressure due to complicated downhole environments and working states of drilling tools. To realize safe drilling, parameters such as WOB (weight on bit), torque, and annulus pressure must be understood well during drilling operation. For this purpose, various tools have been developed for measuring downhole drilling parameters.1–6 By subtracting buoyancy from measured data, the value can meet the accuracy requirement of WOB on the well site. 3 H Zhang and colleagues4–6 conducted measuring error analysis, sensor characteristic analysis, and surface calibrating system calibration. T Ma and colleagues7,8 proposed an integrated dynamic monitoring method, including a downhole parameters measuring system and a model for calculating the effective weight of drill string. But accurate correction study of real WOB is still needed. The main purpose of this article is to illustrate the methodology of correcting WOB data. Accurate knowledge of downhole parameters is of great significance to the prediction of working states of downhole drilling tools. The axial forces of downhole near-bit drill string mainly include gravity, hydrostatic pressure, friction force, jet flow reacting force, and WOB,9–12 measured axial forces must be corrected to get the real WOB. Then a near-bit drilling multi-parameter measuring tool, which can measure axial forces (WOB), torque, temperature and internal pressure of the tool, annulus pressure, and tri-axial vibration, was developed. Based on theoretical study and practical experience, the study team considered that temperature, hydrostatic pressure, and vibration parameter data are directly measured by sensors and only relevant to quality and accuracy of sensor itself. Whereas, WOB and torque data are obtained indirectly by means of strain principle and thus are supposed to be processed and corrected. Field tests revealed that WOB is the only parameter differs a lot from the real situation. The reason is that the measured axial force is a resultant force superposed by all axial component forces on drilling string and axial forces arising from other factors below gauging point section, and WOB is just one component of the resultant force. Therefore, a study was carried out so that the measured axial force can be corrected to the real WOB.
Force analysis on measuring tools
The measurement of axial force is to measure strain of the measuring sub with resistance strain gauge which is pasting in drill collar (measuring sub) strain chamber, then acquire electric signals outputted through conversion circuit. Theoretically, the full-bridge working mode applied can eliminate the influence of bending moment and temperature on measurement, but bridge connection cannot offset the impact of drilling fluid column pressure on WOB.4–6 While developing a near-bit multi-parameter measuring sub, an analysis on recorded data of a downhole test using prototype indicates hydrostatic pressure influences axial force and strain measurement greatly. In addition, the action of environment temperature will result in micro-strain generated in the bottom drill string, which also affects the measurement of axial force, and should be eliminated by loading test curves. The effective axial force produced by drilling tools below measuring point can be theoretically analyzed and derived.
According to the study of drilling string axial force calculation by Z Han,10–14 Y Chen and Z Yan, 15 and others, Figure 1 shows force analysis on the measuring sub under the inclined borehole conditions. Forces on shoulder of drill string assembly lead to different buoyant weight per unit length of each section of drill string. Measuring tool can be simplified as a single diameter of drill string in force analysis in order to simplify the calculation. The axial force of drill string can be expressed as

where Fa is axial force of drill string, kN; Fw is axial component of drill string gravity, kN; Fof is flow friction force, kN; Ff is borehole friction force, kN; Fj is reacting force of jet flow, kN; and Fb is WOB, kN.

Bottom drill string force diagram in deviated borehole: (a) Drill string in a deviated borehole and (b) force analysis on bottom drill string.
Once the tool measures the axial force of bottom drill string, WOB can be calculated using equation (1).
1. Axial component of gravity

Buoyancy coefficient under drilling condition is expressed as

where ΔL is length of drill string, m; A is cross-sectional area of drill string, cm2; γs is specific weight of drill string material, kN/m3; kf is buoyancy coefficient of drill string; α is deviation angle, °; Ao is outer sectional area of drill string, cm2; Ai is inner sectional area of drill string, cm2; γo is specific weight of drilling fluid outside drill string, kN/m3; γi is specific weight of drilling fluid inside drill string, kN/m3; Go is external flowing pressure gradient of drill string, MPa/m; and Gi is internal flowing pressure gradient of drill string, MPa/m.
2. Flow friction force

where Foi is internal flow friction force, kN; Foo is external flow friction force, kN; ΔPi is internal pressure drop of drill string, MPa; ΔPo is external pressure drop of drill string, MPa; DH is borehole diameter, mm; and Do is outer diameter (OD) of drill string, mm.
3. Borehole friction force

where μ is friction coefficient. In the calculation, the friction coefficient between drill string and casing is 0.25 and the friction coefficient between drill string and open hole is 0.30.
4. Reacting force of jet flow 16

where ρ is drilling fluid density, g/cm3; Q is displacement, L/s; Ap is total cross-sectional area of nozzle, cm2.
Axial force calibration and correction experiment
Calibration test under axial loading conditions
The near-bit measuring tool we developed is composed of measuring body and extended body. The latter is complemented to accommodate and protect the exploring tube. All functions of measuring downhole data are realized on the measuring body, with length of 0.9 m and OD of 177.8 mm. No suitable drawing testbed is available because of the long body of the tool, so a manual-operated calibration device was manufactured specifically for this experiment, as shown in Figure 2.

Manual-operated calibration device.
An experiment was performed on hydraulic jack to obtain output characteristics of manual-operated calibration device by using the drawing testbed (Figure 3 shows the experimental facility). The value of applied axial load (equal to WOB) was set by computer-controlled system. Then, the corresponding readings on pressure gauge were recorded. The axial force is linearly load to 165 kN, and the maximum reading on pressure gauge is 39.3 MPa. The relation curve was obtained based on applied axial load and corresponding readings of pressure gauge. It shows a good linear relationship between hydraulic pressure and the output axial force.

Hydraulic jack output characteristics experiment.
Axial force was calibrated with manual-operated calibration device. Calibration experiment was repeated 5 times, and the average value was used for curve fitting and the linearity is 0.9997, as shown in Figure 4. Experiment shows axial force has no effect on torque, temperature, vibration, and fluid pressure.

Recording curve and fitted curve of the experiment.
Experiment of torque calibration verified that torque measurement also had no effect on axial force. This experiment was performed on torsion testbed at National Engineering Laboratory of Oil and Gas Drilling Technology, with the maximum torsional moment of 200 kN.m, relative accuracy of indicating value ≤± 1%. Figure 5 illustrates calibration device and test curve. To highlight the effect from torque on axial force, output curves of axial force and torque were demonstrated here only.

Torque calibration device and measured data: (a) Torque calibration device and (b) recording curve and fitted curve.
Effect of internal and external differential pressure
Since strain gauges, used to measure the axial force, are pasting on the sidewall of strain chambers, only internal and external differential pressure will act on it. In order to simplify the operation, internal pressure was loaded on the tool only, with zero external pressure. With the external load of zero axial force, internal pressure is increased incrementally, then we observed the effect of internal pressure of drill string on measured WOB data. The pressure ranged from zero to 40 MPa, and was maintained for 2 min after responsive static pressure was exerted with a gradient of 10 MPa. Figure 6 shows internal-pressure-exerting experiment. Recording curve and data fitting curve are shown in Figure 7.

The view is of internal-pressure-exerting experiment.

Recording curve and data fitting curve.
Figure 7 illustrates that under a constant external pressure, the altered internal pressure (that is differential pressure in this case) will result in a significant change of axial force accordingly, with no effect on torque. Fitting of differential pressure and axial force was conducted based on the relationship between calibrated axial force and voltage. The result shows a good linear correlation between differential pressure and axial force.
Effect of temperature
Generally, downhole environment temperature is higher than surface temperature. In theory, Wheatstone bridge circuit is composed of four identical strain gauges with the function of temperature compensation. However, strain will be generated in body of drill string attached by strain gauges by thermal expansion or contraction, which will then affect the measuring results of axial force. With the function of measuring temperature, the tool can be heated with a fixed gradient and kept at the same temperature for a given time. By fitting recorded temperatures and axial forces, we can get relation curve of temperature and axial force. The fitted curve is shown in Figure 8.

Temperature loading experimental curve data and fitted curve.
The experimental data show when temperature exceeds 48.3°C, environmental temperature leads to generation of micro-strain in drill string, and then affects the output of axial force value. The output result of the measuring tool presents a good linear correlation with environmental temperature.
WOB measurement and data correction
Data processing method
Calculation model processing
In practice, the structure of bottom-hole drill string will not maintain consistent inner and outer diameters. When we process each structural unit, we simplify the structure as follows.
Drill collars, including nonmagnetic and spiral drill collars, are simplified as a cylinder with the same inner and outer diameter. The section of the drill collars are ring, and partial structures are ignored, such as holes and grooves.
Transition joints, floating valves, and MWD are treated the same way as drill collar.
OD of centralizer is defined as an average of working OD and real OD, and is treated the same way as drill collar.
The weight of 5LZ172 positive displacement motor (PDM), mentioned in this article, is 1300 kg.
The steel density of all drilling assembly units is 7.85°g/cm3.
The influence of pressure gradient has not been taken into account in the buoyancy coefficients of the PDM and bit.
Only gravity, among axial forces generated by bit, has been taken into account.
For the near-bit measuring tool in this study, the distance between its measuring point and the lower pin end face is 0.26 m.
The calculated drilling fluid specific weights of inner and outer drill string have no difference in this article.
Since measuring point of axial force is near to bit, partially curved borehole is deemed as deviated section. When higher accuracy is required, the method in literature 9 can be applied.
The impact of deviation can be ignored when deviated angle is less than 3° in the vertical section, which can be deemed as vertical hole.
Correction steps for measured data
The key to correcting the measured data is to calculate the effective axial force at the cross section of the measured point generated by drilling tools and fluid pressure below the measured point, and then the measured data will be corrected to get the real WOB.
Divide drill string below measuring point into several units based on weight per unit length or natural structure, and calculate related parameters of each unit.
Calculate pressure drops of inner and outer drill string of natural structural units based on circulating flow rate, and then calculate pressure drop of bit.
Calculate buoyancy coefficient of each unit.
Calculate floating weight and borehole friction of each unit.
Calculate internal and external flow friction of each unit.
Calculate reacting force of jet.
Calculate rotor axial force and piston force of transmission shaft if PDM is used.
Correct influencing factors of drill fluid pressure and temperature (higher than 48.30°C) based on experimental data of pressure difference and temperature influencing rule.
Get real WOB according to equations (1)–(6).
It is noted particularly that, as for different tools, step 8 can only be conducted after that related parameters were obtained via experiments. As for internal pressure of tools, annulus pressure and ambient temperature mentioned in this article were measured by the tool itself.
Correction of measured data, a field case
General information of the applied well
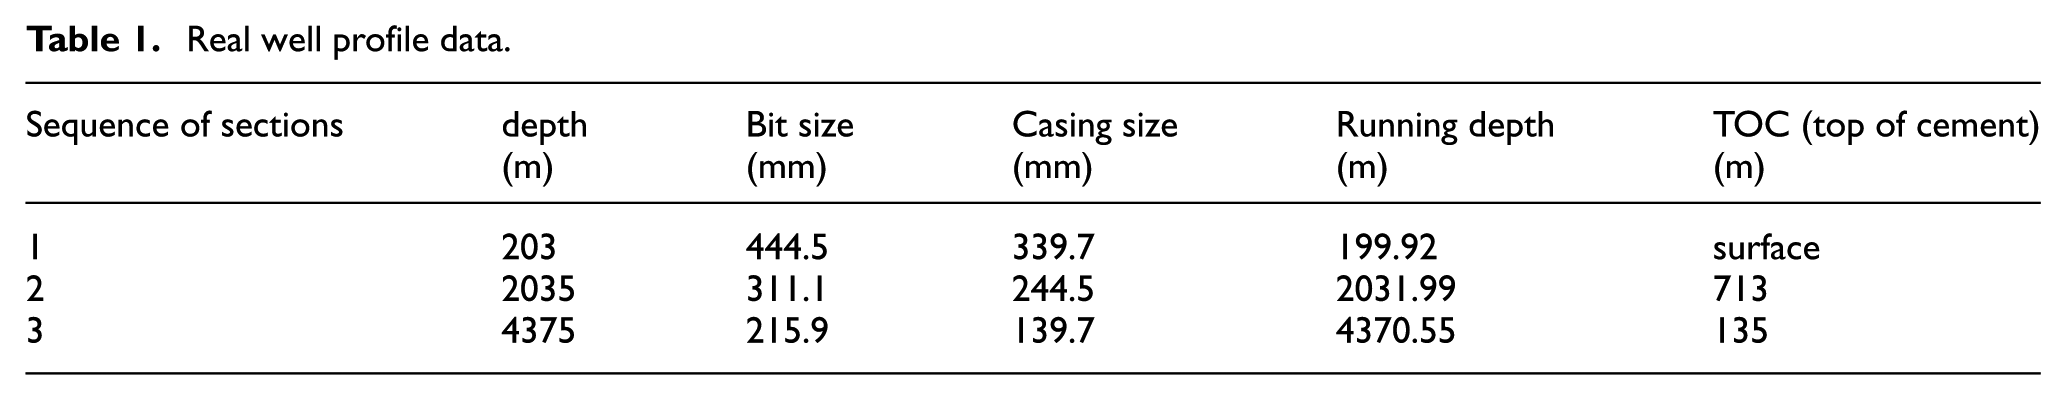
Near-bit multi-parameter measuring sub was applied in Well G126X1; Figure 9 illustrates the on-site situation of the tool while being run into and pulled out of borehole. Table 1 shows the casing program of Well G126X1 with three casing sizes and five successive sections of well profile including vertical, angle build, tangent, angle drop, and horizontal sections. The measuring tool was applied from the depth of cement-plug-to-drill-out (at 2005 m) to 2619 m, went through vertical, angle build, and tangent sections, which were completed in two trips.
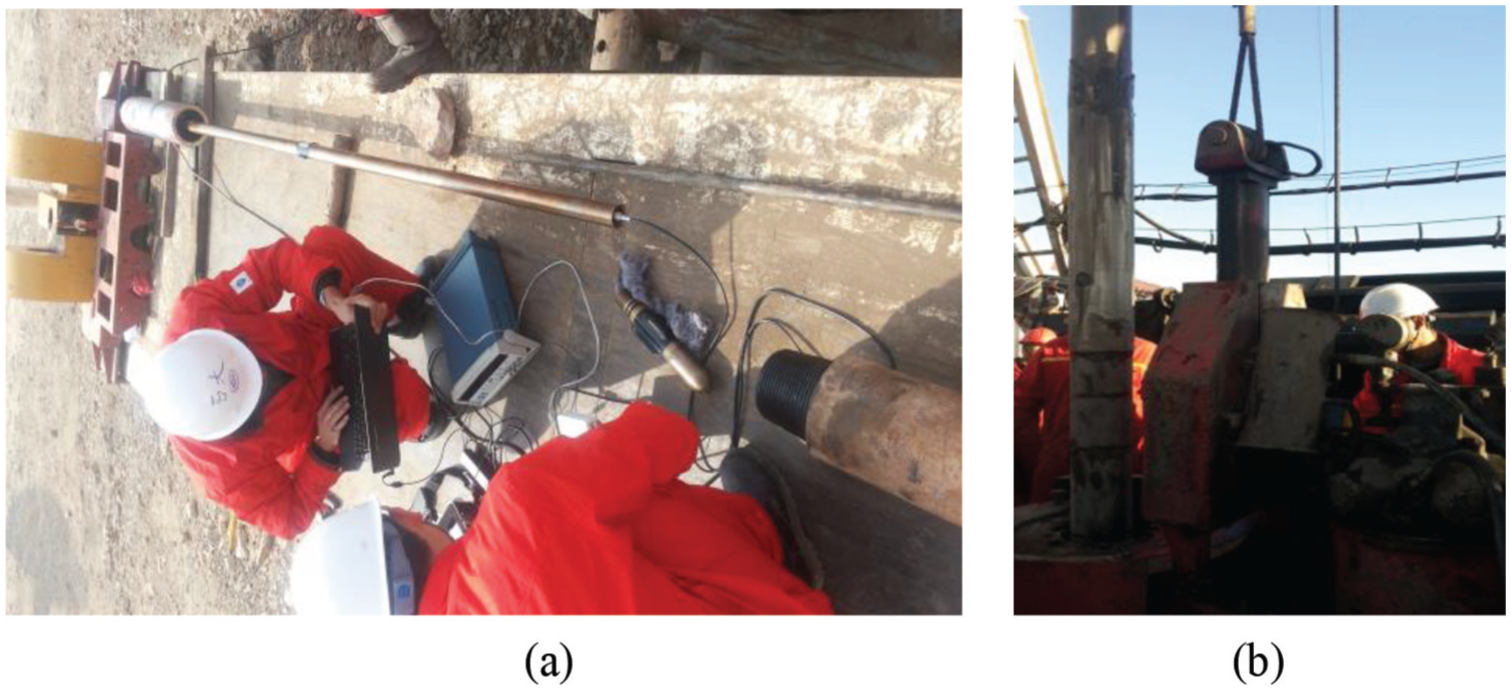
Tool check (a) before running into borehole and (b) pulling out after test.
Real well profile data.
As the test data volume of this well is large, we typically chose partial data in vertical, build-up, and tangent sections, and corrected these measured data for presentation. Drilling fluid properties and hydraulic parameters in the selected sections are shown in Table 2.
Drilling fluid properties and hydraulic parameters in the selected sections.

Correction of measured data
The weight of 5LZ172 PDM on the site is approximately 1300 kg, and testing result at wellhead showed its pressure drop is 2.88 MPa, axial force is 4.39 kN. Following correction steps described above, we analyzed and processed measured data to get the real WOB data.
The influence of deviation of interval 2005–2029 m in the vertical section can be ignored with the maximum deviation of 1.43°. Figure 10 shows the data correction curve.

Correction curve in vertical section
We can see from the curve that the difference between measured axial force and real WOB is about 13–14 kN, compared to indicated WOB 120 kN, from weight indicator (hereinafter referred to as indicating WOB, which is manually read), the difference is narrow. After the correction, the real WOB is even closer to the indicating WOB, and accords with WOB transmission rule better in vertical section.
The interval 2286–2311 m is in the built-up section, with dogleg severity 1.86–2.12°/25 m, average deviation angle 14.8°, and average hole enlargement ratio 17.59%. Figure 11 shows the data correction curve.

Correction curve in build-up section.
From 2:00 a.m. to 4:00 a.m., a compounding drilling was conducted, with indicated WOB approximately 10–55 kN, measured data 10–70 kN, and the corrected real WOB is 8–50 kN. From 1:00 a.m. to 2:00 a.m. and 4:00 a.m. to 6:00 a.m., directional sections were drilled, with the WOB severely up and down. The measured WOB has slight difference to the corrected result. Measured data in bottom hole are obviously higher than indicated WOB, which suggests the WOB is extremely instable in the build-up section, and the data of weight indicator at wellhead cannot truly present the real working conditions of downhole drilling tools.
The interval 2553–2604 m is in tangent section, with the deviation angle 19.97–20.80° and average borehole enlargement rate 6.33%. Figure 12 shows the data correction curve.
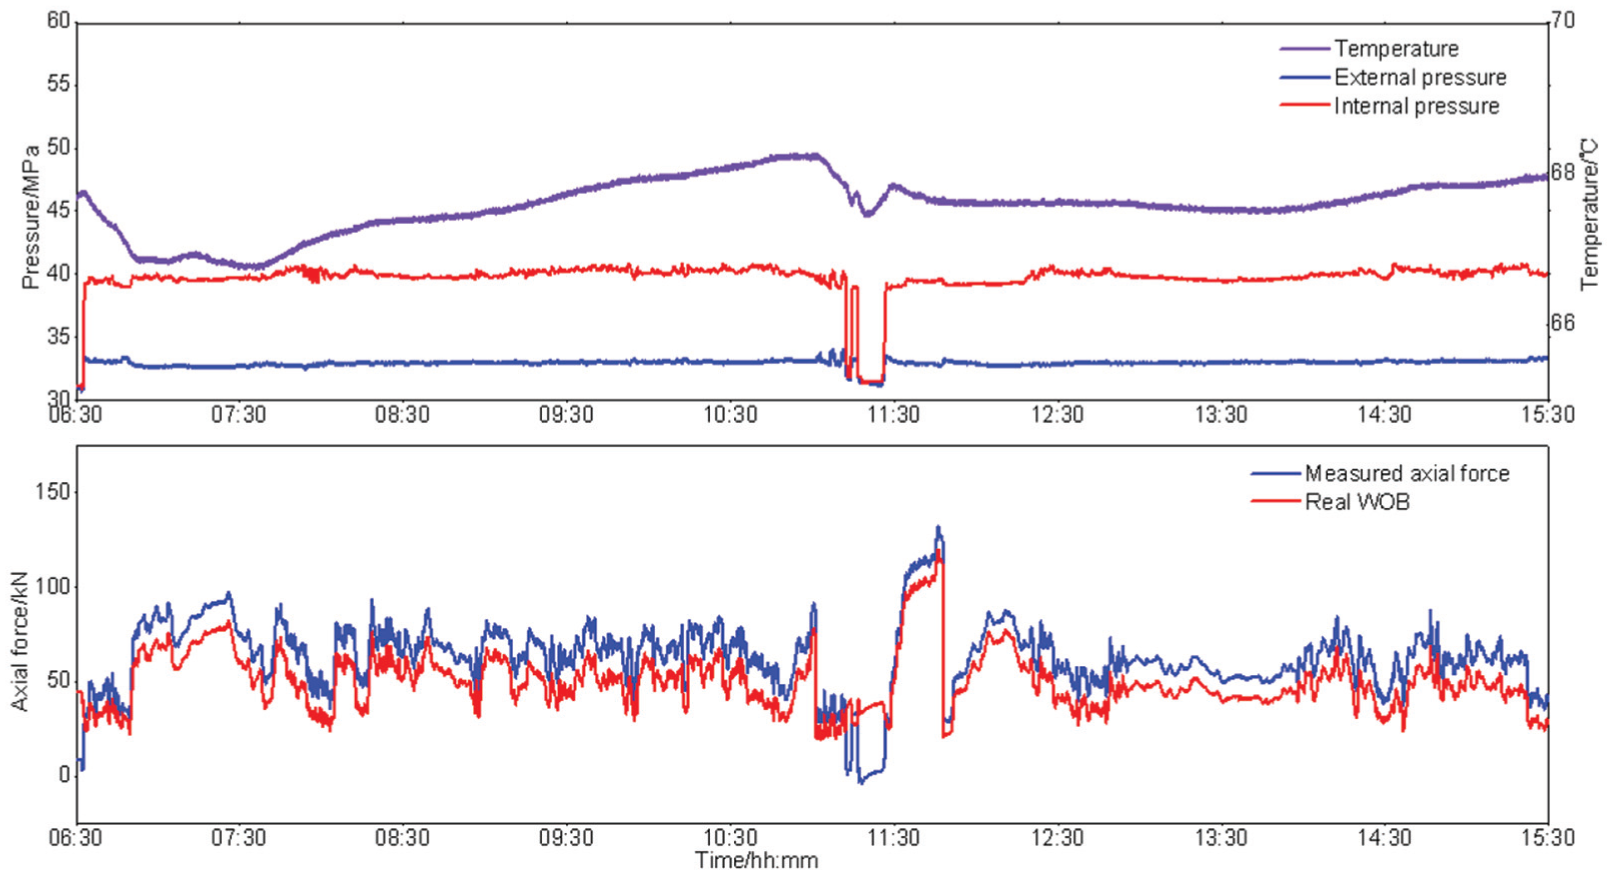
Correction curve in tangent section.
From 10:50 a.m. to 11:50 a.m., reaming and borehole surveying were conducted. In other periods of time, compounding drilling was conducted mainly. During the compounding drilling, the real WOB is 11–20 kN lower than measured data.
The above analysis shows the large difference between the real WOB and the measured data, and the corrected WOB reflects the real downhole working conditions better.
Conclusion
At present, bottom-hole WOB measuring tools are generally applied to measure axial force based on strain principle, and large difference exists between the real WOB and measured WOB, especially in the highly deviated wells. Therefore, to obtain accurate WOB measured data, some factors, such as internal and external pressure on drilling tools, ambient temperature, buoyancy weight, borehole friction, flow friction, and reaction of jet must be considered.
The WOB correction calculation method is appropriate for all WOB measuring tools for measuring WOB data applying principle of stain. It should be noted that with different pasting ways of strain gauges and designed structures of tools, influences of pressure and temperature of drilling fluid are not the same, and should be eliminated using related experimental data.
Higher deviation angle will lead to a greater difference between real WOB and the indicated value at wellhead. Therefore, it is of great significance for a highly deviated well to use a near-bit multi-parameter measuring sub.
Footnotes
Acknowledgements
The authors thank Professor Li Jun and Dr. Jiang Hailong from Petroleum University of China (Beijing), and Dr. Zhang Tao from Beijing Information Science & Technology University for their contributions to this article in calibration and testing of near-bit multi-parameter measuring tools.
Handling Editor: Jan Torgersen
Declaration of conflicting interests
The author(s) declared no potential conflicts of interest with respect to the research, authorship, and/or publication of this article.
Funding
The author(s) received no financial support for the research, authorship, and/or publication of this article.