
Abstract
Temperature evolution of the train brake disc during high-speed braking was investigated using in situ experiments, theoretical analysis, and finite element modeling. The experimental results show that the temperature distribution on the friction surface experienced the formation of a hot ring first, then expansion and duration of the hot ring. Alternative hot spot and cold zone were observed on the friction surface, which is attributed to the local contact in the friction couple and heterogeneous heat dissipation condition in the disc. The corresponding maximum temperature in the disc increased rapidly first, kept stable then, and decrease slowly in the end. The one-dimensional heat conduction equation was applied to predict the maximum temperature variation and was found to be in agreement with the experimental results. Furthermore, the maximum temperature evolution and the temperature distribution of the disc at the braking time of 45 s were simulated by the finite element method, which is satisfactory. In additional, the temperature variation caused the corresponding fluctuation of instantaneous frictional coefficient and thermal stress distribution in the disc, which results in the thermal damages.
Introduction
Increasing maximum running speed and weight reduction represent key development challenges in modern railway systems.1,2 The increase of speeds while improving operating efficiency must also ensure the safe operating conditions. As the key component, the integrity of the brake system is the guarantee of priority in the process of train speed design.3,4 A key concern is that during a braking, the friction between the disc and pads generates a significant amount of heat. The accumulation and dissipation of heat are instantaneous and result in a rapid increase and decrease of temperature in the brake disc.5,6 The hot spots and thermal fatigue caused by rapid increase and decrease of temperature are the main failure cause of the disc.7,8 Therefore, achieving a better understanding of temperature evolution is an important topic in the design and application of brake disc.
In-situ temperature measurement of the brake disc during service is not feasible due to technology and design limitation. The application of reduced-scale railway-type braking equipment in which the loading conditions are as close as possible to that in a full-scale device is developed to measure the temperature in the laboratory. The temperature evolution was defined in three main braking stages, that is, formation of hot band, formation of hot spots, and movement of hot spots. In addition, the third-body flows occurring during braking were also correlated to thermal phenomena.9–12 However, the full-scale braking bench is a priority of the observation of temperature evolution during braking. The corresponding results are rarely reported due to the high cost of full-scale braking tests. Numerical simulation is another efficient approach to investigate the friction heating on the disc surface. The axisymmetric finite element (FE) analysis of temperature fields and wear in the disc were investigated to study the effect of the friction coefficient on the braking time, braking distance, maximum temperature of a disc, and the evolution of the sliding.13–17 The laboratory and numerical simulation results are helpful on the safety design of the disc. Although the temperature evolution on the disc has been investigated by the in-situ and full-scale experiments, the theoretical analysis and numerical simulation on the temperature evolution of the disc, the comparative study on these three methods are deficient.
During braking, friction between the disc and pads generates a significant amount of heat. Generally, the distribution and conduction of the heat is heterogeneous, which leads to special thermal phenomena such as the formation of hot bands and hot spots.18–21 These thermal phenomena interact with third-body flows and friction mechanisms activated in the contact. If the speed is below a certain value, no crack initiates.22–24 If that is above the threshold value, cracks were observed.25–27 The temperature investigation will help predict the speed threshold value for crack initiation of the disc.
In this article, the brake experiments in the full-scale braking bench were conducted to investigate the temperature evolution of the friction surface during emergency braking to evaluate the maximum conditions of the disc. Infrared equipment was applied to measure the in situ temperature evolution of the disc during the complete braking process. Variation of the frictional coefficient was recorded during braking, and the thermal damage including hot spots, segmentation cracks, and radial main cracks on the disc surface was also characterized. Then, the temperature evolution on the disc is analyzed using the heat conduction equation and FE method. The comparative study was conducted on these three methods.
Test material and experimental methods
Tested brake disc and pads
The brake disc that used in the China Railway High-speed train is made of 30CrNiMn steel and is manufactured by a closed die forging process. There are two types of discs used in high-speed trains including wheel mounted and axle mounted. Wheel-mounted disc was chosen in this investigation for easy observation. For observing the temperature evolution of brake disc in the actual service conditions, the serviced brake disc is removed from the train for experiments. The inner and outer diameters are 286 and 725 mm, respectively, with a thickness of 52 mm, as shown in Figure 1. The new brake pads are made of powder metallurgy with a surface of 350 cm2. The pads were made of powder metallurgy that contains eight friction blocks each (Figure 1).

Wheel-mounted brake disc and pads.
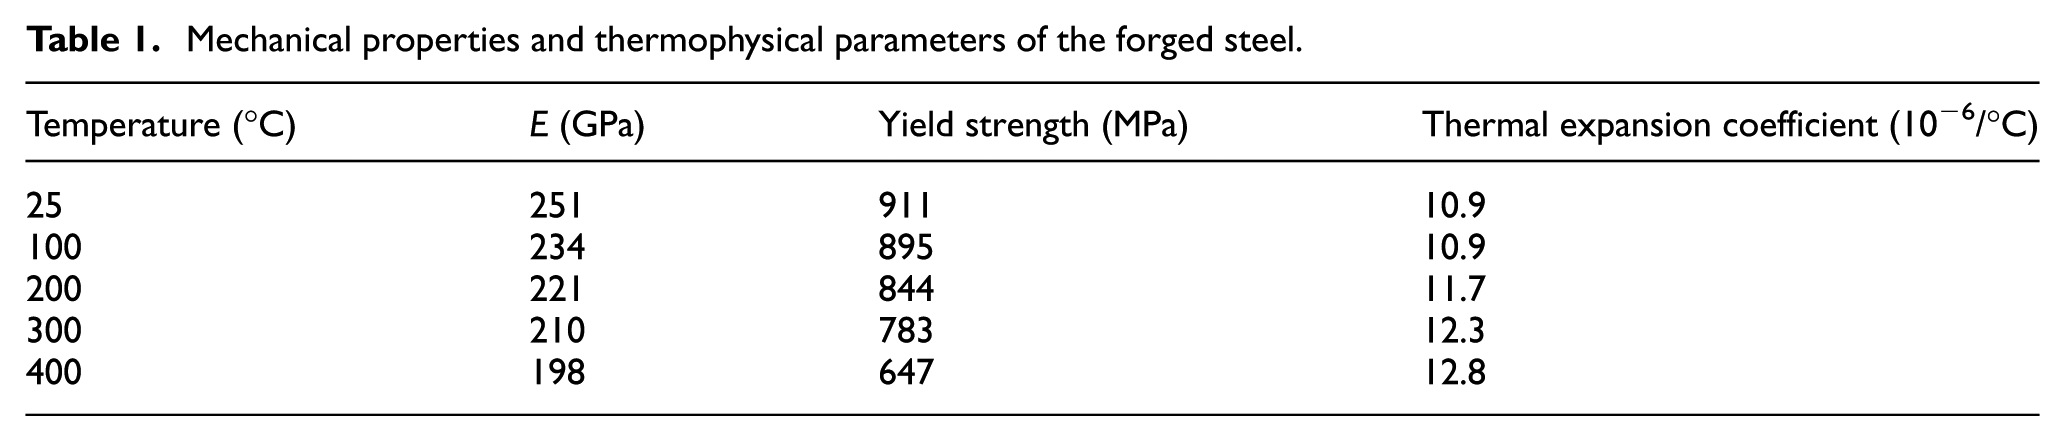
Before braking, the mechanical properties, and thermophysical parameters of the forged steel were measured at the temperature of 25°C, 100°C, 200°C, 300°C, and 400°C. The results are presented in Table 1. With the increase of tested temperature from 25°C to 400°C, the elasticity modulus showed a decrease from 251 to 198 GPa (about 20%). The yield strength decreased from 911 to 647 MPa (about 30%) and thermo expansion coefficient increased from 10.9 to 12.8 × 10⁻⁶/°C (about 10%). Therefore, the mechanical properties and thermophysical parameters are temperature dependent, which are important parameters for the FE analysis of temperature fields.
Mechanical properties and thermophysical parameters of the forged steel.
Brake testing methods
The railway disc brake (Figure 1) is tested on a full-scale braking bench, as shown in Figure 2. An electric motor drives the train axle equipped wheels and brake disc. The maximum capacity of velocity offered by the bench is 420 km/h which covers the experiment requirement. Pads actuated by hydraumatic are used to brake by friction. Measurements of temperature on the disc during braking are conducted by a thermal imaging equipment. The Fotric infrared system was set to take temperature readings at a frequency of 1 Hz. 3/4 of the brake disc can be observed, and the rest is shield by the clamping apparatus.
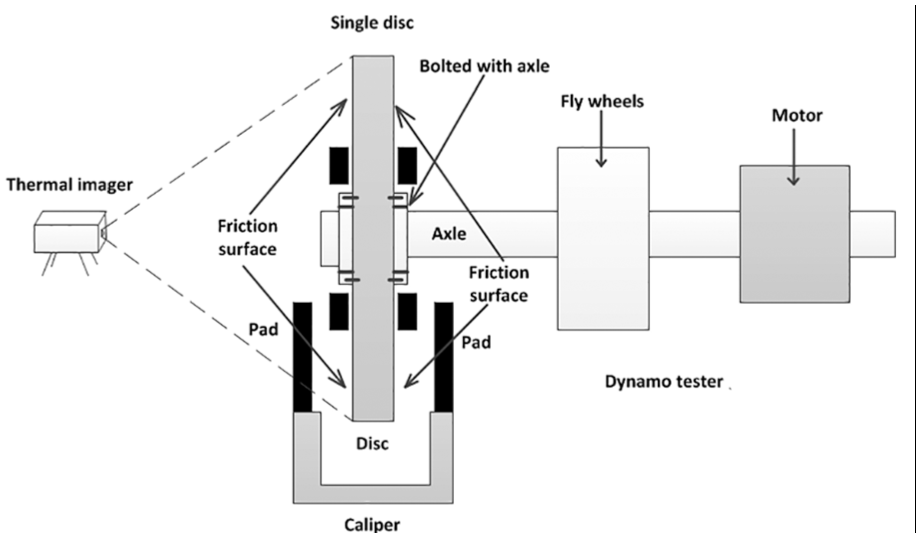
Schematic diagram for 1:1 scale braking bench and infrared temperature measuring system.
The service braking is first the launching of electro-dynamic braking and then the disc braking at a small speed, while the disc braking is launched at the beginning of emergency braking. Although the emergency braking hardly ever happens in the service, the temperature evolution on the friction surface of the disc in the extreme condition of emergency braking has scientific significance and reference value for the reliability evolution of the disc. The service braking is first the launching of electro-dynamic braking and then the disc braking at a small speed, while the disc braking is launched at the beginning of emergency braking. Although the emergency braking hardly ever happens in the service, the crack propagation on the friction surface of the disc in the extreme condition of emergency braking has scientific significance and reference value for the reliability evolution of the disc. The general test procedure can be summarized as follows. First, the tested disc is mounted to the wheels. Second, the grinding in between the pads and disc is conducted since the pads are new. Third, the axle–wheel system was driven to the target test speed of 250 km/h and kept running for 3 s. Finally, the pads were driven by a 19 kN force to brake for 25 s and then switched to 30 kN for the rest braking. This is consistent with the principle of low thrust at high speed and high thrust at low speed. Figure 3 presents the thrust of the pads and velocity during braking. The temperature evolution was measured by the infrared temperature measuring system. After every braking, the disc cooled down to the room temperature for the next run. The environmental conditions including room temperature and humidity were kept constant.
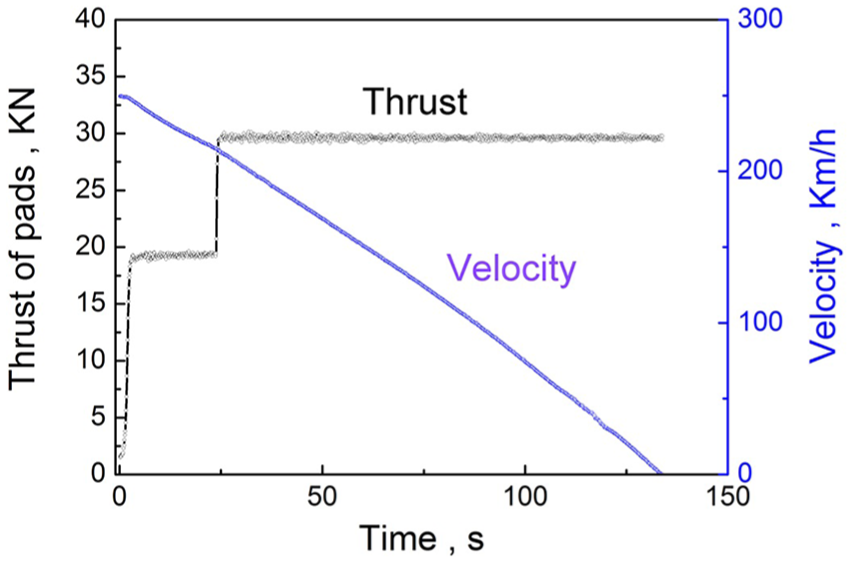
Thrust force of the pads and velocity of the wheel during braking.
Results
Temperature field during high-speed braking
The in situ experimental results of temperature evolution on the friction surface of the disc are presented in Figure 4. About 3/4 of the disc can be observed. First, Figure 4(a) and (b) presents the formation and expansion of hot ring to the whole friction surface. During the first 10 seconds, the local contact between the pad and disc caused a single hot ring. The maximum temperature in the hot ring rapidly increased from room temperature to 210°C in 1 s (Figure 4(a)) and then to 335°C in 3 s (Figure 4(b)). The hot ring also increased to cover the whole friction surface (Figure 4(c)). In this stage, abundant friction heat input into the disc, and the distribution of the input heat is heterogeneous. Figure 4(c) presents the duration of hot ring from t = 10 s until the end of braking. The top temperature of the disc is 430°C, and the hot ring covered the whole friction surface. Figure 4(d) presents the temperature distribution of the disc at the end of braking, indicating that the hot ring consists of alternative hot spot and cold zone. Hot spots are another important reason for the failure of the disc. Numerous investigations have been conducted on the formation of hot spots and their damage on the disc.28,29 Two reasons have been mentioned most: one is the heterogeneous contact between the pad and disc in the circumference direction and the other is the different heat dissipation conditions of the disc.
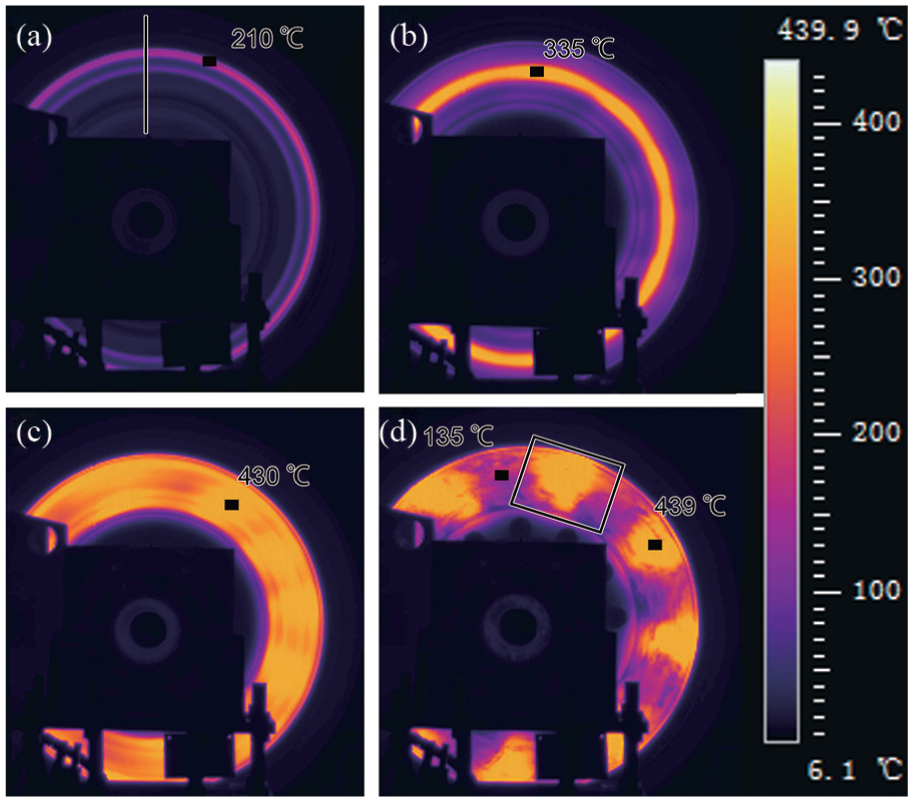
In-situ thermographic measurements of the friction surface at the braking time of (a) 1 s, (b) 3 s, (c) 9 s, and (d) 135 s.
Thermal shock and thermal-mechanical stress are two of the main service loads for the disc and are both related to the temperature, especially the maximum temperature. Figure 5(a) presents the maximum temperature evolution on the disc as a function of the braking time. Ten cycles of braking have been observed. The temperature evolutions for these 10 brakes are almost the same. Three stages in the maximum temperature evolution can be defined, as shown in Figure 5(b). Stage I: The input friction heat is much larger than the heat dissipation, and the maximum temperature rapidly increases to 430°C in 10 s. Stage II: Due to the braking process, the velocity rapidly decreased. The input friction heat is almost equal to the heat dissipation, and the temperature keeps in about 430°C. Stage III: The input friction heat is less than the heat dissipation, and the temperature decreased. Figure 5(c) presents the distribution of the temperature in the radial direction of the disc (marked by line in Figure 1(a)), indicating the heterogeneous distribution of the temperature during the braking. The feature of temperature peak appeared at the beginning of the braking which is corresponding to the hot ring in Figure 4(a). The temperature peak rapidly increased until the temperature peak covered the whole friction surface. Figure 5(d) presents the temperature distribution of the hot spot. An evident temperature gradient is presented in the boundary of the hot spot and cold zone. This temperature gradient caused thermal stress in the disc, which is detrimental to the safety of the disc.

Temperature evolution on the friction surface of the disc: (a) maximum temperature versus the braking time, (b) stage features of the maximum temperature evolution, (c) distribution of the temperature in the radial direction of the disc, and (d) temperature distribution of the hot spot.
Friction coefficient
Figure 6 shows the variation of the instantaneous friction coefficient during braking, and the white line is the evolution of the average value. The calculation of friction coefficient is

Instantaneous friction coefficient versus braking time.
Thermal damage on the disc
As mentioned above, the disc is bearing a significant thermal-mechanical fatigue including thermal shock in the repeated braking during the service of the high-speed train, which results in thermal damages in disc surface. Typical location has been chosen for observation (marked by circle in Figure 7(a)). Three typical thermal damages have been observed, as shown in Figure 7(b). Type A is the hot spot. Six hot spots with the average area of 30 mm2 are observed in Figure 7(b). The formation mechanism of hot spots is attributed to the local high temperature during braking. The surface microstructure in the hot spots has been oxidized and presents the gray morphology. Type B is the segmentation crack containing grid cracks with length of 1 mm. The segmentation cracks bestrewed almost the whole friction surface of the disc. The heterogeneous temperature distributions between the hot spots and cold zone, the surface and subsurface of the disc are responsible for the segmentation crack formation. Type C is the radial main crack which is the main cause for the failure of the disc. The radial main crack results from the hot spots and segmentation crack. The process of the thermal damage on the disc surface is first the formation of hot spots, second the segmentation crack, and finally the radial main crack. All of the three thermal damages increase the surface roughness and deteriorate the friction property.

(a) Images showing thermal damage on the disc surface and (b) typical damage on the disc (A: hot spots; B: segmentation crack; C: radial main crack).
Discussion
Theoretical analysis on the temperature evolution
The heat convection does not exceed 5% of the heat generated by the friction in the usual conditions so it can be neglected. The transfer of heat generated from the friction between the pads and disc is mainly by the heat conduction in the disc. The heat conduction in the circumference direction is symmetric, and that in the radial direction can be ignored. Therefore, the heat conduction in the disc can be treated as only in the direction normal to the disc surface. Then, the one-dimensional heat conduction equation is proposed to describe the temperature evolution T(y, t) on the disc surface 30

where k is the thermal diffusivity (m2/s), y is the distance from the disc surface, t is the braking time, ts is the total time of braking, and i = 1, 2 denoting the disc and pads.
The heat source is generated from the friction between the disc and pads. An equivalent heat source is proposed as follows

where f(t) is the instantaneous frictional coefficient as shown in Figure 6, V(t) is the velocity, P(t) is the pressure stress of the pads, and η is the proportion of the heat that import to the disc.
The boundary condition is


where T1(0, t) and T2(0, t) are the temperature of the disc and pads surface; T(t) is the theoretical predicted temperature.
Initial conditions are

The following dimensionless variables and parameters

where ts is the duration of the application of load from zero to the maximum values and T0 is

Applying the Laplace transform to equations (1) and (5), the dimensionless temperature is

where

Consider the case that frictional coefficient and pressure stress are constant. The velocity is

Then, the dimensionless temperature on the friction surface (y = 0) is

The values of the parameters are
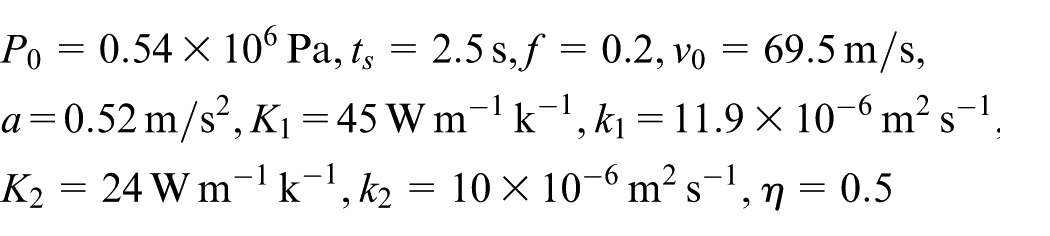
where the parameters P0, ts, f, v0, and a were obtained by the experiments, and the K1, k1, K2, k2, and η are material parameters obtained by tested.
Figure 8 presents the maximum temperature predicted by present model with experimental results, indicating that the model results are in good agreement with the experimental results. It is worth noting that the theoretical solution can only predict the maximum temperature on the surface of the disc. The finite method is applied to predict the temperature field and the corresponding thermal stress next.

Comparison of maximum temperature predicted by present model with experimental results.
Numerical simulation on the temperature evolution
The FE method was applied to simulate the temperature on the disc during braking. The following assumptions are taken into account:
The entire kinetic energy transited into the heat, and the heat losses due to convection are negligible.
The contact surface between the disc and pads is ideal, and the frictional coefficient is constant.
Coulomb’s law has been assumed and the frictional coefficient is constant.
The temperature at the boundary of disc and pads is equal.
Thermal conductivity coefficient, thermal expansion coefficient, and heat capacity are temperature dependent, while the density is temperature independent.
The governing equation of the temperature field on the disc surface is presented in equation (1). The heat source is presented in equation (2), and the boundary conditions are presented in equations (3)–(5). The pre-processing consists of the modeling of the disc, meshing, load, and boundary conditions, as shown in Figure 9. The FE modeling simplified from brake disc is presented in Figure 9(b) with displacement boundary conditions. The corresponding meshing with tetrahedral elements in ANSYS is presented in Figure 9(c).

Finite element modeling showing (a) brake disc geometry for back of the friction surface, (b) simplified disc model, and (c) corresponding FE meshing of the disc.
The maximum temperature during braking is an important parameter for the assessment of safety and service performance. Figure 10 shows a comparison of the maximum temperature obtained from simulation and experimental results. The maximum temperature by numerical simulation increases with the increase of the braking time. The simulation results are a little bit less than the experimental results, which is likely caused by the idealized contact assumption in the simulation. The contact surface of the disc and pads is ideal for the case of simulation, while that for the case of experiments contains thermal damages as mentioned in section “Friction coefficient.” In general, the simulation results are satisfactory.

Comparison of maximum temperature obtained by simulation with experiments.
Figure 11 shows the temperature distribution of the disc at a braking time of 45 s. It is noted that the temperature distribution of the disc is heterogeneous. First, hot spots were observed in the temperature contour of friction surface (red spots in Figure 11(a)) which is similar with the experimental results, as shown in Figure 4(d). It is worth noting that the formation of the hot spots seen in the simulation results is attributed to the heterogeneous heat dissipation conditions of the disc. The region with protrusions or ribs is more conducive to the heat conduction for more surface area, and that without protrusions is less conducive. Both heat dissipation conditions and heterogeneous contact are responsible for the formation of hot spots in the experimental results. Similar temperature distribution is also observed at the back of the friction surface, as shown in Figure 11(b). The temperature in the depth direction is gradient distribution, that is, the temperature decreases from friction surface to the back of friction surface, as shown in Figure 11(c). The heterogeneous temperature distribution in the disc causes the thermal stress, which is the main cause of the disc failure.

Predicted temperature distribution of the friction surface (a), back of friction surface (b), and profile of the disc (c) at the brake time of 45 s.
Figure 12 presents the corresponding effective stress distribution of the disc at the braking time of 45 s. The maximum Von-Mises effective stress is 485 MPa, which is less than the yield strength of 647 MPa at the temperature of 400°C, which locates at the middle position of the friction surface. Therefore, the service loads satisfy the strength criterion. The fatigue damage should be considered for repeated braking.31–33 In general, the temperature on the disc is mainly determined by the service speed. The temperature variation will cause the thermal cycling stress. With the increase of service speed, the maximum temperature increases. Then, the corresponding thermal cycling stress increases. When the thermal cycling stress is larger than the threshold stress of the crack initiation, crack forms and the brake disc cannot service safely in this speed. Therefore, the service reliability of the brake disc should consider the service speed, the contact condition of the friction couple, the heat dissipation conditions of the disc, and the threshold stress of crack initiation. In addition, Qian et al.34–37 proposed a robust new local approach to fracture behavior of the reactor pressure vessel material in the ductile-to-brittle transition regime, which will also help the design, manufacture, and service of the brake disc in return.

Corresponding effective stress distribution of the friction surface (a), back of friction surface (b), and profile of the disc (c) at the brake time of 45 s.
Conclusion
In the present study, temperature evolution of the brake disc during high-speed braking was investigated using in situ experiments, theoretical analysis, and FE method. The following conclusions can be drawn:
Temperature evolution of the disc by in situ measurement indicates that a hot ring forms and expanses to the whole friction surface, and the hot ring consists of alternative hot spot and cold zone hot spots and cold zones. Three stages were defined in the variation of the maximum temperature during braking, that is, rapid increase, stabilization stage, and falling slowly. Correspondingly, the evolutions of frictional coefficient contain three stages, that is, rapid increase, falling slowly, and increase again.
Thermal damages of hot spot, segmentation crack, and radial main crack were observed on the disc surface. The formations of these damages are attributed to the temperature variation in the repeated braking during the service of the high-speed train. All of the three thermal damages increase the surface roughness and deteriorate the friction property which in turn increases the localization of temperature on the disc.
The one-dimensional heat conduction equation was used to predict the maximum temperature in the disc during braking. The predicted results are in agreement with the experimental results. Meanwhile, the maximum temperature evolution and the temperature distribution of the disc at the braking time of 45 s were simulated by the FE method, which is satisfactory.
The experimental results are intuitive but high cost, and the theoretical results are universal but cannot present the temperature localization. The results by FE method are good addition in the investigation of temperature evolution on the friction surface of the disc.
Footnotes
Handling Editor: José Correia
Declaration of conflicting interests
The author(s) declared no potential conflicts of interest with respect to the research, authorship, and/or publication of this article.
Funding
The author(s) disclosed receipt of the following financial support for the research, authorship, and/or publication of this article: The study was financially supported by the National Natural Science Foundation of China (no. 11802011), the Fundamental Research Funds for the Central Universities (2017JBM052), the National Key Research and Development Program of China (no. 2017YFB0702004), the 973 Programs under grant no. 2015CB654805, and the National Key Technology R&D Program under grant no. 2015BAG12B01-09.