
Abstract
Blend refrigerants combing hydrofluorocarbons and hydrocarbons are good substitutes to decrease the flammability of hydrocarbons while reducing the global warming potential of hydrofluorocarbons. Four hydrofluorocarbon/hydrocarbon blends (R134a/R290, R134a/R600, R134a/R600a, and R134a/R1270) with various compositions are investigated in vapor-compression heat pump cycles. The effects of hydrocarbon fraction on the blend properties, including critical temperature, critical pressure, latent heat, saturated liquid line, and azeotropic behavior, are comparatively analyzed. Thermodynamic models are established for heat pump simulation. For each R134a/hydrocarbon blend, both the cooling and heating coefficient of performances generally first decrease and then increase with the hydrocarbon mass fraction. The coefficient of performances of R134a/R600 and R134a/R600a have dramatic changes within the hydrocarbon mass fraction of 0.2–1.0, while those of R134a/R290 and R134a/R1270 have dramatic changes within the fraction of 0.0–0.4. Lower condensing or higher evaporating temperatures lead to higher coefficient of performances. In addition, the volumetric capacities first increase and then decrease with the increase of hydrocarbon fraction. R134a/R290 and R134a/R1270 show much higher volumetric capacities as compared to R134a/R600 and R134a/R600a under higher hydrocarbon fractions, which can greatly reduce the required compressor size of pure R134a. The discharge temperatures are kept in the range of 43.0°C–72.3°C for all the blends. To obtain low global warming potential R134a/hydrocarbon blends, the hydrocarbon fraction need to be greater than 0.9, at which R134a/R1270 performs the best, with cooling/heating coefficient of performances of 5.25/4.70 and cooling/heating volumetric capacities of 4.78/3.53 MJ/m3. Generally, R134a/R290 and R134a/R1270 perform much better than R134a/R600 and R134a/R600a at the low global warming potential composition. This study can contribute to the determination of hydrofluorocarbon/hydrocarbon compositions based on comprehensive considerations of cycle efficiency, volumetric capacity, and low global warming potential target.
Introduction
Aiming to mitigate the global warming and ozone depletion problems related to refrigerants, the heating, ventilation and air conditioning (HVAC) society has been exploring environmentally friendly refrigerants for replacement. The widely used hydrochlorofluorocarbons (HCFCs) are being phased out due to the ozone depletion potential (ODP), while the hydrofluorocarbons (HFCs) are required to be phased down from as early as 2019 due to the global warming potential (GWP) according to the amendment to Montreal Protocol. 1 Since 2011, the refrigerants with GWP higher than 150 have been banned in automobile air conditioners in European. For this regard, the refrigerant substitutes with low GWP and zero ODP have been intensively investigated. Among all the candidates, hydrofluoroolefins (HFOs) 2 and hydrocarbons (HCs)3,4 attract increasing interests.
As natural refrigerants, the HCs, including R290 (propane), R600 (butane), R600a (isobutane), and R1270 (propylene), are considered as potential alternatives because of their energetic efficiency and environmental compatibility. 5 However, pure HC refrigerants are inferior to the conventional refrigerants in terms of the high flammability, which limits their applications in heat pump, air conditioning, and refrigeration systems. To solve this problem, blend refrigerants have been proposed by mixing HFCs and HCs, so as to decrease the flammability of HCs while reducing the GWPs of HFCs. A number of studies have been carried out on different HFC/HC blends for vapor-compression heat pump cycles, with the research progress briefly introduced for binary blends and ternary blends.
For the binary HFC/HC blend refrigerants, Zhang et al. 6 measured the gaseous pVTx data for R134a (1,1,1,2-tetrafluoroethane)/R290 at temperatures from −15°C to 21°C, pressures up to 0.86 MPa, and R134a mole fractions from 0.2391 to 0.7989. Li et al. 7 measured the saturated liquid densities and bubble-point pressures for binary mixtures of R134a/R290 with a temperature range of −20°C to 20°C and R134a mole fractions of 0.105 to 0.557. Zhang et al. 8 built a Helmholtz free energy equation of state (EOS) for R134a/R290 to describe the thermophysical properties of the binary mixture. The estimated standard uncertainties were 0.70% and 0.90% for the bubble-point and dew-point pressures, 0.26°C and 0.29°C for the bubble-point and dew-point temperatures, 0.13% and 0.60% for the saturated liquid and vapor densities, respectively. Park and Jung 9 measured the vapor–liquid equilibrium (VLE) data of R125 (pentafluoroethane)/R290 with the temperature range of 0°C–40°C and the R125 mole fraction range of 0.1–0.8. The experimental data were correlated using EOS, and azeotropic behavior was found near R125 mole fraction of 0.77. The vapor pressure of the azeotropic blend was between those of R22 (chlorodifluoromethane) and R32 (difluoromethane)/R125 (50%/50%). In addition, the VLE data of blend refrigerants like R32/R290, 10 R143a (1,1,1-trifluoroethane)/R290, 11 and R152a (1,1-difluoroethane)/R290 12 have also been measured and correlated by different researchers. Lim et al.13,14 measured the VLE data of R152a/R600 and R134a/R600 binary blends at various temperatures. The experimental data were well correlated with the Peng–Robinson EOS.
Besides the blend thermophysical properties, the cycle performance of different HFC/HC blends has been investigated. Kim et al. 15 evaluated the performance of two azeotropic refrigerant blends of R134a/R290 (55%/45%) and R134a/600a (80%/20%) in a heat pump. The coefficient of performance (COP) of R134a/R290 was lower and the capacity was higher as compared to R22 and R290, and those of R134a/R600a were both higher as compared to R12 (dichlorodifluoromethane) and R134a. In addition, the discharge temperatures were lower than those of R12 and R22. Wang et al. 16 studied a heat pump cycle using R125/R290, R125/R600, R125/R600a, and R125/R1270 based on fixed minimum heat transfer temperature difference. The cycle performance was analyzed at various R125 compositions. Compared to the conventional R22 and R134a, the R125/HC at certain R125 concentrations exhibits better performance. Bobbo et al. 17 discussed the possibility to apply different HFC/HC blends in HVAC applications. The considered HFC and HC included R125, R134a, R143a, R290, and R600a. Results indicated that that blends with R600a showed a relatively good COP, but their applications could be limited due to the possible sub-atmospheric evaporating pressures and the poor volumetric capacities. Blends with R290 had acceptable COPs and volumetric capacities only at relatively high R290 fractions. Prakash et al. 18 analyzed the energetic and exergetic performance of a refrigeration system with the mass fraction of R152a/R600a (0.9/0.1), R152a/R600 (0.9/0.1), and R152a/R1270 (0.92/0.08) to replace R12. The exergy efficiency and the COP increased whereas the exergy destruction ratio decreased with decreasing temperature difference between the evaporator and refrigerated space. Exergy defect occurring in the different components were illustrated to display the potential improvements.
For the ternary HFC/HC blend refrigerants, there are also increasing studies. Wongwises and Chimres 19 presented an experimental study of R134a/R290/R600 (30%/40%/30%) and R134a/R290/R600a/ (30%/40%/30%) to replace R134a in a domestic refrigerator. The comparisons showed that the HC blend R290/R600a with a composition of 60%/40% performed better than the R134a/HC blends with the fixed compositions. Sekhar and Lal 20 experimentally investigated the blends containing R134a (7%, 9%, and 11%) and two HCs (44.8% R290% and 55.2% R600a) in two low-temperature systems (a domestic refrigerator and a deep freezer) and two medium-temperature systems (a vending machine and a walk-in cooler). Compared to R12, the blend refrigerant containing 9% R134a reduced the energy consumption by 5%–15% in low-temperature systems and 10%–30% in medium-temperature systems. Jabaraj et al. 21 investigated the blends containing R407c (mixture of difluoromethane, pentafluoroethane, and tetrafluoroethane) (80% and 90%) and two HCs (45.2% R290% and 54.8% R600a) in a window air conditioner. Results showed that the condenser tube length was increased by 19% to suit the mixtures as compared to R22. Compared to R22, the capacity was 9.5%–12.8% higher, while the COP was 11.9%–13.2% higher. In addition, the flow boiling heat transfer of R134a/R290/R600a blend in smooth horizontal tubes 22 has also been investigated. Wu et al. 23 investigated the thermodynamic properties of zeotropic mixtures of R600a/R23/R14. The simulation results were compared with the experimental values with an average error of 0.31%. The pressure–enthalpy diagrams of an auto-refrigerating cascade system using R600a/R23/R14 were given to describe the cycle process. Shaik and Babu 24 analyzed the thermodynamic performance of window air conditioner systems using HFC/HC blends as alternatives to R22. The blends included R134a/R290 (60%/40%), R134a/R1270 (60%/40%), and R134a/R1270/R290 with 13 compositions. Under condensing and evaporating temperatures of 54.4°C and 7.2°C, the thermodynamic performance of blend refrigerant R134a/R1270/R290 (50%/5%/45%) was better than that of R22. Arcaklıoğlu et al. 25 analyzed the COP and irreversibility of a vapor-compression refrigeration system with a liquid-line/suction-line heat exchanger using artificial neural networks. Various blend refrigerants had been considered, including R134a/R290, R134a/R600a, R125/R134a/R290, and R125/R143a/R290 with fixed compositions. Elumalai et al. 26 tested a residential air conditioner using five R152a/R290/R600 mixtures. The mixture R152a(10%)/R290(10%)/R600(80%) was found to give 5.27% higher COP and 5.22% lower power consumption than that of R22.
From the above literature review, it is found that although various HFCs have been investigated, the HCs were mainly R290 and R600a. In addition, most of the binary or ternary blend refrigerants were fixed at constant compositions. Particularly, for R134a/HC blend refrigerants, limited HCs with limited compositions have been comparatively explored. Considering that R134a is currently a widely used HFC refrigerant and different compositions of R134/HC lead to different GWPs, four HFC/HC blends (R134a/R290, R134a/R600, R134a/R600a, and R134a/R1270) with various compositions are applied in vapor-compression heat pump cycles. The influence of HC mass fraction on the cycle performance and the blend GWP are compared for different blend refrigerants. The main objective of this study is to contribute to the determination of HFC/HC compositions based on comprehensive considerations of cycle efficiency, volumetric capacity, and low GWP target.
Refrigerant property and cycle model
Pure refrigerant properties
The thermophysical properties of the pure refrigerants greatly affect the blend properties. The main properties of R134a and the four involved HCs (R290, R600, R600a, and R1270) are briefed in Table 1.27–30 Comparisons indicate that R1270 and R290 have the highest level of saturated pressure at the specified temperatures. On the contrary, R600 and R600a show the lowest level of saturated pressure and may suffer from sub-atmospheric operation if the evaporation temperature falls below 0°C. As for the latent heat, all the four HCs have relatively similar values, which are much higher than that of R134a.
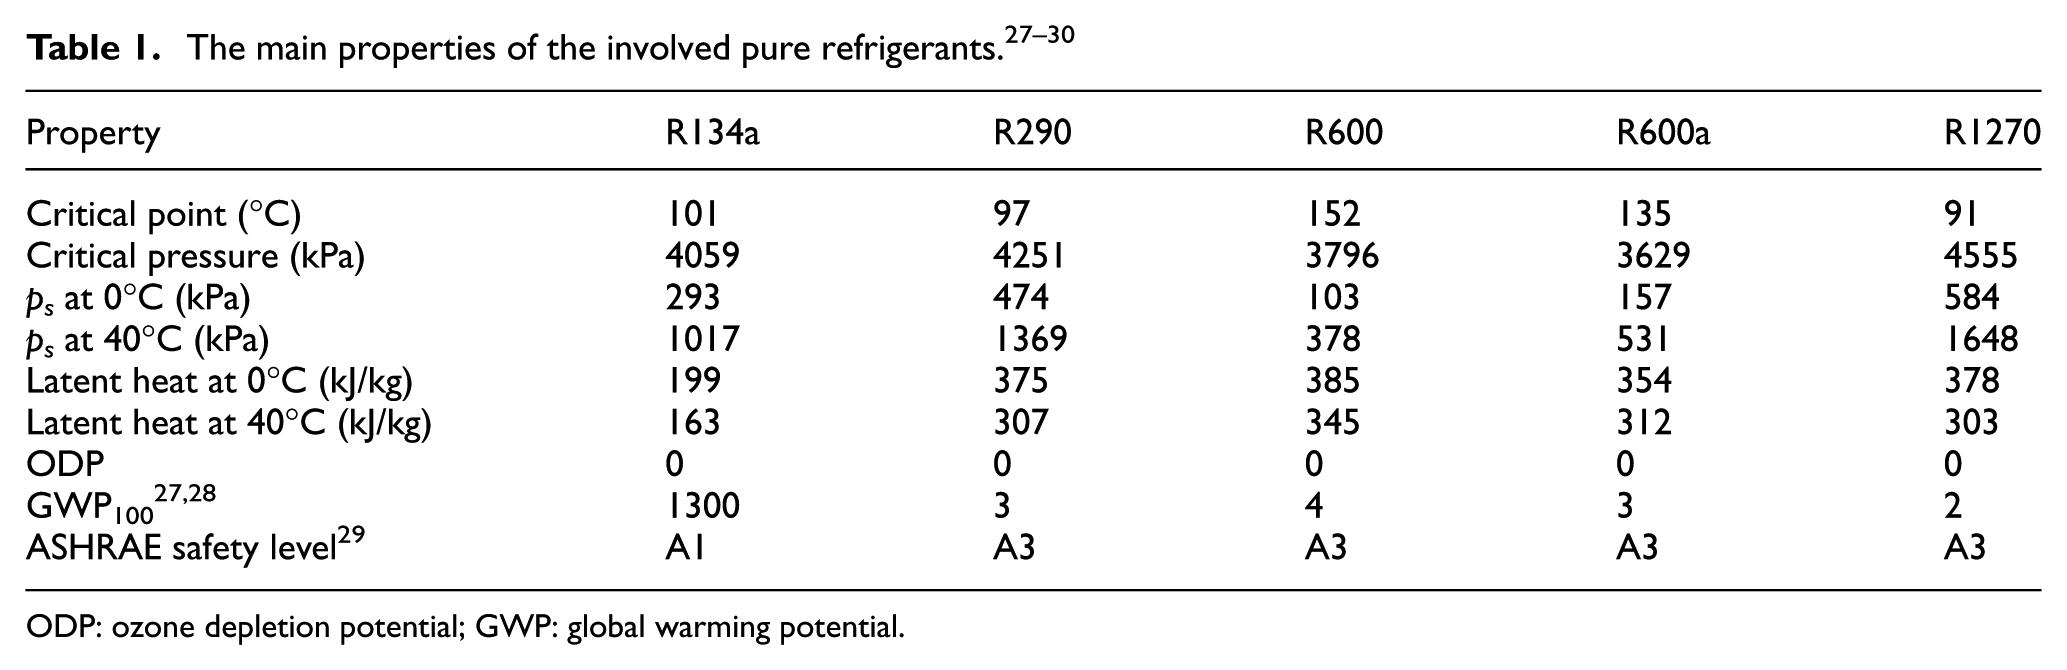
ODP: ozone depletion potential; GWP: global warming potential.
In terms of the environmental friendliness, all the five pure refrigerants have a zero ODP, so do their blends. The GWP of R134a is relatively high, while those of the four HCs are extremely low. Therefore, the HFC/HC blends can greatly reduce the GWP of R134a. A big concern of HCs is their high flammability, classified as A3 safety group (ASHRAE safety level). By mixing with R134a, classified as A1 safety group, the flammability can be effectively reduced.
Blend refrigerant properties
Since the composition greatly affects the properties of the blend characteristics, the thermophysical properties of different HFC/HC blend refrigerants are obtained under various HC mass fractions (from 0.0 to 1.0) and blend temperatures (0°C, 20°C, and 40°C). The blend refrigerant properties are calculated using REFPROP 30 developed by the National Institute of Standards and Technology to calculate the thermodynamic and transport properties of industrially important fluids and their mixtures. REFPROP is based on the most accurate pure fluid and mixture models currently available. The mixture calculations employ a model that applies mixing rules to the Helmholtz energy of the mixture components; it uses a departure function to account for the departure from ideal mixing. 30 The critical parameters, VLE behavior, and p–h diagram are very essential for the performance evaluation of vapor-compression heat pump cycles and are provided in detail.
Figure 1 shows the critical temperature and critical pressure of the four HFC/HC blends under compositions based on our calculation. As the HC mass fraction increases, the critical temperature first decreases and then increases for all the blends. The critical pressure behaviors quite differently. As the HC mass fraction increases, it first increases and then decreases and finally increases for R134a/R290 and R134a/R1270, while it first decreases and then increases and finally decreases for R134a/R600 and R134a/R600a.

The critical parameters of HFC/HC blends under different HC mass fractions: (a) critical temperature and (b) critical pressure.
Figure 2 shows the VLE behaviors of the four HFC/HC blends under different temperatures based on our calculation. It is obvious that each blend has an azeotropic or near-azeotropic behavior at a certain composition. An azeotropic behavior means that the bulb-point (boiling-point) and dew-point (condensing-point) overlap, as indicated by the intersection point of the liquid line and vapor line. R134a/R290 shows an azeotropic behavior at an R290 mass fraction around 0.40. R134a/R600 shows an azeotropic or near-azeotropic behavior at an R600 mass fraction from 0.0 to 0.12 and then undergoes non-azeotropic processes at R600 mass fractions above 0.12. The large deviations between the dew-point pressure and bulb-point pressure correspond to large temperature glides during the phase-change processes occurred in the evaporator and condenser of heat pumps. R134a/R600a shows an azeotropic behavior at an R290 mass fraction around 0.20. R134a/R1270 shows an azeotropic or near-azeotropic behavior at an R600 mass fraction from 0.55 to 1.0, while undergoing non-azeotropic processes at R1270 mass fractions below 0.55.

The VLE behaviors of HFC/HC blends under different HC mass fractions and blend temperatures: (a) R134a/R290, (b) R134a/R600, (c) R134a/R600a, and (d) R134a/R1270.
The advantage of azeotropic or near-azeotropic behavior is that the blend refrigerant acts like a pure refrigerant, which is good for drop-in replacements or systems with minor modifications. 5 The advantage of the non-azeotropic behavior is that the temperature glide well matches the temperature profile of external fluid or air, which is beneficial to reduce the heat exchange irreversibility.
Figure 3 shows the p–h diagrams of the four HFC/HC blends under different compositions based on our calculation. Several important characteristics, including latent heat and saturated liquid line slope, can be observed. Under given pressures, it is seen that the latent heat increases as the HC mass fraction (as indicated on the curves) increases. R134a/R290 and R134a/1270 have higher latent heat (enthalpy difference, that is, the horizontal distance between the liquid line and vapor line) compared to R134a/R600 and R134a/600a under the same pressure.
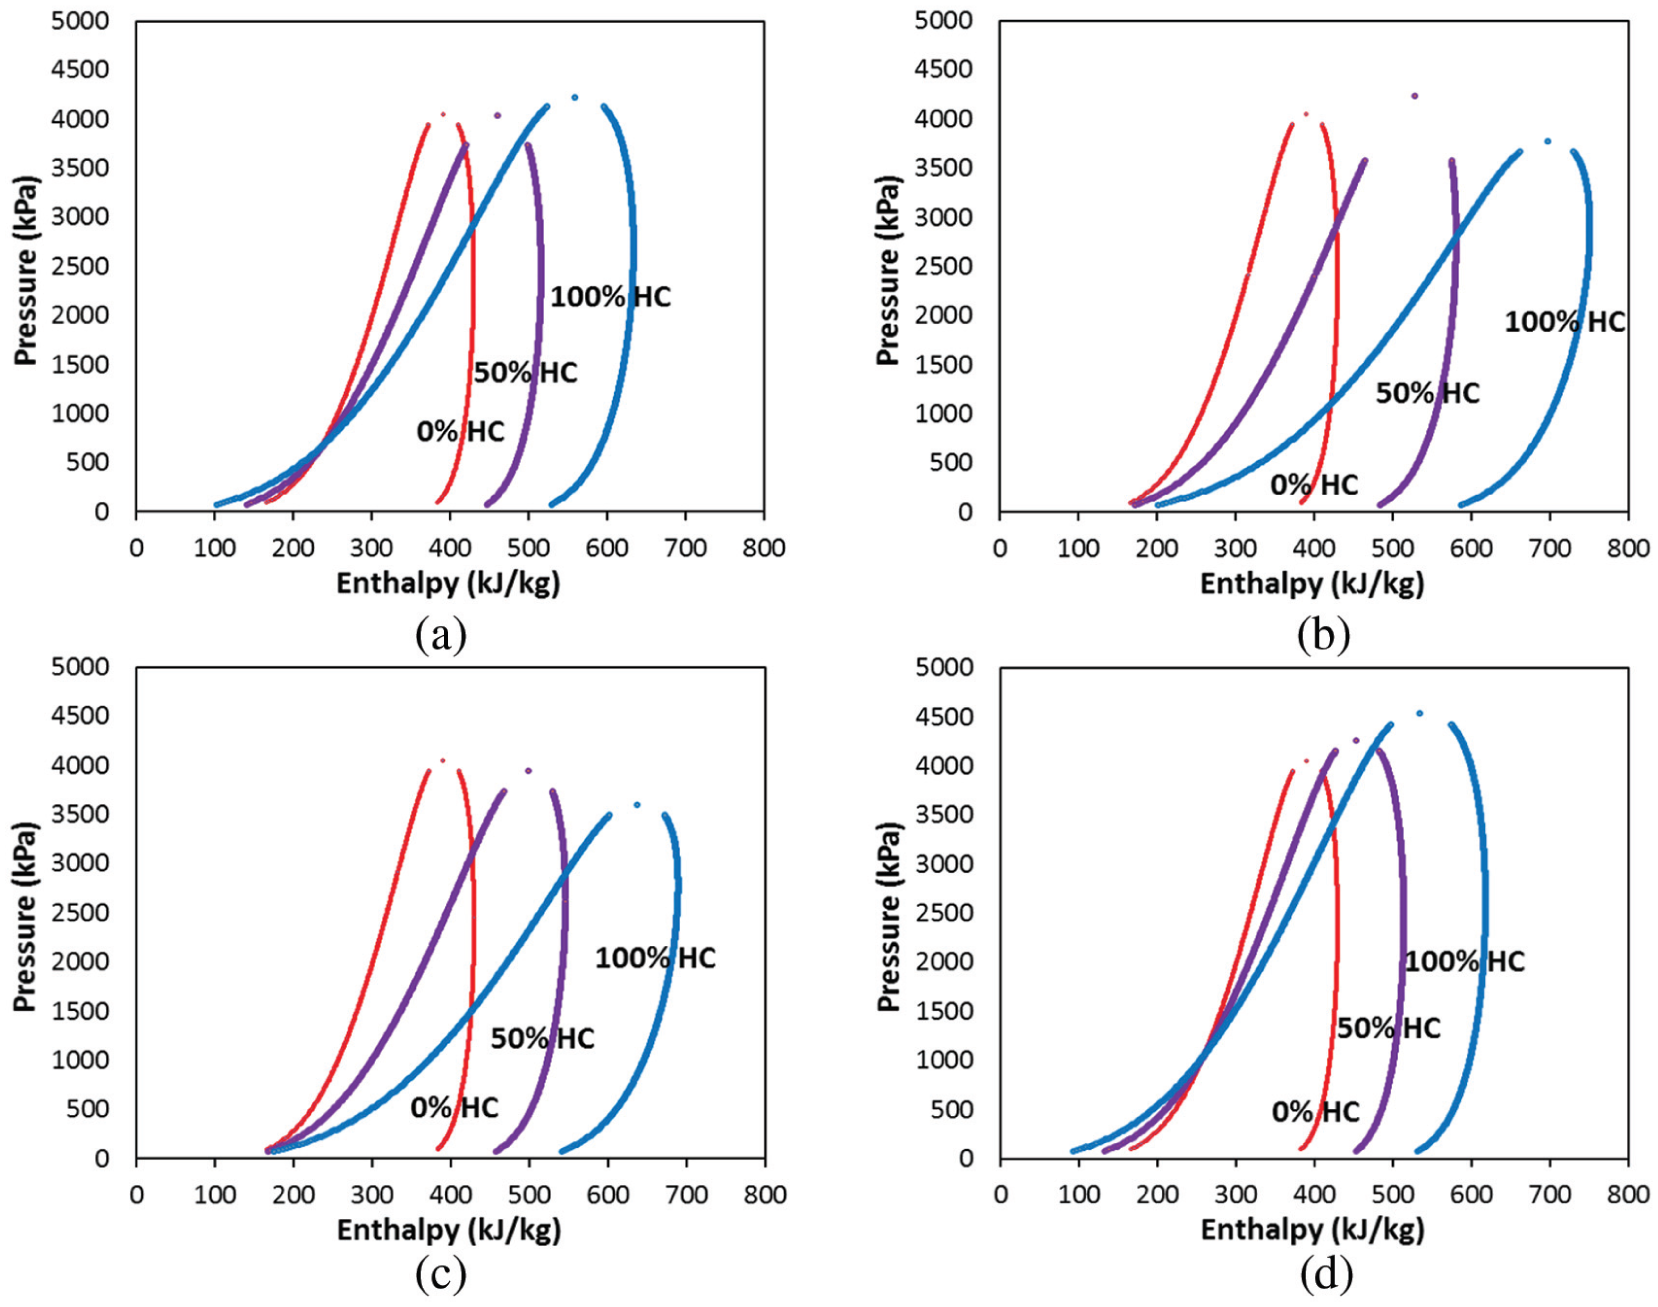
The p–h diagrams of HFC/HC blends under different HC mass fractions: (a) R134a/R290, (b) R134a/R600, (c) R134a/R600a, and (d) R134a/R1270.
The saturated liquid line slope is important because it determines the vapor quality after the throttling process. A steeper saturated liquid line contributes to a lower vapor quality after throttling and thus a higher vaporization heat in the evaporator, which can improve the cooling capacity. Figure 3 indicates that R134a/R290 and R134a/1270 have steeper saturated liquid lines compared to R134a/R600 and R134a/600a.
Thermodynamic model
Figure 4 shows the schematic diagram and the p–h diagram of a typical vapor-compression heat pump cycle. The two-phase refrigerant (1) evaporates in the evaporator to produce cooling effect, turning into saturated vapor (2) and superheated vapor (3). The superheated refrigerant enters the compressor and is compressed to high-pressure superheated vapor (4). It is then discharged into the condenser to produce heating effect, turning into saturated vapor (5), saturated liquid (6), and subcooled liquid (7) in sequence. The subcooled refrigerant is then throttled in the expansion valve, turning into low-pressure two-phase mixture (1).
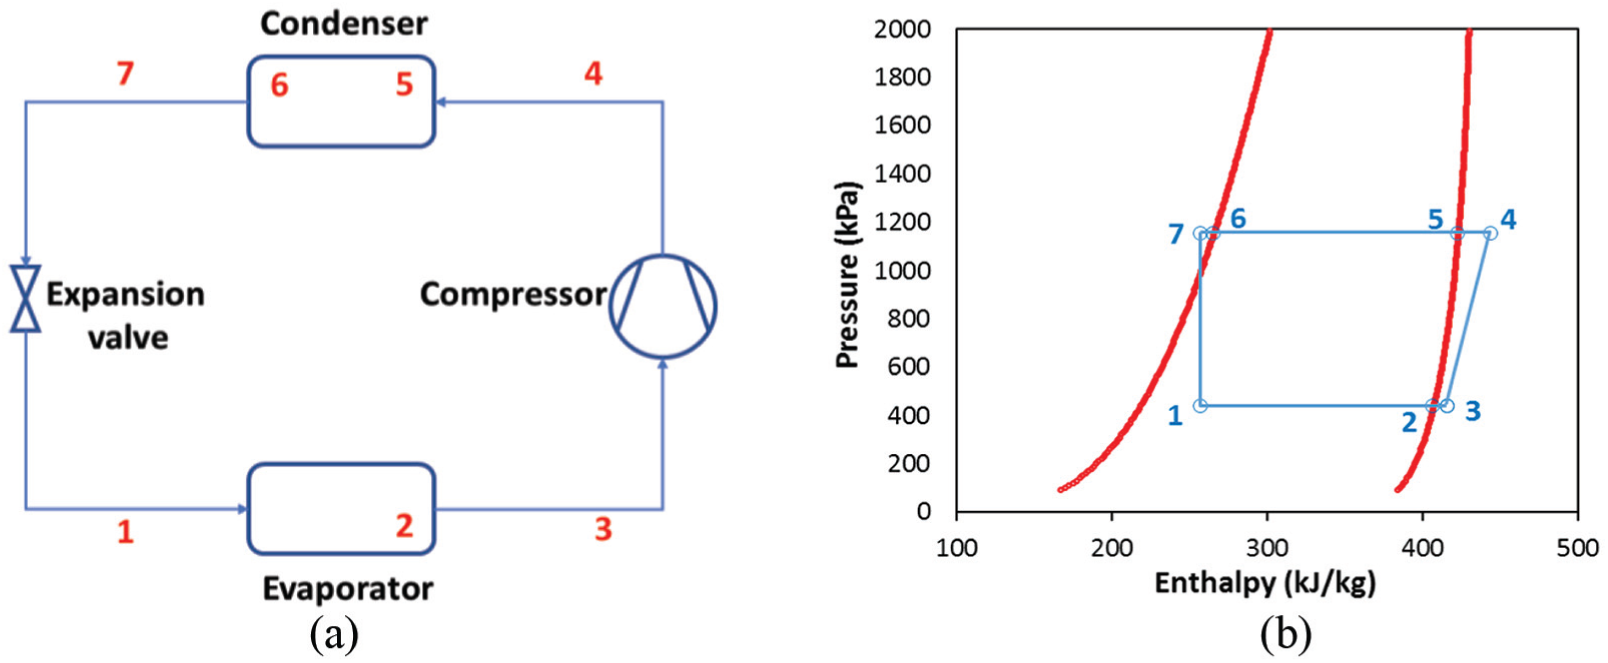
Schematic and p–h diagrams of a typical vapor-compression heat pump cycle for analysis of different refrigerants: (a) schematic diagram and (b) p–h diagram.
Some commonly used assumptions are used for the modeling of this vapor-compression heat pump cycle31,32,33:
The system is in steady state.
The heat loss and pressure drops are ignored.
The compressor isentropic efficiency is fixed.
The superheat and subcooling are specified as constant.
The throttling in the expansion valve is isenthalpic.
These simplifications have been widely used in related studies and are suitable for the comparisons of performance differences solely caused by refrigerants, without the influences caused by heat exchangers and external fluids.
For a given saturated evaporator temperature (Te), point 2 is described as

where T, p, x, and h are the temperature (°C), pressure (kPa), vapor quality (–), and specific enthalpy (kJ/kg), respectively.
With a specified evaporator superheat (ΔTsuperheat), point 3 is described as

where
For a given saturated condenser temperature (Tc), points 5 and 6 are described as


For an isentropic compression process, the ideal state of point 4 is described as

where s is specific entropy (kJ/K) and subscript i denotes ideal.
For an actual compression process with an isentropic efficiency of

With a specified condenser subcooling (ΔTsubcool), point 7 is described as

where
After an isenthalpic throttling process, point 1 is described as

The power consumption of the compressor in both cooling and heating modes is calculated by

where W is the power (kW) and
In cooling mode, the cooling capacity produced in the evaporator is calculated by 32

where Q is the heat load (kW).
The cooling COP of the vapor-compression heat pump is calculated by

The volumetric capacity, which is defined as the capacity per volumetric flow rate at the compressor inlet, is a good index to evaluate the compactness of the heat pump. The cooling volumetric capacity is calculated by

where
As for heating mode, the heating capacity produced in the condenser is calculated by

The heating COP of the vapor-compression heat pump is calculated by

The heating volumetric capacity is calculated by

The refrigerant properties in the above equations are calculated using REFPROP.
30
The standard cooling condition is a heat source temperature of 27°C at the evaporator side and a heat sink temperature of 30°C at the condenser side. Considering a heat exchanger difference of 15°C, the evaporating temperature is Te = 12°C and the condensing temperature is Tc = 45°C. The standard heating condition is a heat source temperature of 7°C at the evaporator side and a heat sink temperature of 20°C at the condenser side. Considering a heat exchanger difference of 15°C, the evaporating temperature is Te = −8°C and the condensing temperature is Tc = 35°C. The compressor isentropic efficiency is taken as
Results and discussions
Based on the blend property method and the heat pump cycle model, the energy performance of the four HFC/HC blend refrigerants are comparatively studied.
Cooling performance
The cooling COPs of different R134a/HC blends with various compositions are presented in Figure 5. First of all, it is observed that blend refrigerants tend to decrease the cooling performance of the pure refrigerants. For each R134a/HC mixture, the cooling COP generally decreases first and increases then.

Cooling COP of different R134a/HC blends with various HC mass fractions.
Second, R134a/R600 and R134a/R600a behave similarly, with a relatively small change of COP within the HC mass fraction of 0.0–0.2 and a dramatic change within the HC mass fraction of 0.2–1.0. On the contrary, the COPs of R134a/R290 and R134a/R1270, which also behave similarly, undergo dramatic changes within the HC mass fraction of 0.0–0.4 and relatively small changes within the HC mass fraction of 0.4–1.0. It is worth noting that these trends are closely related to the VLE behaviors in Figure 2. A large deviation between the dew-point pressure and bulb-point pressure corresponds to a dramatic change of COP, while a small deviation between the dew-point pressure and bulb-point pressure corresponds to a small change of COP.
Third, R134a/R290 and R134a/R1270 perform much better and more stable than 134a/R600 and R134a/R600a. R134a/R600 has the lowest minimum cooling COP while the R134a/R1270 has the highest minimum cooling COP. A major reason is the relatively small deviation between the dew-point pressure and bulb-point pressure for R134a/R290 and R134a/R1270.
Specifically, as the HC mass fraction increases from 0.0 to 1.0, the cooling COP first decreases from 5.45 to 4.15 (at a HC fraction of 0.12) and then increases to 5.34 for R134a/R290; it first decreases from 5.45 to 3.35 (at a HC fraction of 0.58) and then increases to 5.69 for R134a/R600; it first decreases from 5.45 to 3.82 (at a HC fraction of 0.62) and then increases to 5.59 for R134a/R600a; it first decreases from 5.45 to 4.39 (at a HC fraction of 0.14) and then increases to 5.29 for R134a/R1270.
The cooling volumetric capacities, which are used to evaluate the compactness of heat pumps, of different R134a/HC blends with various compositions are presented in Figure 6. For all the four blend refrigerants, the cooling volumetric capacity first increases and then decreases with the HC mass fraction. However, R134a/R290 and R134a/R1270 increase much more and decrease much less compared to R134a/R600 and R134a/R600a, leading to much higher volumetric capacities under higher HC fractions for R134a/R290 and R134a/R1270. This is comprehensively caused by the latent heat, the evaporator inlet vapor quality, and suction density. The latent heat is similar for the four HCs (Table 1), the saturated liquid line slope is steeper for R134a/R290 and R134a/R1270 (Figure 3, leading to lower vapor qualities at evaporator inlet), and the operating pressures are higher for R134a/R290 and R134a/R1270 (Table 1, leading to higher vapor densities at compressor suction port).

Cooling volumetric capacity of different R134a/HC blends with various HC mass fractions.
Specifically, as the HC mass fraction increases from 0.0 to 1.0, the cooling volumetric capacity first increases from 3.13 to 4.60 MJ/m3 (at a HC fraction of 0.40) and then decreases to 3.97 MJ/m3 for R134a/R290; it increases from 3.13 to 3.21 MJ/m3 (at a HC fraction of 0.10) and then decreases to 1.24 MJ/m3 for R134a/R600; it increases from 3.13 to 3.35 MJ/m3 (at a HC fraction of 0.18) and then decreases to 1.67 MJ/m3 for R134a/R600a; it increases from 3.13 to 4.84 MJ/m3 (at a HC fraction of 0.64) and then decreases to 4.75 MJ/m3 for R134a/R1270. Due to larger cooling volumetric capacities, R134a/R290 and R134a/R1270 can greatly reduce the required compressor size of pure R134a, while R134a/R600 and R134a/R600a will greatly increase the required compressor size of pure R134a.
The condensing temperature have an important influence on the cooling performance of heat pump cycles. The cooling COPs of different R134a/HC blends with various condensing temperatures are presented in Figure 7. For each R134a/HC blend, a lower condensing temperature leads to a higher cooling COP. The COP behaves similarly for each condensing temperature but fluctuates slightly more under a lower condensing temperature.

Cooling COP of different R134a/HC blends under various HC mass fractions and condensing temperatures: (a) R134a/R290, (b) R134a/R600, (c) R134a/R600a, and (d) R134a/R1270.
Heating performance
The heating COPs of different R134a/HC blends with various compositions are presented in Figure 8. The heating COPs have similar trends compared to the cooling COPs, but with much smaller changes. For each R134a/HC mixture, the heating COP generally decreases first and increases then. R134a/R290 and R134a/R1270 perform much better and more stable than 134a/R600 and R134a/600a. The heating COPs of R134a/R600 and R134a/R600a have dramatic changes within the HC mass fraction of 0.2–1.0, while those of R134a/R290 and R134a/R1270 have dramatic changes within the HC mass fraction of 0.0–0.4.

Heating COP of different R134a/HC blends with various HC mass fractions.
Specifically, as the HC mass fraction increases from 0.0 to 1.0, the heating COP first decreases from 4.79 to 3.95 (at a HC fraction of 0.14) and then increases to 4.74 for R134a/R290; it first decreases from 4.79 to 3.53 (at a HC fraction of 0.56) and then increases to 4.93 for R134a/R600; it first decreases from 4.79 to 3.82 (at a HC fraction of 0.60) and then increases to 4.86 for R134a/R600a; it first decreases from 4.79 to 4.10 (at a HC fraction of 0.14) and then increases to 4.73 for R134a/R1270.
The heating volumetric capacities of different R134a/HC blends with various compositions are presented in Figure 9. For all the four blend refrigerants, the heating volumetric capacity first increases and then decreases with the HC mass fraction. However, R134a/R290 and R134a/R1270 have much higher volumetric capacities under higher HC fractions, as compared to R134a/R600 and R134a/R600a.

Heating volumetric capacity of different R134a/HC blends with various HC mass fractions.
Specifically, as the HC mass fraction increases from 0.0 to 1.0, the heating volumetric capacity first increases from 2.02 to 3.36 MJ/m3 (at a HC fraction of 0.42) and then decreases to 2.88 MJ/m3 for R134a/R290; it increases from 2.02 to 2.13 MJ/m3 (at a HC fraction of 0.12) and then decreases to 0.76 MJ/m3 for R134a/R600; it increases from 2.02 to 2.26 MJ/m3 (at a HC fraction of 0.20) and then decreases to 1.08 MJ/m3 for R134a/R600a; it increases from 2.02 to 3.56 MJ/m3 (at a HC fraction of 0.70) and then decreases to 3.51 MJ/m3 for R134a/R1270. The larger heating volumetric capacities of R134a/R290 and R134a/R1270 can greatly reduce the required compressor size of pure R134a in heating mode.
The evaporating temperature has an important influence on the heating performance of heat pump cycles. The heating COPs of different R134a/HC blends with various evaporating temperatures are presented in Figure 10. For each R134a/HC blend, a higher evaporating temperature leads to a higher heating COP. The COP behaves similarly for each evaporating temperature but fluctuates slightly more under a higher evaporating temperature.
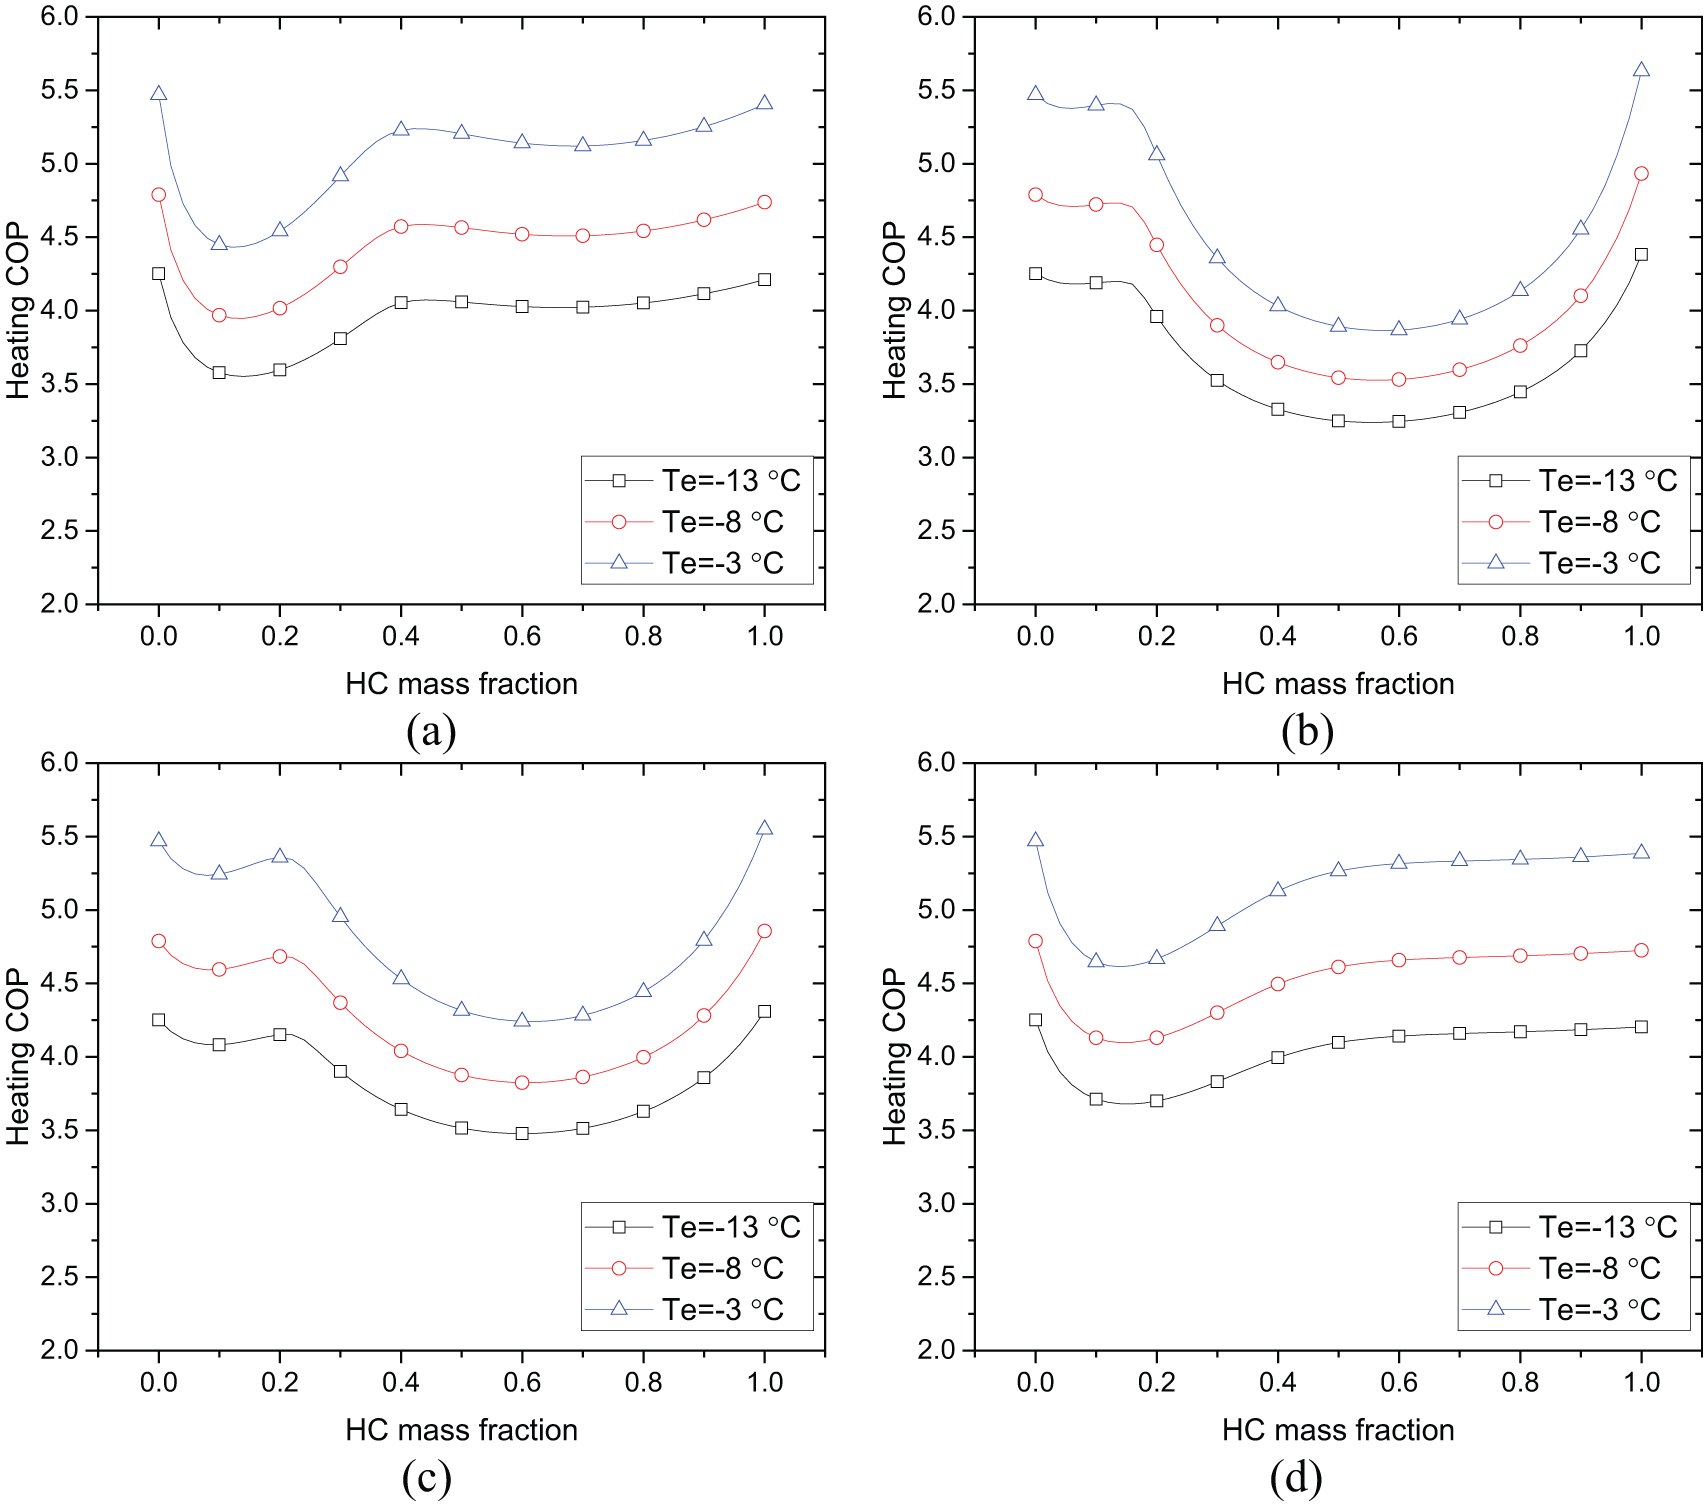
Heating COP of different R134a/HC blends under various HC mass fractions and evaporating temperatures: (a) R134a/R290, (b) R134a/R600, (c) R134a/R600a, and (d) R134a/R1270.
Discussions
Besides the COP and volumetric capacity, the compressor discharge temperatures in cooling and heating modes under different compositions are presented in Figure 11. For each HFC/HC blend, the discharge temperature peaks at a certain HC mass fraction. In both cooling and heating modes, R134a/R600 and R134a/R600a have lower discharge temperatures within the HC fraction of 0.0–0.2, while R134a/R290 and R134a/R1270 have lower discharge temperatures within the HC fraction of 0.4–0.9. Nevertheless, the discharge temperatures are not high for all the HFC/HC blends, kept in the range of 49.0°C–72.3°C in cooling mode and 43.0°C–67.9°C in heating mode.
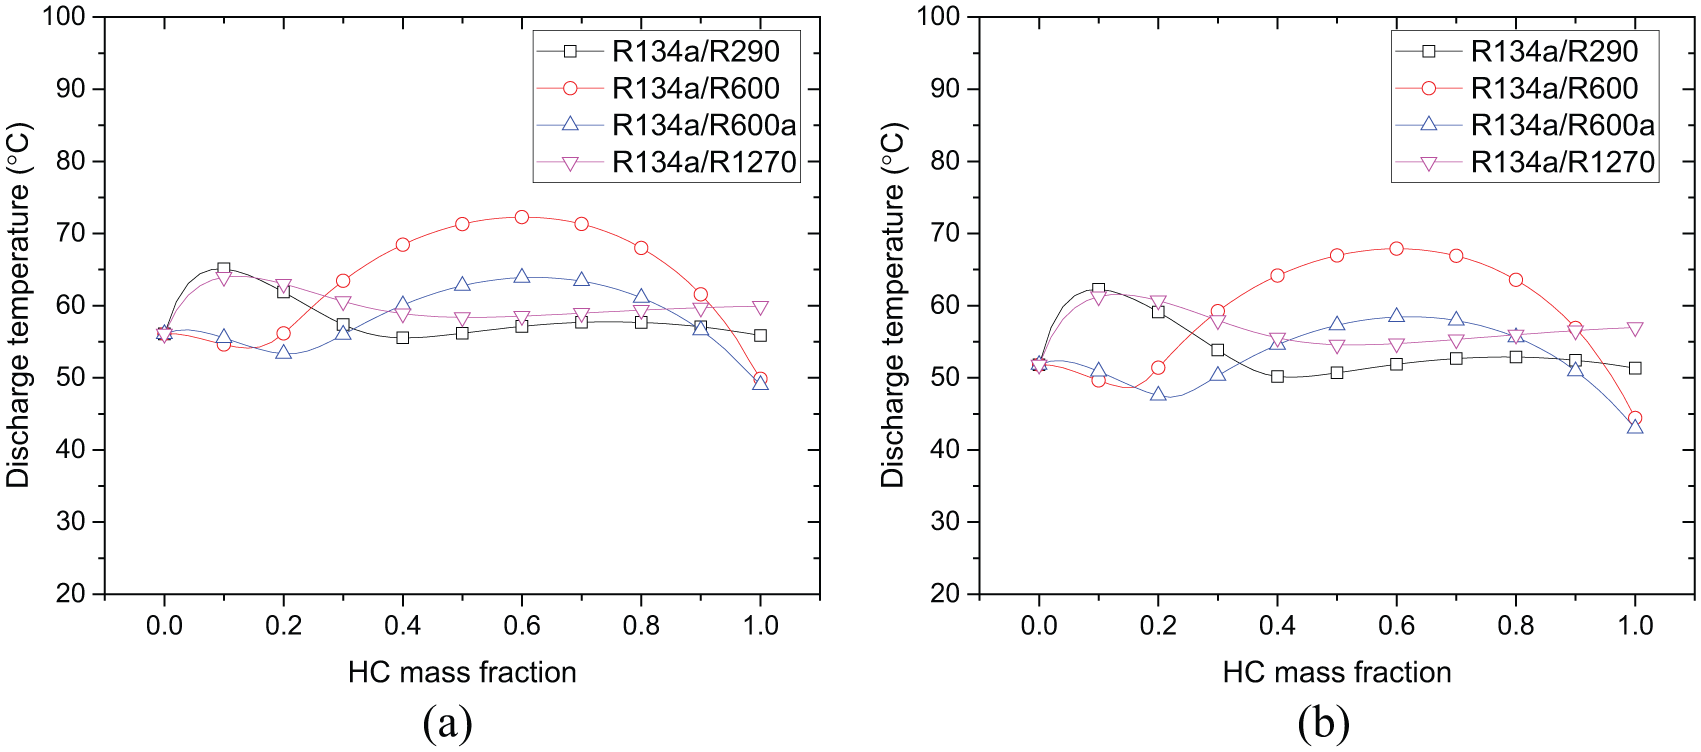
Effect of HC mass fraction on the compressor discharge temperatures of various R134a/HC blends: (a) cooling mode (Te = 12°C, Tc = 45°C) and (b) heating mode (Te = −8°C, Tc = 35°C).
In addition, the GWPs of blend refrigerants are also determined by the compositions. Using the linear weighted sum method, 33 assuming that the mixture-refrigerant GWP is proportional to the pure refrigerant GWPs and mass fractions, the blend GWPs with various HC fractions are estimated in Figure 12. The GWP upper limit of 150 is used as a threshold for a low GWP refrigerant, because refrigerants with GWP higher than 150 are banned in mobile air conditioners in European market since 2011. Since the four HCs have quite similar GWP values, their HFC/HC blends also yield similar GWP values. Because of the high GWP value of R134a, the HC mass fraction needs to be greater than 0.9 so as to obtain low GWP R134a/HC blend refrigerants.

Effect of HC mass fraction on the GWPs of various R134a/HC blends.
With a low GWP HC mass fraction of 0.9 under the basic condition, the COP is 5.12 (R134a/R290), 4.25 (R134a/R600), 4.56 (R134a/R600a), and 5.25 (R134a/R1270) in cooling mode (Te = 12°C, Tc = 45°C), and 4.62 (R134a/R290), 4.10 (R134a/R600), 4.28 (R134a/R600a), and 4.70 (R134a/R1270) in heating mode (Te = −8°C, Tc = 35°C). As for the volumetric capacity, it is respectively 4.04, 1.28, 1.73, and 4.78 MJ/m3 in cooling mode, and 2.95, 0.83, 1.16, and 3.53 MJ/m3 in heating mode. It can be concluded that R134a/R290 and R134a/R1270 perform much better than R134a/R600 and R134a/R600a at the low GWP composition, in terms of both COP and volumetric capacity.
Conclusion
Aiming to mitigate the global warming and ozone depletion problems, it is significant to explore environmentally friendly refrigerant substitutes with low GWP and zero ODP. HFC/HC blend refrigerants have been proposed to decrease the flammability of HCs while reducing the GWP values of HFCs. In this article, four HFC/HC blends (R134a/R290, R134a/R600, R134a/R600a, and R134a/R1270) with various compositions are applied in vapor-compression heat pump cycles. The influences of HC mass fraction on the blend properties and cycle performance are compared for different blend refrigerants. The following conclusions are obtained:
The HC mass fraction greatly affects the critical temperature, critical pressure, and latent heat of the investigated HFC/HC blends. R134a/R290 and R134a/1270 have higher latent heats compared to R134a/R600 and R134a/600a, while R134a/R290 and R134a/1270 have steeper saturated liquid lines.
Each blend has an azeotropic or near-azeotropic behavior at a certain HC composition. The composition is around 0.40 for R134a/R290, in the range of 0.0–0.12 for R134a/R600, around 0.20 for R134a/R600a, and in the range of 0.55–1.0 for R134a/R1270.
For each R134a/HC blend, both the cooling and heating COPs generally first decrease and then increase with the HC mass fraction. There are dramatic changes within the HC mass fraction of 0.2–1.0 for R134a/R600 and R134a/R600a, while within the fraction of 0.0–0.4 for R134a/R290 and R134a. Lower condensing or higher evaporating temperatures contribute to higher COPs.
For each R134a/HC blend, both the cooling and heating volumetric capacities first increase and then decrease with the HC mass fraction. R134a/R290 and R134a/R1270 show much higher volumetric capacities as compared to R134a/R600 and R134a/R600a under higher HC fractions, which can greatly reduce the required compressor size of pure R134a.
R134a/R600 and R134a/R600a have lower discharge temperatures within the HC fraction of 0.0–0.2, while R134a/R290 and R134a/R1270 have lower discharge temperatures within the HC fraction of 0.4–0.9; the discharge temperatures are kept in the range of 43.0°C–72.3°C.
Because of the high GWP of R134a, the HC mass fraction needs to be greater than 0.9 so as to obtain low GWP R134a/HC blend refrigerants. R134a/R290 and R134a/R1270 perform much better than R134a/R600 and R134a/R600a at the low GWP composition, in terms of both COP and volumetric capacity.
This study could contribute to the determination of HFC/HC compositions based on comprehensive considerations of cycle efficiency, volumetric capacity, and low GWP target.
Footnotes
Appendix 1
Acknowledgements
The authors acknowledged the support from Building Energy Saving and Green Building Testing Center lab with funding No.18140206B in Tangshan University.
Handling Editor: Mohammad Reza Salimpour
Declaration of conflicting interests
The author(s) declared no potential conflicts of interest with respect to the research, authorship, and/or publication of this article.
Funding
The author(s) disclosed receipt of the following financial support for the research, authorship, and/or publication of this article: The authors received financial support with No. 18140206B from Building Energy Saving and Green Building Testing Center lab in Tangshan University.