
Abstract
The drilling riser is an important piece of equipment used to link the subsea wellhead with the drilling platform. Its operating environment is extremely complex because of the effects of ocean currents, which can cause riser overload, fatigue, leading to economic loss. Therefore, in order to improve design and prevent premature failure of drilling riser, it is important to research the mechanical response to ocean currents. The effects of tension ratio and platform deflection on the lateral displacement, bending moment, and the stress of the drilling riser are analyzed, under actual working conditions and shear flow. The results show that the bending moment and lateral displacement of the drilling riser decrease significantly and the stress of the riser increases with increasing tension ratio. There is an increase in the lateral displacement of the drilling riser and the bending moment at the lower end of the drilling riser, with an increase in the initial offset of the offshore drilling platform. However, the initial offset of the offshore drilling platform has little effect on the stress of the riser. Under shear flow conditions, the lateral displacement, bending moment, and stress initially increase, then decrease, and finally stabilize. These results can be used to improve the design of drilling riser.
Introduction
The drilling industry has gradually shifted marine oil and gas development from the continental shelf to deep water and ultra-deep water (sea depth ≥ 500 m). The marine drilling riser, which connects the seafloor wellhead to the offshore drilling platform, is a key piece of equipment in marine exploration and development. Its main role is isolating seawater, guiding drilling tools, and recycling drilling fluid. 1 The loads on the drilling riser are very complex because of the influence of ocean currents and drilling platform drift. Under these conditions, the deformation, stress, and bending moment are often large. 2 During operation, if the deformation, stress, or bending moment of the riser exceeds the design value, the result may be riser failure, interruption of the operation, and economic loss. 3 Many undesirable phenomena can occur during the operation of a drilling riser.4,5 Therefore, research into the dynamic response of the drilling riser is vital.
A great deal of research has been done on mechanical characteristics of deep-water risers. The majority of articles have focused on the static and dynamic mechanical properties of drilling risers. In an analysis of the static mechanical properties of marine risers, Chucheepsakul et al. 6 developed a large strain analysis formula for flexible marine pipelines, in Cartesian and natural coordinate systems, based on virtual work methods and vector methods. Pereira et al. 7 simulated the influence of buoyancy on the mechanical behavior of a drilling riser and showed that the subsurface buoyancy significantly influenced the riser dynamics. How et al. 8 used the boundary control method to actively control the angle and reduce the forced vibration of a flexible marine riser, under a distributed load that varied with time. Athisakul et al. 9 conducted a two-dimensional, large strain static analysis of marine risers, using a variational approach. Passano and Maincon 10 proposed an efficient and high-precision method to estimate the extreme corresponding distribution rules of risers, including selective nonlinear finite element (FE) simulations of relevant sea states. Wang and Xiao 11 investigated the vortex-induced vibration of a vertical riser, subjected to linear and uniform shear currents, and compared their results with tests done by Exxon Mobil at the Norwegian Marine Technology Research Institute (MARINTEK). To control the nonlinear dynamics, a riser with uniform cross flow and geometric nonlinearities was studied by Yang et al. 12 Despite the fact that real ocean currents are shear flows, the majority of these studies approximated ocean currents as uniform flow. The loads used in these models are inconsistent with actual conditions, leading to a distortion of the mechanical response of the drilling riser and loss of practical significance.
Using a mechanical model with drilling platform displacement and riser lift height included, Liu et al. 13 analyzed the bending moment and stress of a deep-water drilling riser. Wang et al. 14 created a dynamic model to analyze the lateral vibration of a marine riser during installation and investigated the maximum lateral vibration displacement variations with wave height and wave period. Yang and Xiao 15 studied the nonlinear dynamics of a top-tensioned riser under multi-frequency parametric excitations, where the current velocity is assumed to be uniform from the bottom to the surface. Connaire et al. 16 proposed a method that could improve how existing risers are analyzed, based on the convection coordinates method and Euler–Bernoulli theory. Major et al. 17 proposed a control equation for the riser bending response based on the drill string rotation effect and studied the effect of drill string rotation on the response of the riser. Thorsen et al.18,19 performed a nonlinear time domain analysis of cross-flow vortex-induced vibrations with a FE model in which stationary uniform flow and periodic oscillation at the top riser end were included.
In most studies, the drilling riser is assumed to be a linearly elastic structure. Also, the upper end is sometimes considered to be fixed, without displacement. Actual ocean currents are shear flows, but in most studies, the current load is considered uniform. 20 In many models, the loads acting on the simulated riser are inconsistent with the actual conditions, leading to distorted results and loss of real-world applicability. Therefore, understanding the mechanical response of the risers under shear flow conditions is important in practical engineering. In this work, a mechanical model of a riser was developed for a combination of wave and shear flow current loads, where the upper and lower ends were assumed to be hinged and the effect of drilling fluid was neglected. The FE simulation method was used to analyze the mechanical response to riser tension and the effect of the initial displacement of the platform on the transverse vibration of the riser. In addition, the distribution laws of the bending moment, stress, and lateral displacement of the riser and the related response variation during the process of loading were also analyzed. These results will be useful in the engineering application of marine riser.
Lateral vibration model of the riser
Deep-water drilling systems consist mainly of deep-water drilling platforms, tensioners, riser systems, bottom riser assemblies, blowout preventer units (BOP), wellheads, and conduits. The bottom end of the riser is connected to the BOP stack through the riser assembly and the lower ball joint. The top end of the riser is connected to the drilling platform through the top ball joint. During normal operation, the main riser system loads include the following:21,22 (a) weight of the riser, (b) buoyancy generated by the volume of water drained by the riser and the buoyancy block installed on the riser, (c) top tension generated by the tensioning system connected to the platform, and (d) sea currents and wave forces.
In the numerical investigation, the following assumptions were made: (a) the upper and lower ends of the riser are simplified as hinged constraints, (b) the influence of the drilling fluid and drill pipe on the lateral movement of the riser is neglected, and (c) the buoyancy block has no effect on the stiffness of the riser system or the magnitude of the current force. The deep-water drilling platform riser model is illustrated in Figure 1. The primary reasons for the lateral displacement of the riser system are initial displacement of the drilling platform, horizontal forces, and wave forces. In the model, the origin of the coordinates is set at the bottom of the sea. The x-axis is in the same direction as the wave propagation, and the z-axis is perpendicular to the sea floor.
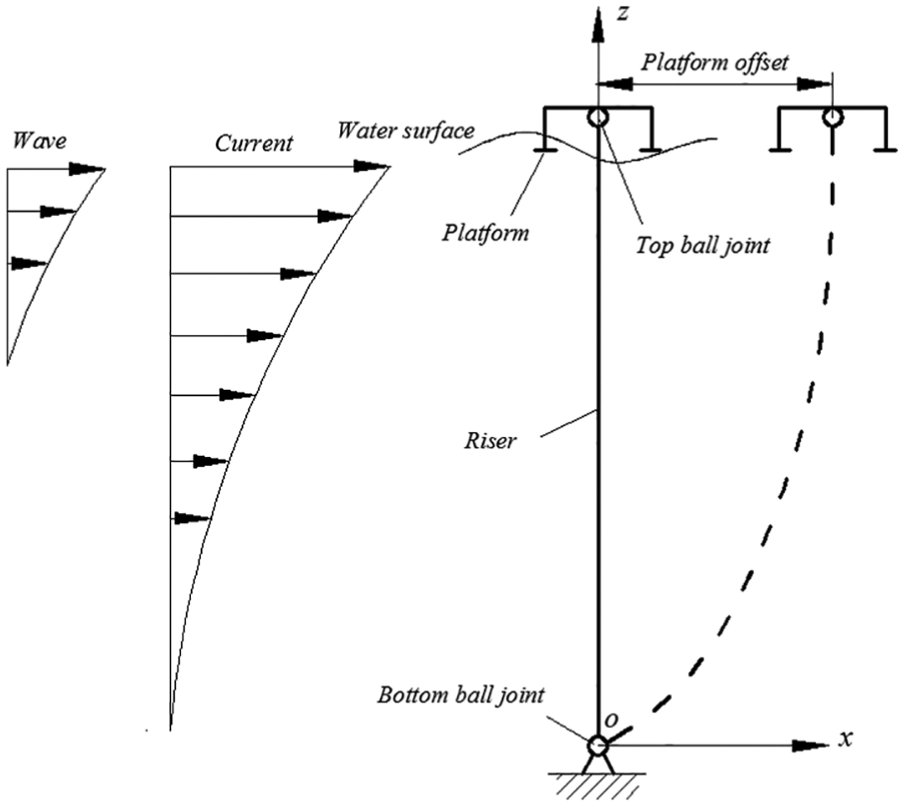
Schematic diagram of the drilling riser system.
Mechanical model of the riser system
For a drilling riser under the action of ocean currents, a quasi-static state and an acceleration of zero are assumed. Treating the riser as a single-span beam under axial force, the fourth-order ordinary differential equation of the riser can be formulated as23,24

where EI is the bending stiffness of the riser, x(z, t) is the lateral displacement of the riser, z is the depth coordinate of the riser, Tz is the arbitrary axial force of the riser, C is the viscous damping coefficient, W is the weight of the unit length riser, and F(z, t) is the horizontal force acting on the unit length of the riser.
The bottom end of the riser is connected to the ball joint on the blowout preventer. Assuming no deformation occurs on the blowout preventer and the components below, the displacement of the lower end equals zero and the bending moment at the ball joint also equals zero. The top end of the riser is connected to the rig through the top ball joint, and the x-axis moves as the rig moves. The boundary conditions at the bottom and top ends of the riser are specified as follows:
1. The lower boundary condition can be written as

where Ka is the rotational stiffness of the lower flexible joint.
2. The upper boundary condition can be written as
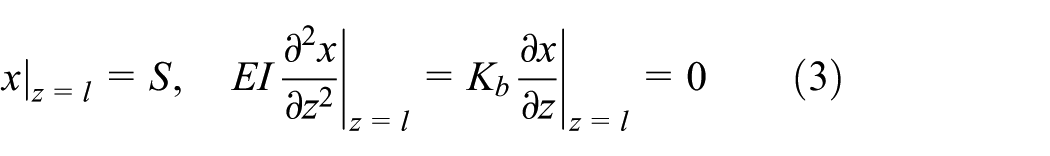
where l is the distance from the top of the riser to the bottom of the sea, S is the lateral displacement of the platform, and Kb is the rotational stiffness of the upper joint of the riser.
Equation (4) is a typical control equation for a drilling riser, which can be solved by the FE method. 25 Using coordinate transformation and matrix assembly, equation (1) can be transformed to equation (4) and written as

where [M] denotes the mass, [C] is the viscous damping, [K] is the stiffness, {u″} is the acceleration vector of the element, {u′} is the velocity of the element, {u} is the element displacement, {f(t)} is the external load of the element, and t is the time.
Calculation of the ocean current loads
Seawater velocity distribution
The velocity of the ocean current is similar to a shear flow that decreases approximately linearly with increasing depth of water. Therefore, the currents are approximated as shear flows. Seawater shear flow profiles can be expressed as 26

where Uz is the speed of the ocean current at a certain depth, v0 is the velocity of the ocean current at the bottom end of the riser, B is the slope of the flow profile, and z is the distance between a certain element and the bottom ball hinge

where Uzmax is the maximum flow rate of seawater, Uzmin is the minimum flow rate of seawater (Uzmin = v0), and L is the riser length.
Wave flow calculation
The horizontal flow force applied on the per unit length riser is equal to

where f1 is the lateral force caused by the current and f2 is the lateral force caused by waves
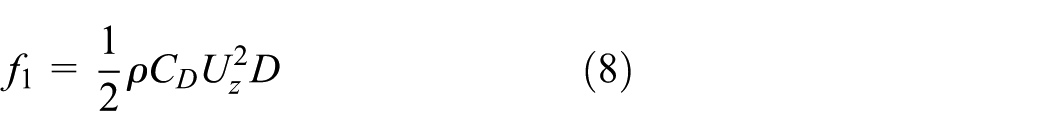
where ρ is the seawater density, CD is the coefficient of resistance with values of 0.4–1.6, and D is the outer diameter of the riser.
From Morison’s formula


where vz is the wave velocity, CM is the coefficient of inertia force with the values of 0.93–2.30, H is the wave height, T is the wave period, L is the wavelength, k is the wave number with k = 2π/L, d is the depth of water, and ω is the wave circle frequency with ω = 2π/T.
FE model of the riser
Calibration of the model
The drilling riser dynamics were studied by conducting FE simulations with the ABAQUS program 27 to validate the FE model of the riser, and results were compared with a vibration test of a riser made of polyvinyl (PVC) pipe performed by Mao et al. 25 at Shanghai Jiaotong University. The parameters used in the numerical model were consistent with those used in the experiments conducted by Mao et al. 25 The FE simulation model of the riser is shown in Figure 2. The riser was presented as a simple beam with hinged branches at the top and bottom ends, and the load acting on the riser was applied according to the reference data. The riser length in the FE model was 8 m because this was the pipe length used in the test. The flow chart of the model solution process is presented in Figure 3. A comparison of the results of the numerical model with the experimental and analytical results of Mao et al. 25 is shown in Figure 4. The results are in good agreement.
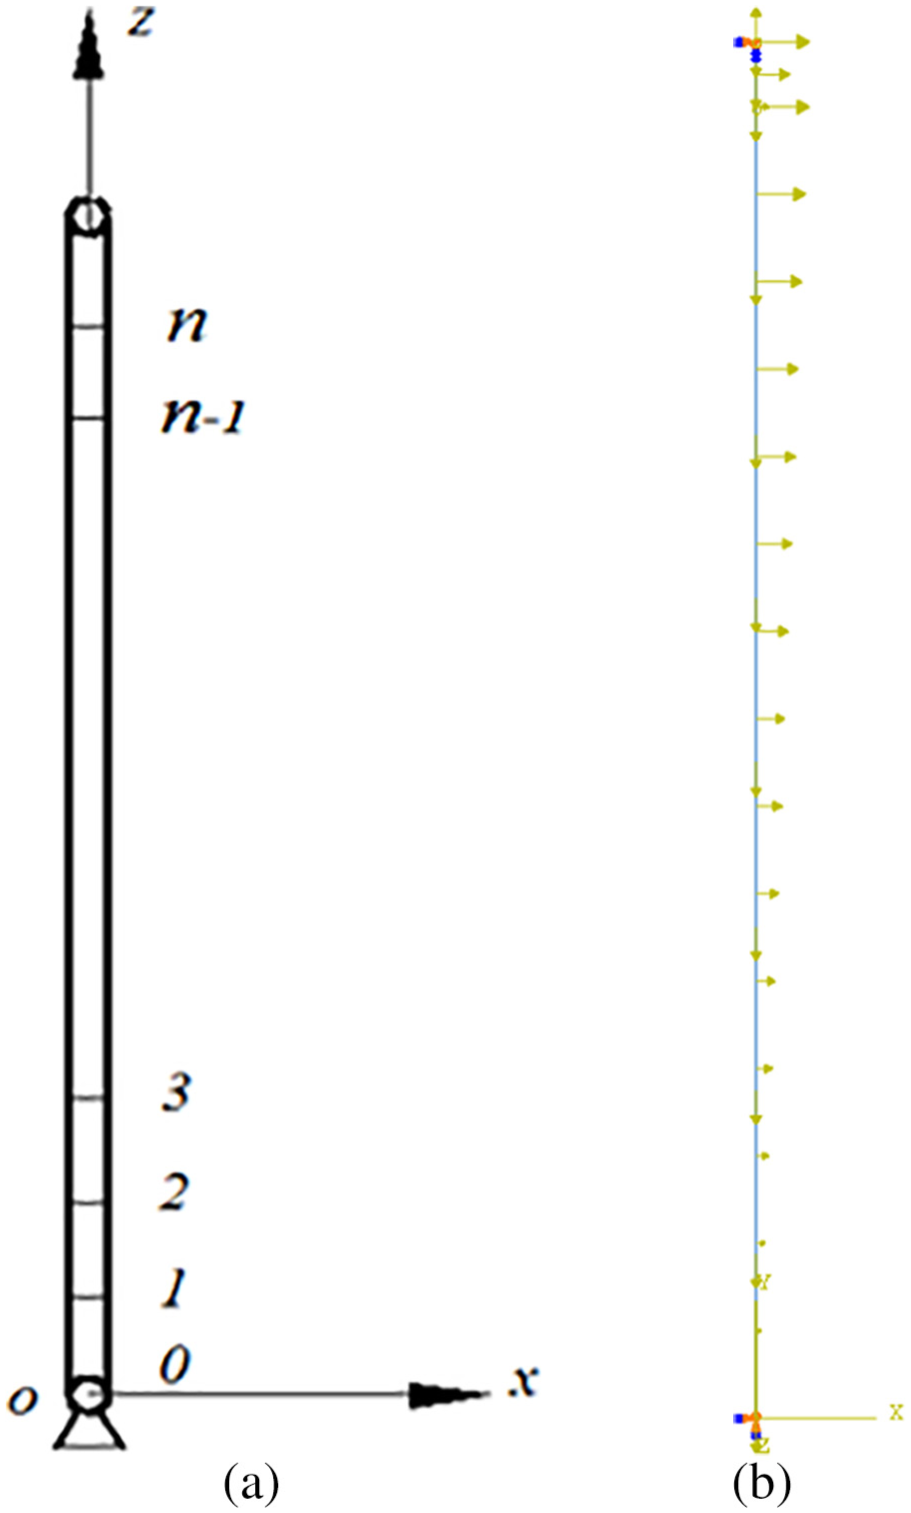
Numerical model of the drilling riser: (a) schematic diagram and (b) FE model.

Flow chart of the model solution process.

Comparison of simulation and experimental results for drilling riser dynamics.
Model parameters for the case study
Once the FE model was verified, a new model with a riser length of 1000 m was formulated to study the dynamic response of the drilling riser in an area of the South China Sea. The parameters of the riser used in the study are shown in Table 1. In the field, the size of the riser varies with the depth of the water. However, to simplify the calculation, the riser was assumed to be uniform in size. The upper and lower ends of the riser were simplified as hinged constraints. A dynamic explicit solver was used, and the elements of the drilling riser are the beam element B31. The damping coefficient of the riser wave system was taken as 5. 8 The main components of the ocean load on the riser were currents and waves. The surface velocity of seawater, under normal drilling conditions in the South China Sea area, is about 0.93 m/s. The relevant parameters for waves in the South China Sea are shown in Table 1. 28
Parameters of the deep-water drilling riser.

Results and discussions
Previous research has demonstrated that the top tension and initial displacement of the platform significantly influence the lateral vibration of a riser. In this work, the distribution of the lateral displacement, bending moment, and stress were investigated for a drilling riser, from the upper flex joint to the seabed. In the analysis, the top tension of the riser was 1.1F, 1.3F, 1.5F, and 1.7 F, where F denotes the buoyancy of the riser, and the initial offset of the platform was 0, 15, 30, and 45 m. The riser was subjected to dynamic instability under the combined action of wind, wave, and ocean current loads, so the mechanical properties of the riser varied over time. 29 The time history of the riser dynamic response, in the ocean loading process, is analyzed and discussed.
Effect of top tension on the mechanical response of the riser
Figure 5 shows the distribution of lateral displacement of the riser for different top tensions (1.1F, 1.3F, 1.5F, and 1.7 F) when the initial displacement of the drilling platform is 0 m. The lateral displacement of the riser decreases as the top tension increases: the maximum lateral displacement of the riser gradually decreases from 20.0 to 11.6 m. It may seem that, to control the lateral displacement of a riser, higher top tension is better. However, excessive top tension can cause high stress at the joint between the riser and the tensioner, which could lead to equipment failure. Drilling platforms are engineered so that the top tension of the riser can be adjusted, to reduce the lateral displacement amplitude of the riser.

Lateral displacement of the riser for different top tensions (1.1F, 1.3F, 1.5F, and 1.7 F).
Figure 6 shows the distribution of the bending moment of the riser for different top tensions (1.1F, 1.3F, 1.5F, and 1.7F). In each case, the bending moment of the riser has two maximum points. The first extreme point is about 40 m away from the top ball hinge and the second is about 30 m away from the bottom ball hinge. As the top tension increases, the bending moment of the riser gradually decreases, and the reduction in amplitude at the second extreme point is larger than at that of the first extreme point. A possible reason for this may be that the degree of bending on the lower part of the riser decreases more than on the upper part of the riser, as the top tension increases.
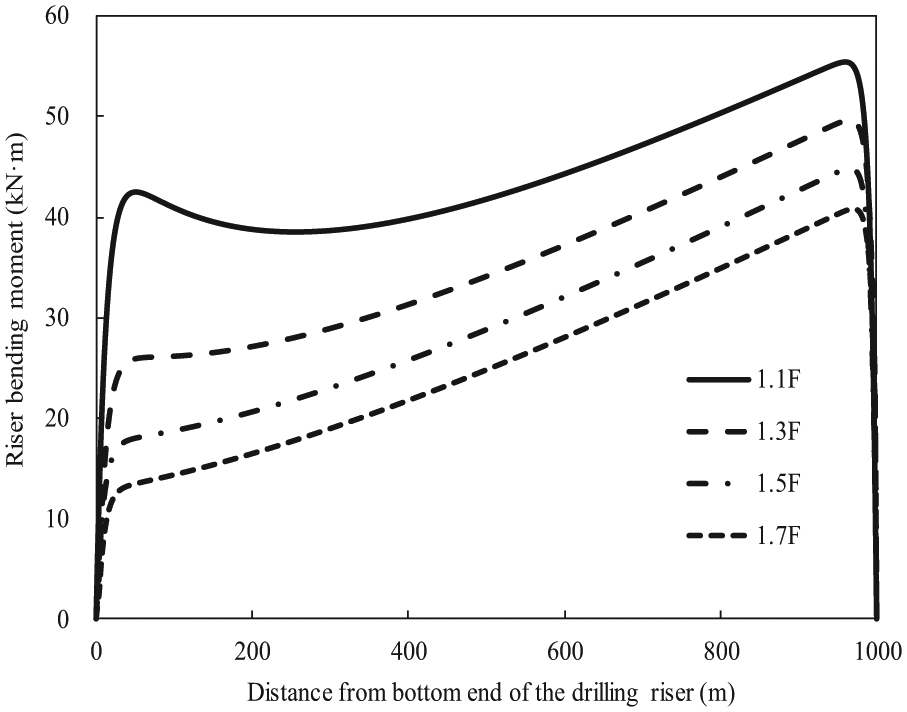
Bending moment of the riser for different top tensions (1.1F, 1.3F, 1.5F, and 1.7F).
Figure 7 shows the distribution of the stress of the riser for different top tensions (1.1F, 1.3F, 1.5F, and 1.7F). The equivalent stress of the riser reaches its maximum at a distance of about 30 m from the top joint, where the riser’s degree of bending is at a maximum. With an increase in the top tension, the maximum value of the stress of the riser increases linearly from about 130 to 190 MPa, because the axial force of the cross-sectional area increases with increasing top tension.
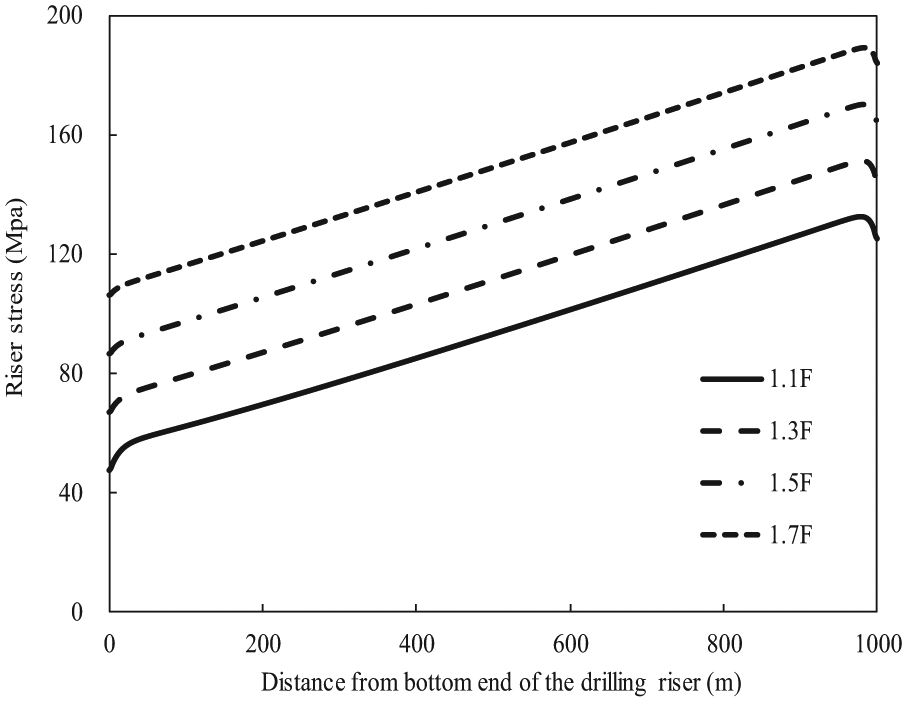
Stress of the riser for different top tensions (1.1F, 1.3F, 1.5F, and 1.7F).
These results demonstrate that it is possible to reduce the maximum lateral displacement and bending moment of the riser by increasing the tension of the riser, within a certain range. However, if the top tension is too large, the riser may be damaged due to excessive stress. Therefore, it is necessary to select a top tension that satisfies the practical operational requirements.
Effect of initial platform displacement on the mechanical response of the riser
A working drilling platform is affected by the combined action of currents, waves, and wind. In addition, offset from the original position will affect the normal operation of the riser. The lateral displacement, bending moment, and stress of the riser, with respect to the initial offset of the platform (0, 15, 30, and 45 m), were investigated, where the top tension was set at 1.3F.
Figure 8 shows the distribution of lateral displacement of the riser, for different initial platform displacements (0, 15, 30, and 45 m). As the initial offset of the platform increases, the maximum lateral displacement of the riser increases from 16.0 to 49.5 m. With an increase in the platform offset, the position where the maximum lateral displacement occurs shifts from a distance of about 480 to 200 m from the sea surface.
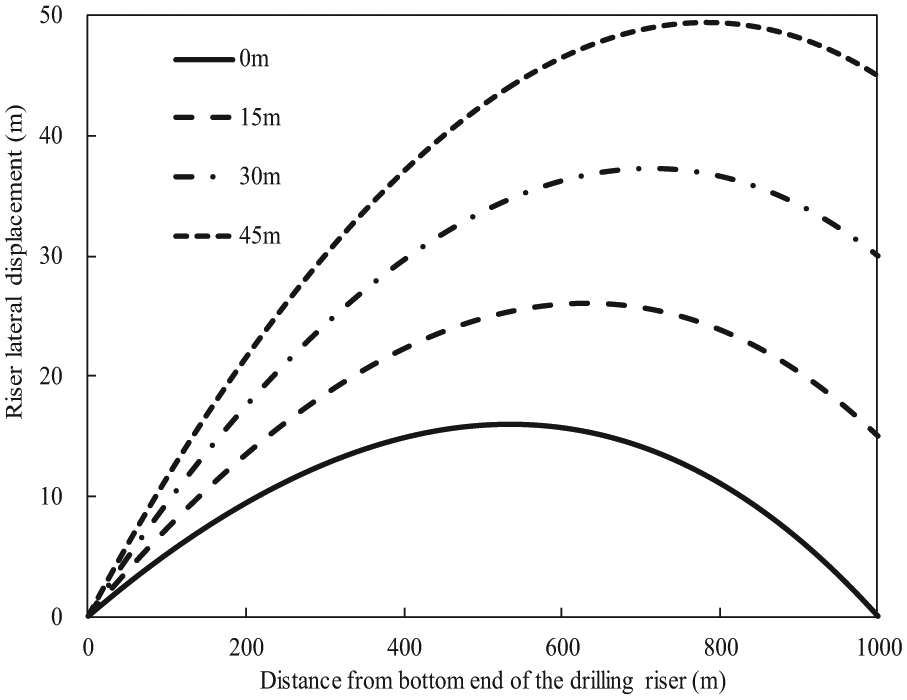
Lateral displacement of the riser for different initial platform displacements (0, 15, 30, and 45 m).
Figure 9 illustrates the distribution of bending moment of the riser for different initial platform displacements (0, 15, 30, and 45 m). There are two bending moment danger points in the riser: the first danger point is 40 m away from the sea surface and the second is 30 m away from the ball joint at the bottom of the sea. With an increase in the initial offset of the platform, the bending moment of the riser tends to increase, but the increment at the bottom of the riser is clearly larger than that at the upper end. As shown in Figure 9, the bending moment at the first danger point increases from 50 to 55 kN·m, an increase of about 10%. The bending moment at the second danger point increases from 24 to 43 kN·m, an increase of about 79%. The reason for this behavior is that the degree of bending of the riser increases as the initial offset of the platform increases, so the increase in the lower curvature of the riser is much greater than the increase in the upper curvature.

Bending moment of the riser for different initial platform displacements (0, 15, 30, and 45 m).
Figure 10 shows the distribution of the stress of the riser for different initial displacements of the riser platform (0, 15, 30, and 45m). These results indicate that the initial offset of the platform has little effect on the stress of the riser.

Stress of the riser for different initial platform displacements (0, 15, 30, and 45 m).
This demonstrates that some initial deflection of the drilling platform, within a certain range, is acceptable. If the initial offset of the platform is too large, however, the riser may be damaged because of a significant increase in the value of the lower bending moment.
Time history analysis of the riser dynamics
Determination of the time history response
We have demonstrated that the riser is in a dynamic and unstable state under the combined action of wind, wave, and ocean current loads. Next, the distribution of lateral displacement, bending moment, and stress of the riser with respect to time were studied. In this analysis, the top tension of the riser was set to 1.3F and the initial offset of the drilling platform was set to 0 m.
The results show that the lateral displacement, bending moment, and stress at any point on the riser gradually increase to the maximum value, then decrease, and finally stabilize during the ocean current loading process. Figures 11–13 illustrate the variation with time of the lateral displacement, bending moment, and stress of the riser for the maximum lateral displacement point, under the action of ocean currents.

Time history of lateral displacement of the riser, for the maximum lateral displacement point.

Time history of maximum bending moment of the riser, for the maximum lateral displacement point.

Time history of stress of the riser, for the maximum lateral displacement point.
Figure 11 shows that the lateral displacement of the riser reaches its maximum at 9.8 s, with a value of 22.6 m. Next, the maximum lateral displacement decreases and then finally stabilizes at 28 s, with a value of 19.6 m. The fluctuation in the lateral displacement of the riser is approximately 15.3% of the final stable value. Figure 12 shows that the maximum value of the bending moment of the riser is 61 kN·m at 12 s, and it stabilizes at 27.6 s, with a value of 49 kN·m. The fluctuation in the bending moment of the riser is approximately 24% of the final stable value. Figure 13 shows that the stress of the riser reaches its maximum of 171.2 MPa at 10.7 s and then stabilizes at a value of 137.5 MPa at 26.9 s. The fluctuation in the stress of the riser is approximately 24.5% of the final value.
Effect of top tension on time history response of riser dynamics
Riser dynamics vary during the ocean current loading process. We demonstrated that the maximum lateral displacement, bending moment, and stress of the riser vary under different top tensions. Therefore, it was also important to investigate how the riser dynamics varied over time, under different top tensions. Figures 14–16 illustrate the time history of the riser dynamics, for different top tensions (1.1F, 1.3F, 1.5F, and 1.7F).

Time history of the maximum lateral displacement of the riser, for different top tensions (1.1F, 1.3F, 1.5F, and 1.7F).

Time history of the maximum bending moment of the riser, for different top tensions (1.1F, 1.3F, 1.5F, and 1.7F).

Time history of the maximum stress of the riser, for different top tensions (1.1F, 1.3F, 1.5F, and 1.7F).
Figure 14 shows how the maximum lateral displacement of the riser varies with time, for different top tensions. The maximum lateral displacement initially increases and then decreases to a stable value. As demonstrated in the previous analysis, both the maximum lateral displacement and the final stable value of the riser gradually decrease, with increasing top tension. As the top tension increases, the fluctuation in the maximum lateral displacement of the riser decreases. This change is largely due to the variation of the ocean current along the axial direction.
Figure 15 shows how the maximum bending moment of the riser varies with time, for different top tensions. The maximum bending moment initially increases, then decreases, and finally stabilizes. As the top tension increases, both the maximum value of the bending moment and the final value decrease. The fluctuation in the value of the maximum bending moment of the riser decreases slightly, as the top tension increases.
Figure 16 shows how the maximum stress of the riser varies with time, for different top tensions. The maximum stress initially increases, then decreases, and finally stabilizes. As the top tension increases, both the maximum stress and the final stress decrease gradually. As the top tension increases, the fluctuation in the maximum stress of the riser increases slightly.
Effect of initial platform displacement on time history response of riser dynamics
We have demonstrated that the riser dynamics vary during the current loading process. Figures 17–19 illustrate the effect of initial platform displacement (0, 15, 30, and 45 m) on riser dynamics over time.

Time history of the maximum lateral displacement of the riser, for different top tensions (0, 15, 30, and 45 m).

Time history of the maximum bending moment of the riser, for different top tensions (0, 15, 30, and 45 m).

Time history of the maximum stress of the riser, for different top tensions (0, 15, 30, and 45 m).
Figure 17 shows how the maximum lateral displacement varies with time, for different platform offsets. The maximum lateral displacement initially increases, then decreases, and finally stabilizes. As the offset increases, both the maximum lateral displacement and the final stable value increase gradually. As the offset increases, the amplitude of the maximum lateral displacement increases slightly.
Figure 18 shows how the maximum bending moment varies with time, for different platform offsets. The bending moment at each offset initially increases, then decreases, and finally stabilizes. As the offset increases, both the maximum bending moment of the riser and the final stable value increase slightly. As the offset increases, the amplitude of the maximum bending moment increases slightly.
Figure 19 shows how the maximum stress varies with time, for different platform offsets. The maximum stress at each platform offset initially increases, then decreases, and finally stabilizes. As the platform offset increases, the maximum stress and the final value are almost constant.
Conclusion
A numerical model of a drilling riser, with a length of 1000 m, was developed to analyze the mechanical response of a riser, under the combined action of currents and waves. The mechanical response of the riser was obtained through analysis of the lateral displacement, stress, and bending moment. Several conclusions can be drawn from the results of these simulations:
The tension ratio is an important indicator for measuring the performance of deep-water drilling risers. As the tension ratio increases, the lateral displacement and the bending moment of the riser decrease significantly. When the tension ratio increases, the decrease in the bending moment of the riser is greatest near the bottom. However, the stress level of the riser increases significantly when the tension ratio increases, displaying a trend opposite to that of the lateral displacement and bending moment.
The initial offset of the platform has a significant effect on the lateral displacement and the bending moment at the bottom. As the initial offset of the platform increases, the lateral displacement and the bending moment of the riser increase significantly. The increase in the bending moment of the riser is greatest near the bottom.
With time, lateral displacement, bending moment, and stress of the riser, for different top tensions and initial platform offsets, initially increase, then decrease, and finally stabilize.
In ocean drilling engineering, it is important to consider the behavior of lateral displacement, bending moment, and stress of the riser with respect to the top tension, for both safety and economic reasons. In drilling operations, the initial offset of the platform should be minimized, to prevent the riser from failing as a result of an excessive bending moment at the bottom. The lateral displacement, bending moment, and stress of marine risers fluctuate under the action of shear flow. Therefore, the influence of ocean currents and waves on riser dynamics should be carefully considered in the design process. In general, the results obtained are in good agreement with existing work.
Footnotes
Handling Editor: MA Hariri-Ardebili
Declaration of conflicting interests
The author(s) declared no potential conflicts of interest with respect to the research, authorship, and/or publication of this article.
Funding
The author(s) disclosed receipt of the following financial support for the research, authorship, and/or publication of this article: This research was supported by the Open Fund of State Key Laboratory of Oil and Gas Reservoir and Exploitation (Southwest Petroleum University, no. PLN 201619), Scientific Research Starting Project of SWPU (no. 2015QHZ011), National Natural Foundation of China (no. 51674214), and Key Research Project of Sichuan Project (no. 2017GZ0365).