
Abstract
In order to classify the quality of corn kernels in an affordable, convenient, and accurate manner, a method based on image analysis and support vector machine is proposed. A total of 129 corn kernels with Grade A, Grade B, and Grade C are used for the experiments. Six typical characteristic parameters of samples are extracted as the characteristic groups. Four different classifiers are applied and compared: support vector machine-genetic algorithm, support vector machine-particle swarm optimization, support vector machine-grid search optimization, and back-propagation neural networks. Experimental results show that the support vector machine and back-propagation neural networks without parameter optimization have the same classification accuracy rates of 92.31%. The classification accuracies are improved using the support vector machine optimization algorithms. The average correct classification rates of support vector machine-genetic algorithm and support vector machine-particle swarm optimization are all 97.44%, while the correct classification rate of support vector machine-grid search achieves 94.87%. It is concluded that the support vector machine algorithm based on parameter optimization is superior to back-propagation neural networks algorithm, and the parameter optimization effects of genetic algorithm and particle swarm optimization are better than grid search method. With a relatively small number of samples, the support vector machine-genetic algorithm and support vector machine-particle swarm optimization algorithms can improve the grading accuracy of corn kernels.
Introduction
Corn is an important traditional food, animal feed, and industrial raw materials, which plays an important role in agricultural production. The quality grading of corn kernels is not only related to the yield and quality of corn production, but also has an important impact on breeding. Developing a fast and effective method to assess the quality of corn kernels has important practical significance for safeguarding the safety of stored grain.
The traditional quality classification of corn kernels mainly relies on human sense organs detection, but it has the disadvantage of time-consuming, inefficiency, and high error rate. Consequently, it is difficult to meet the needs of modern agriculture production. In most literatures, time reliability is very important to solve many problems.1–3 As a new detection technology, machine vision technology with fast and efficient characteristics can improve the degree of intelligence and automation of agriculture production detection.4,5 Domestic and foreign scholars have done a lot of research on the classification and quality detection of corn,6–8 rice,9–11 wheat,12–15 barley,16,17 rapeseed, 18 coffee beans, 19 and other agricultural products using machine vision technology and have made some progress.
Xiao et al. 6 classified five corn varieties such as BAINUO 6, NONGDA 86, NONGDA 108, GAOYOU 115, and NONGDA 4967 based on machine vision and back-propagation (BP) neural network technology, and the experimental results showed the average classification accuracy was up to 90%. Paulsen et al. 7 extracted and used the morphological parameters such as length, width, and projected area of corn kernels for detection and classification of fungal-damaged soybeans. Fungi species causing the damage were correctly identified by the algorithm in 66% to 96% of the soybeans tested. Ni et al. 8 constructed a prototype machine vision system for inspecting corn kernels and classified the whole and broken kernels with the recognition accuracies of 91% and 94%, respectively. Courtois et al. 9 measured the breakage ratio and estimated the fissures on parboiled rice by image analysis on unarranged grain samples. The experimental results showed it was validated for breakage and visual inspection for cracks. Zapotoczny et al. 12 proposed a texture-based classification method for classifying 11 different quality grades of spring wheat and winter wheat varieties. Textures were computed separately for seven channels (R, G, B, Y, S, U, V). The results were examined with the application of discriminant analysis and neural networks. The classification accuracy of 11 wheat varieties reached 100%. Szczypiński and Zapotoczny 17 identified barley varieties based on image-derived shape, color, and texture attributes of individual kernels. Additional analysis of kernel wrinkled region improved the results of varietal identification with high balanced accuracy ranging from 67% to 86%. Kurtulmuş and Ünal 18 developed an expert system for the detection of rapeseed variety using computer vision and machine learning, and the overall accuracy rate reached 99.24%.
Some researchers also used spectrophotometric techniques for the classification of maize seeds, 20 wheat seeds,21–23 rapeseeds, 24 and so on. Although the spectrophotometry techniques are robust, the detection systems are expensive and require qualified experts to operate them. In contrast, traditional visual methods for seed classification are more affordable and convenient.
Nevertheless, the natural diversity in morphology of corn kernels makes classification a complex work because of a large number of classification features required. How to design classifiers and improve the accuracy of classification is an important research content. Support vector machine (SVM) based on structural risk minimization shows many unique advantages in solving small sample classification and has better recognition effect25–28 and plays an important role in traditional machine learning for its good learning ability and generalization ability. Thus, SVM is chosen as the optimized classifier of corn kernels.
This study aimed to (1) develop a computer vision system to classify corn kernels economically and conveniently, (2) extract the external features of corn kernels, and (3) optimize the parameters of SVM to improve the classification accuracies of corn kernels.
Materials and methods
Samples
In this study, yellow corn kernels were obtained from a farm in Zhengzhou City, Henan Province. Professional staff classified them into three grades: Grade A, Grade B, and Grade C according to the national standard GB/T 17890-2008. A total of 129 samples were selected, and among which 30 samples were used as training samples and 13 samples were used as test samples for each grade.
Image acquisition
Corn kernels image were obtained using a computer vision system, which mainly included a computer, a collection box, and a digital camera. The computer motherboard is ASUS P5KPL-AMSE, which integrates Intel(R) G33/G31 graphics card (256 MB of video memory), Intel Core i5-6500 CPU, clocked at 3.2 GHz, memory 4.0 GB, and 64-bit operating system. The images were acquired using the digital camera (Sony DSC-WX150) with 4896 by 3672 pixels and the lens with the focal length of 4.45–44.5 mm and the aperture of F3.3-F5.9. The black hard cardboard as background created good contrast between the background and the corn kernels samples and simplified further boundary detection and image processing.
Image preprocessing and contour extraction
Image processing method is used to analyze corn kernels images. The collected RGB color image (Figure 1(a)) is transformed into gray image, then the image is denoised by median filter, 29 and the image is divided into binary image by Otsu 30 method. The noise and adhesion are removed and the holes are filled by morphological operation (Figure 1(b)). Figure 1(c) shows the inverse image. 8-direction chain code is a typical technology based on Freeman direction chain code, and its basic idea is to identify and store the direction code of each pixel on the contour to its neighboring pixels. 31 Here the outline image of corn kernels is obtained by the chain code, and the results are shown in Figure 1(d).
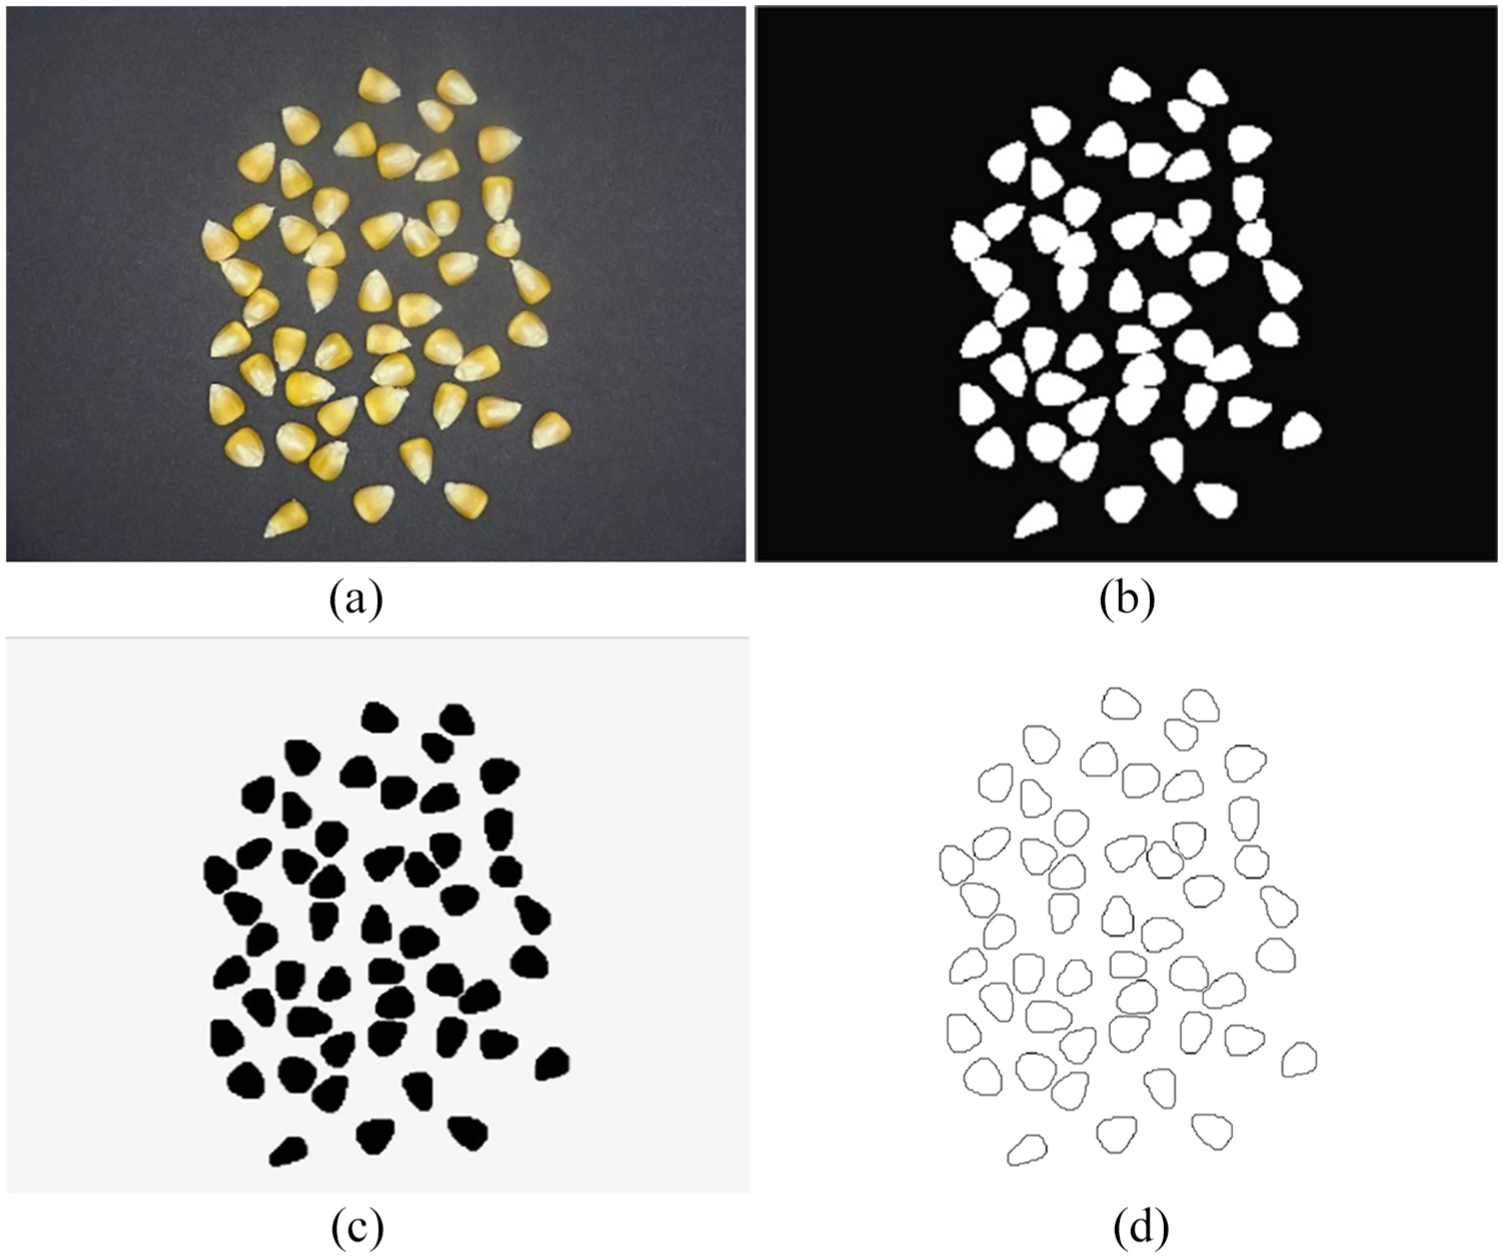
Image preprocessing and contour extraction: (a) original color image, (b) morphological processing, (c) inversion, and (d) contour image.
Feature extraction
The purpose of image segmentation is to extract the kernel characteristics and classify the image. 32 The shape characteristics are important in the study of maize grain classification. Here, the main shape characteristic parameters have target area, target regional circumference, rectangularity, circularity, and shape complexity.
Target regional circumference is defined as

where
Target area is the feature associated with the region, which can be obtained by the line segment table method. The formula is given by

where N is the number of intervals.
Lesion rectangularity is used to describe the closeness degree and the minimum bounding rectangle of the corn kernel, which is calculated as follows

where A is the area of the corn kernel;
Corn kernel circularity is used to describe the extent of the corn kernel close to a true circle, which is calculated as follows

where A is the area of the corn kernel; L is the circumference of the corn kernel. The value range of C is between 0 and 1.
Corn kernel shape complexity describes the relative amount of perimeter per unit area. It is defined as

Larger value e shows that the corn kernel has more complex shape. These shape features of the corn kernels are extracted for quality classification. The standard classification for the size of corn kernel is defined as follows: the diameter larger than 7.2 mm is large corn kernel, the diameter between 7.2 and 6.8 mm is median corn kernel, and the diameter smaller than 6.8 mm is small corn kernel. This article selects 129 sets of eigenvalues, among which 43 sets are respectively for Grade A, Grade B, and Grade C. Part of the eigenvalues is shown in Table 1.
Eigenvalues of three types of corn kernels images.

SVM
The basic idea of SVM is to use the principle of structural minimization to establish the optimal hyperplane in the attribute space, and to get the maximum classification interval, so that the classifier can get the global optimal in the whole sample space. 33 SVM optimal classification surface is shown in Figure 2. Two class samples are represented by square and circular. “w” is the coefficient vector of the hyperplane. H is a classification line. H1 and H2 are the samples closest to the classification line and parallel to the classification line in each type. The points on H1 and H2 (Xi, Yi) are called support vectors, and the classification intervals are the distance between them H1 and H2, that is, Margin. In many cases, the middle boundary can be varied, as long as it is appropriate.
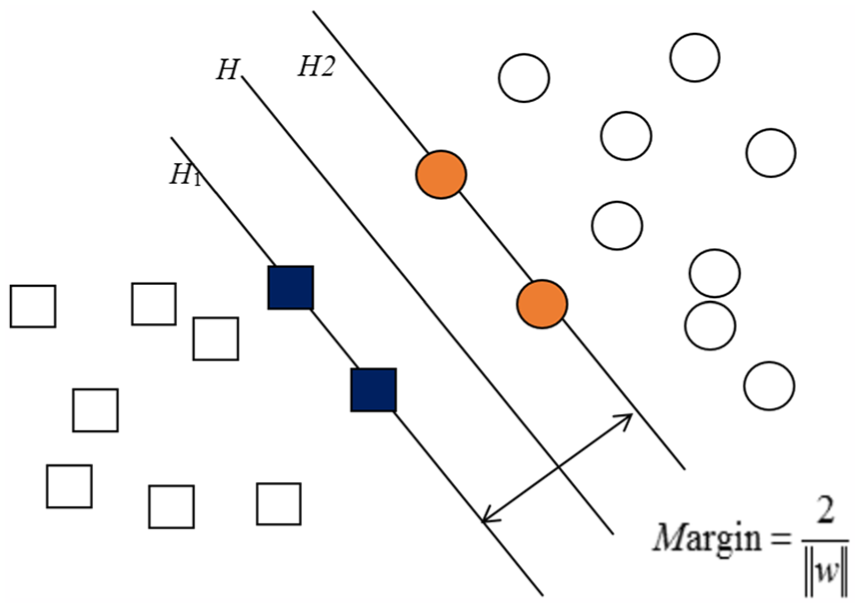
Optimal classification surface of SVM.
To find an effective classifier for corn kernels classification, the choice of SVM kernel function is a key step. In order to solve the linear inseparability problem in the original space, it is transformed into a nonlinear separation problem by selecting the appropriate kernel function. Samples are projected from low-dimensional space to corresponding high-dimensional spaces. SVM kernel functions include linear kernel function, polynomial kernel function, Gaussian radial basis function (RBF) kernel function, and sigmoid kernel function. RBF kernel function has good application range and fitness, and low complexity.34,35 It is not only suitable for large samples, but also for small samples. Therefore, we choose the RBF kernel function here. The RBF is as follows

Parameter g represents the width of the kernel function, which plays an important role in improving the performance of SVM classification.
Results and discussion
SVM classification without parameter optimization
LIB-SVM 2.83 and MATLAB R2016a software are used to identify the quality grade of corn kernels, and the running environment is Windows 7. To prevent slow convergence of results and long training time, the training set and test set are normalized. The RBF parameters are c = 2 and g = 1. The recognition accuracy of SVM classification without parameter optimization is 92.31%, and the results are shown in Figure 3.

Classification results based on SVM without parameter optimization.
SVM classification based on parameter optimization
In order to improve the performance of classifier, penalty parameter c and kernel parameter g need to be optimized. The popular parameter optimization algorithms include genetic algorithm (GA),36–38 particle swarm optimization (PSO), 39 grid search (GS) method, and so on.
Classification based on support vector machine-grid search
GS is an exhaustive search method with specified parameter values. The purpose is to find the most accurate (c, g) pairs for cross-validation. The method first tries all possible (c, g) pairs and then performs cross-validation. First, the rough variation ranges of parameter c and g are selected: 2^(–10), 2^(–9),…, 2^(10). Then the ranges are further refined: the range of parameter c is 2^(–2), 2^(–1.5),…, 2^(4), and the range of parameter g is 2^(–4), 2^(–3.5),…, 2^(4). The classification results based on support vector machine-grid search (SVM-GS) are shown in Figure 4. It can be seen that the parameters are optimized and the classification results are improved after the cross-validation of the GS. Thirty-seven samples are correctly identified among the 39 corn kernels samples, and the recognition accuracy rate is 94.87%.

Classification based on SVM-GS.
Classification based on support vector machine-genetic algorithm
The basic idea of GA is to simulate Darwin’s natural evolution principle to search for the optimal solution, which can deal with many complex problems. In this article, the accuracy of training set in the sense of cross validation is taken as the fitness function value in GA.
The largest evolutionary algebra is 200, the maximum number of populations is 20, the range of the parameter c is [0, 100] the range of the parameter g is [0, 1000] the cross validation parameter is 3, the probability of crossover is 0.4, and the probability of variation is 0.01. The classification results are shown in Figure 5, and the fitness curve is shown in Figure 6. After the parameters optimization of GA, only one corn kernel sample is not identified correctly, and its recognition accuracy rate rises to 97.44%.

Classification based on SVM-GA.

Fitness curve of GA optimization parameters.
Classification based on support vector machine-particle swarm optimization
The basic idea of PSO is to simulate bird foraging behavior, and to find the optimal solution through information cooperation and sharing among individuals in a group.40,41 Similar to GA, it belongs to evolutionary algorithm and heuristic algorithm. It is easy to find the global optimal solution by following the current optimal value and then iteratively without setting many parameters.
The velocity and position of each particle is updated by formula (7)
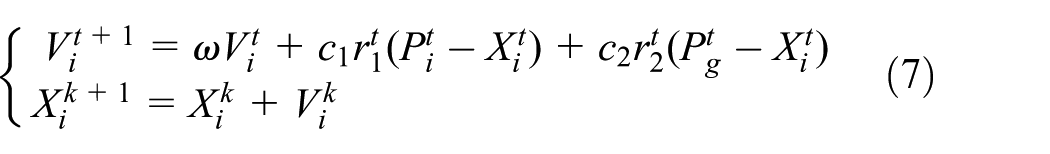
Here
In this article, the search range of penalty factor C is [0.1, 100], the search range of kernel parameter g is [0.01, 1000], the learning factor c1 is 1.5, the learning factor c2 is 1.7, the maximum number of iterations is 200, and the population scale is 20. The classification results are shown in Figure 7, and the fitness curve is shown in Figure 8. After the parameters optimization of PSO, only one corn kernel is not identified correctly, and its recognition accuracy rate is 97.44%.

Classification results after optimization of PSO parameters.
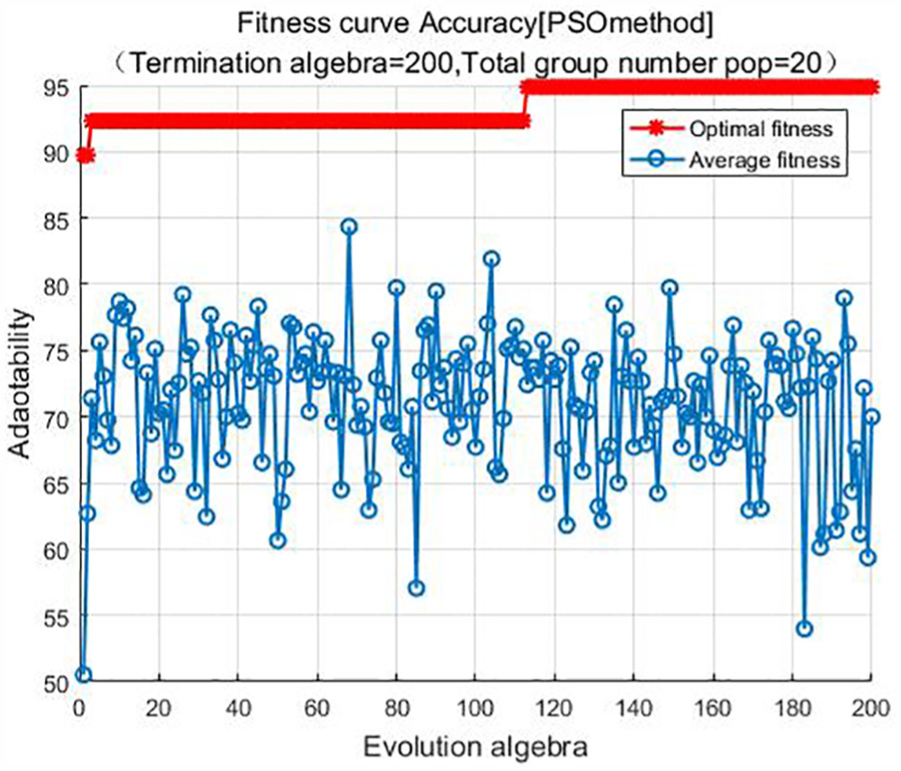
Fitness curve for PSO optimization parameters.
Classification based on BP neural network
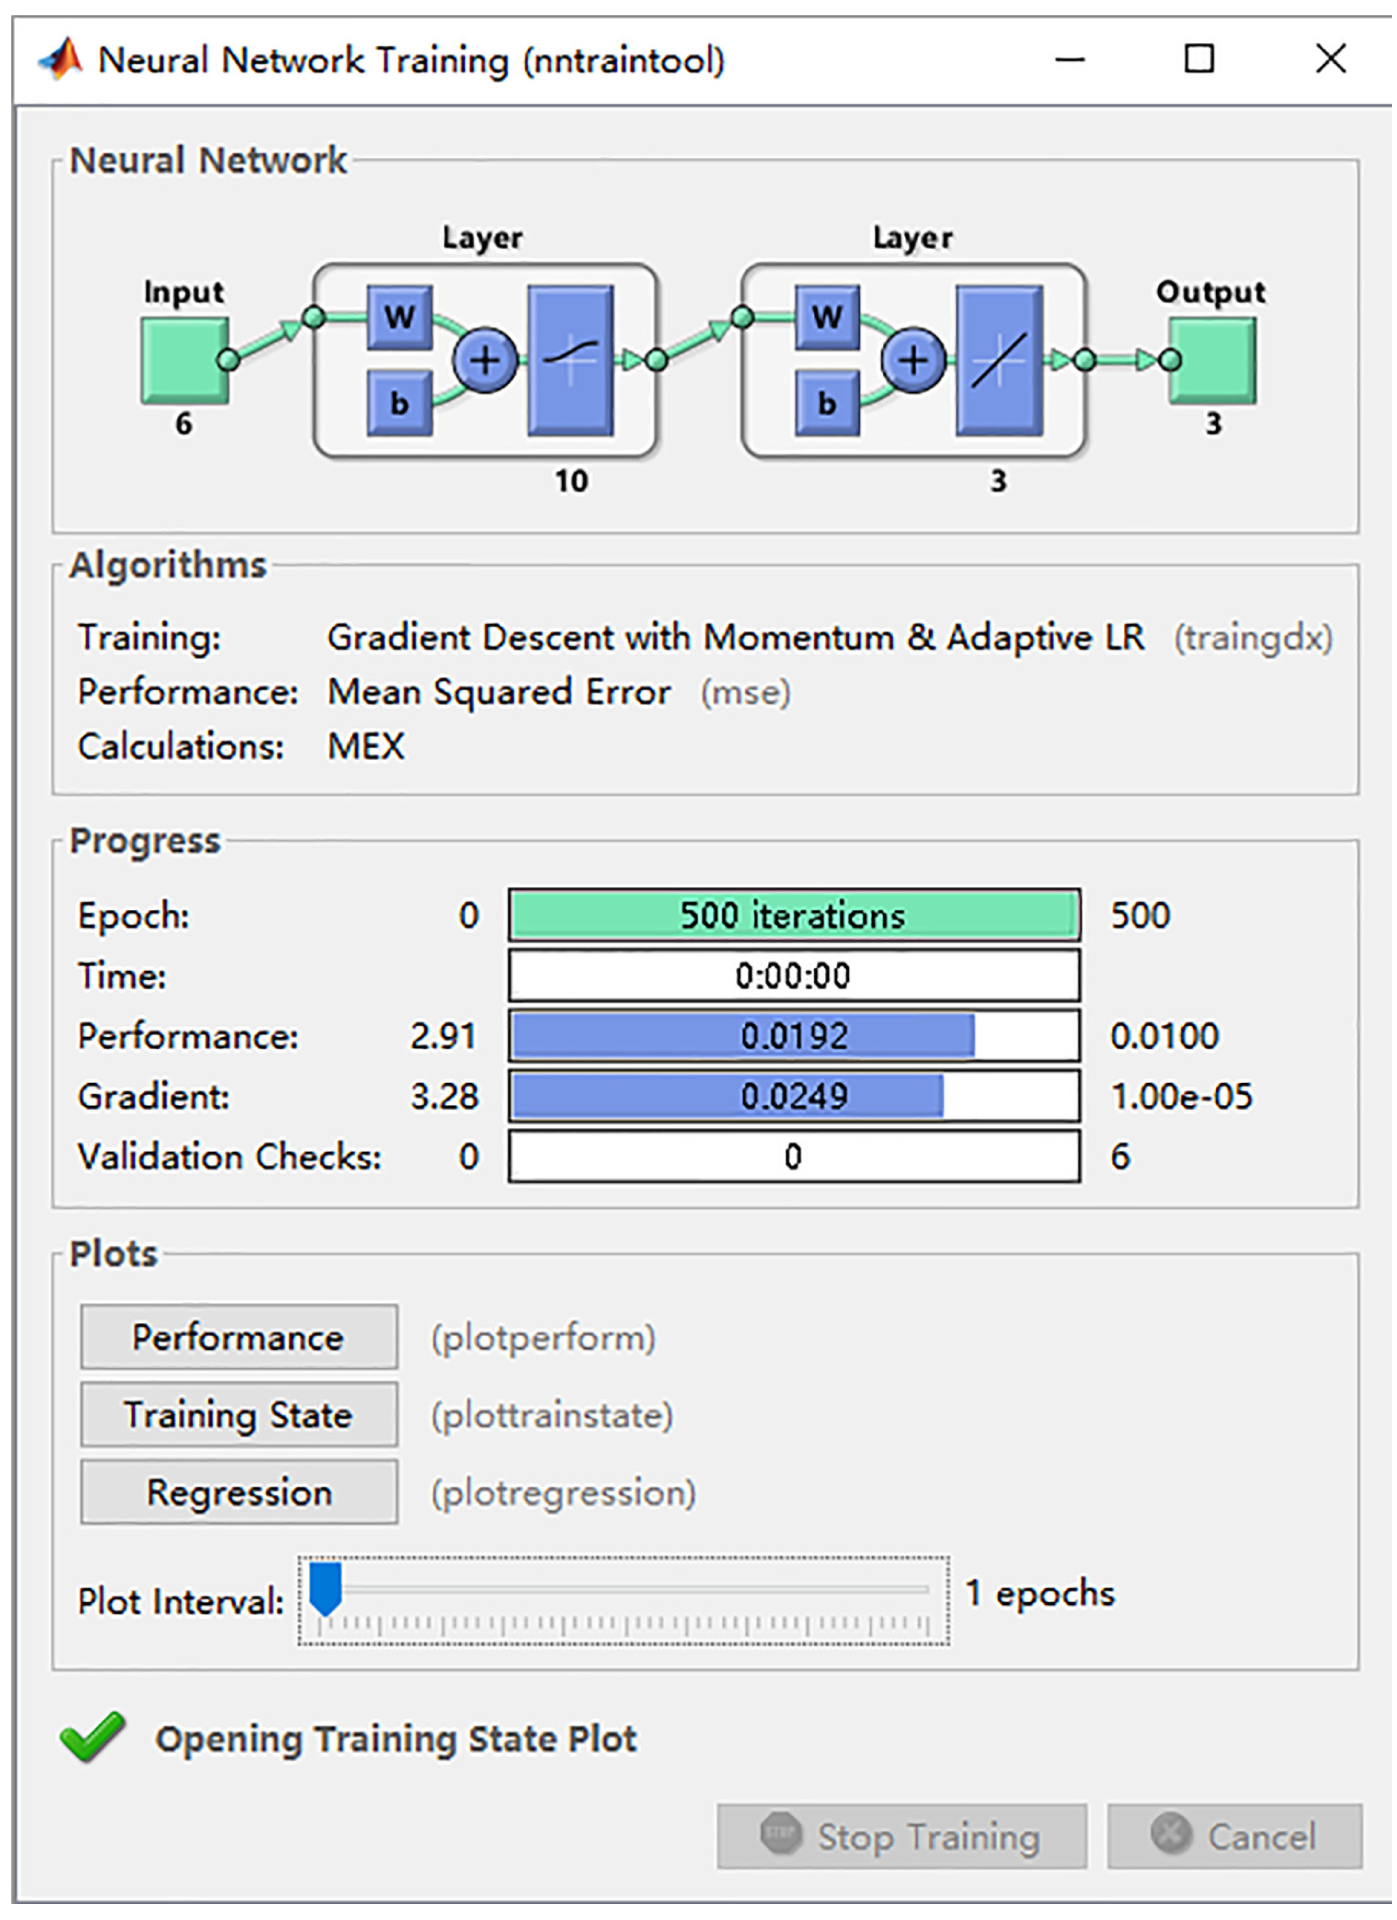
In order to fully compare the results of recognition, BP neural network algorithm is also used to classify the corn kernels samples. Here, the maximum number of iterations is 500, the target error is 0.01, and the learning rate is 0.01. Using the same characteristic data, the recognition rate of BP neural network is 92.31%. The training performance is shown in Figure 9, and the training simulation results are shown in Figure 10.

Performance of BP neural network.
Simulation results of BP neural network.
It can be seen from Figure 9 that the convergence is achieved after 150 times iterations. In Figure 10, the network structure is 6-10-3-3. The algorithm uses traingdx, and the error change is mean square error (MSE). After 500 iterations, the error gradient is 0.0249 when the network precision is 0.0100.
Comparison of classification results
Table 2 shows the classification results of corn kernels based on these algorithms. It can be drawn from the table:
The algorithms with higher accuracy rate are SVM classifiers with parameters optimization. Support vector machine-genetic algorithm (SVM-GA) and support vector machine-particle swarm optimization (SVM-PSO) have better classification results. The classification effect of SVM-GA and SVM-PSO is better than that of SVM-GS. The SVM classification effect with parameters optimization is better than that of BP neural network.
SVM has a good classification effect on small samples. Usually, the correct recognition rate is improved by optimizing the parameters c and g.
BP neural network has strong self-learning and generalization ability. The disadvantage is that the gradient descent method is slow, and sometimes, it may enter the local minimum and the training fails.
Classification results of corn kernels.
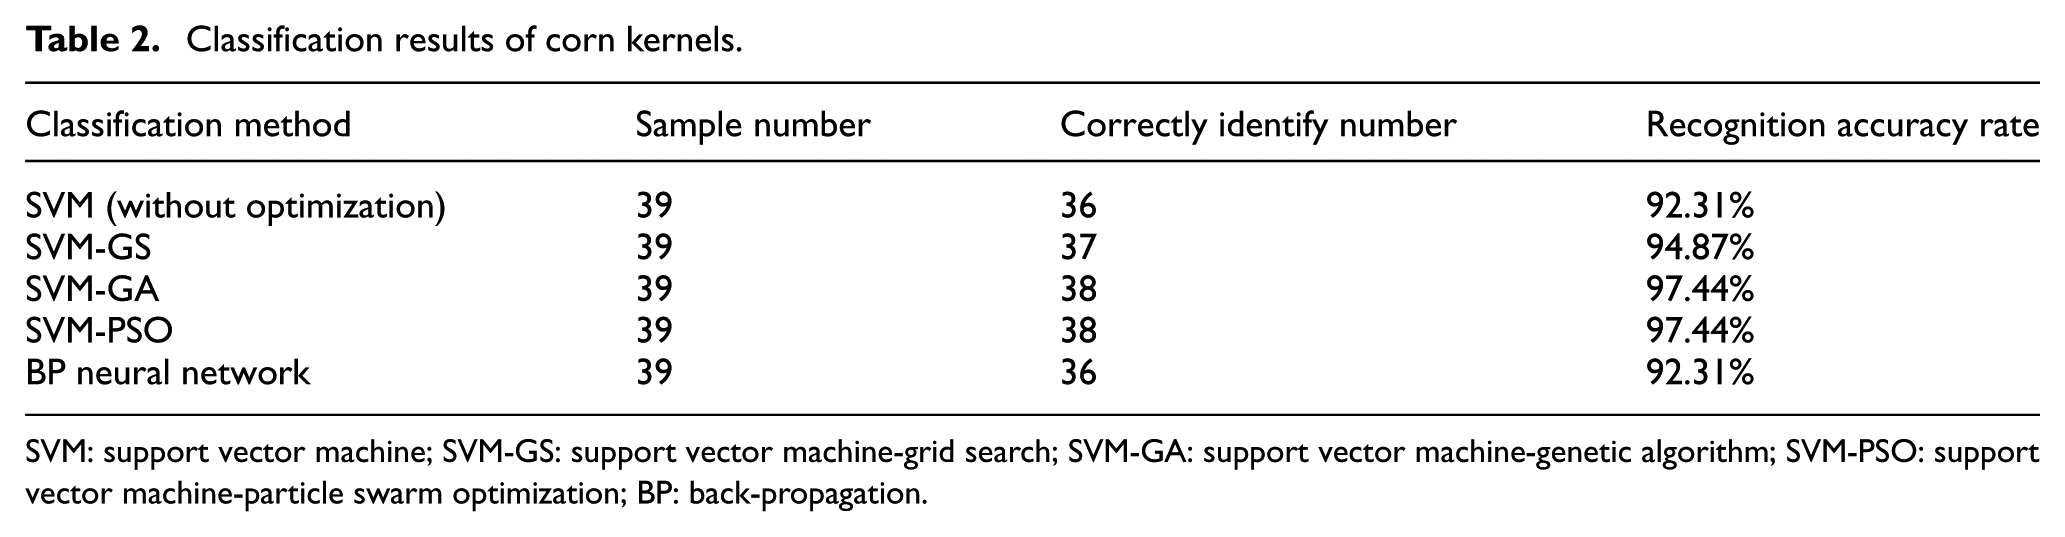
SVM: support vector machine; SVM-GS: support vector machine-grid search; SVM-GA: support vector machine-genetic algorithm; SVM-PSO: support vector machine-particle swarm optimization; BP: back-propagation.
Conclusion
Method for evaluating and classifying corn kernels quality was presented. The image processing techniques, SVM, and BP neural network were used in this method. All 129 corn kernels of different grades were investigated, and six typical feature parameters were extracted from each corn kernel using image processing techniques. The separation accuracy of corn kernels was improved through the optimization classification models. Four different classifiers were applied and compared: SVM- GA, SVM- PSO, SVM- GS, and BP neural networks. SVM had a good classification effect on small samples. The correct recognition rates were improved by optimizing the parameters c and g. The classification effects of SVM-GA and SVM-PSO were better than that of SVM-GS. The SVM classification accuracy with parameters optimization was better than that of BP neural network for the classification of corn kernel grades.
Footnotes
Handling Editor: Tao Feng
Declaration of conflicting interests
The author(s) declared no potential conflicts of interest with respect to the research, authorship, and/or publication of this article.
Funding
The author(s) disclosed receipt of the following financial support for the research, authorship, and/or publication of this article: This study was supported by National Natural Science Foundation of China (U1304305), Scientific Research Tackling Key Subject of Henan Province (142102310550, 162102110122, 172102210300, and 182102110116), Natural Science Foundation of Henan Province (142300410419), and Key Project of Science and Technology Research of Henan Province Education Department (14B416006, 15A416001, and 16A510028).