
Abstract
This research is to investigate the various parameters and conditions of implementing solar and wind energy in engine-driven three-wheelers. No reliable study of using both these energies in three-wheelers is found in the literature so far. In this article, a numerical study is conducted for using both these energies in a plugged-in hybrid three-wheeler. From the analysis, it is found that both the renewable energies will provide approximately 54% of total energy to run the vehicle altogether. A novel computational fluid dynamics simulation for a wind turbine is conducted to verify the theoretical results. Here the wind turbine blade has simple aerofoil look with sinusoidal leading edge and dimpled surface. The vehicle will not only reduce the pressure on fuel and national grid electricity; but, also will reduce the emission by a large amount. A custom drive cycle along with drive power demand is obtained using vehicle properties and city road conditions and comparing with Asian urban drive cycle. A detailed feasibility analysis of the vehicle is analyzed considering various costs, weight, and emissions, and a future researching infrastructure is also proposed. Finally, some recommendations are provided which can be considered for future research interests.
Keywords
Introduction
In this world, energy is a key concern. Most of the energy produced in the conventional way needs fuel, and it is estimated that if this rate of petroleum/fuel consumption for power generation continues, then it could be hardly utilized for 50 years. A report of the U.S. Energy Information Administration states “United States consumed 18.7 million barrels of petroleum per day in the first half of 2009.” Ground vehicles are the primary consumer of petroleum resources. 1 Therefore, an alternative source for elegant power production is mandatory. Although various renewable methods of energy production are available, most of them cannot generate enough energy standalone. Hybridization of various renewable sources for power generation can solve this issue widely.
Wind and solar energy are the very basic types of alternative energy. For generating electricity from wind energy, a wind turbine is used (horizontal or vertical). It is a device that converts kinetic energy from the wind into electrical power. The generator then supplies the electricity by connecting to the gearing arrangement of engine of vehicle generally. The smallest turbines are used for applications such as battery charging for auxiliary power for boats or caravans or to power traffic warning signals. Slightly larger turbines can be used for making other contributions. Wind-powered electricity is not a mass production which is constrained by seasons, weather, and the wind velocity; therefore, no wind, no electricity. But solar energy remains constant throughout a season to a reasonable extent. Thus, if these two systems are combined in a vehicle for producing power, it can be used as a more reliable source of renewable/alternative power production, and a great limit of greenhouse gas emissions can be reduced.
As of 2017, Denmark generates 40% of its electricity from wind. Same applications were adapted widely in many developed countries. Bangladesh is also one of the fastest growing economies in the world. The four major megacities of this country are very densely populated, where the traffic problem is huge. The main reasons of this problem are a huge number of auto-rickshaws, buses, and trucks. These vehicles consume a lot of fuel and emit huge amount of various toxic and harmful particles and gases. Therefore, it is necessary to make these vehicles environment friendly; electrification or hybridization can be an effective solution. In hybridization, it can use both renewable and non-renewable energies simultaneously. Compared with other conventional vehicles plug-in hybrid vehicles (PHEVs) consume less energy and produces much less greenhouse and toxic gases because it roughly uses 60% less fuel than conventional vehicles.1–3
PHEV is a very old terminology; it was first developed in the early 1960s. But numerous modifications have been done in the last few years. In 2010, P. Mulhall et al. designed and fabricated a solar-assisted auto-rickshaw and gave detailed analysis on its efficiency. They designed an improved three-wheeler and proposed a recharging infrastructure. 4 Earlier in 2009, S Ejaz et al. 5 made a compact computer-aided design (CAD) analysis on the toxic gas emission effects of auto-rickshaw, in which they found the effect of auto-rickshaw smoke on psychological angiogenesis. He, along with his colleagues, showed computer-based three-dimensional (3D) images of the effect. In 2010, a team of surveyors in Srilanka lead by Mr. Amal S. Kumarage analyzed the economic and social parameters of three-wheeler taxi service. They surveyed on 200 operators and 100 passengers and analyzed the positive and negative aspects of these vehicles. 6 Kelly JC et al. 7 worked on a time-dependent PHEV, where they found that a compact vehicle with 10.4 kW useable batteries travels 62.5%–75.7% on battery electricity, depending on charging scenario. In the same year, Mani A et al. 8 worked on the role of auto-rickshaw on sustainable urban transport sector. They examined the role that auto-rickshaws can play in sustainable urban transport sector of India and found a very positive result. In 2014, ARM Siddique et al. 9 evaluated the performance of a micro-controller-based solar power auto-rickshaw. They programmed a PIC controller to control the DC cycle of the motor and were successful to reduce battery discharge time. The team presented this work in a reputed conference indexed by IEEE. In the same time, Shaha N and Uddin MB also gave a conference presentation where they showed their work on PHEV. The authors mainly used a normal Bangladeshi tri-wheeler auto-rickshaw along with a photovoltaic (PV) panel to supply a renewable energy which was validated using ADVISOR software. 10 During mid-2015, a team of Bangladeshi researchers leaded by SJ Chowdhury 11 presented their work in the Transportation Electrification Conference and Expo by IEEE, where they developed an environment-friendly electric auto-rickshaw using PV panel for Bangladesh; where a 360 W PV panel was attached with the auto-rickshaw and was able to supply 50% of the total vehicle power. In 2016, Mr AKM Abdul Malik Azad 12 developed a solar-assisted rickshaw van for Bangladesh and showed it as a total off-grid solution for Bangladesh. In the end of 2017, A Mallik et al. 13 made a numerical investigation about a plugged-in hybrid auto-rickshaw for Bangladesh and discussed its feasibility in detail. Habib et al. published a survey report on compressed natural gas–(CNG) driven auto-rickshaw service in some selected regions of Dhaka city. They described various advantages and disadvantages of auto-rickshaw in Bangladesh. 14 Among those literatures, only one literature states about using wind turbine as a renewable energy source for vehicle. Awal et al. 15 designed and implemented a vehicle-mount wind turbine, where the turbine was positioned on the roof top of the vehicle and could generate 200 W at a vehicle speed of 80 km/h.
Solar and wind energy were never used in auto-rickshaw simultaneously. In the last few years, several experiments and significant improvements in fuel consumption and emissions of auto-rickshaw are conducted. In this article, PV panel and wind turbine are attached with a plugged-in hybrid three-wheeler to reduce the pressure on fuel and national grid electricity. A new vehicle design is proposed here to reduce the additional drag created by the turbine; here, the wind turbine is positioned inside the vehicle. Computational fluid dynamics (CFD) analysis of the turbine blade is done considering turbine and blade properties, and the net drag and lift forces are calculated. Since plug-in hybrid technology is used, emissions would be zero only if the vehicle runs on electricity produced by turbine, PV panel, and national grid electricity.
Powertrain of the vehicle
The vehicle powertrain topology is investigated in this article, as shown in Figure 1. The vehicle is pressed by an electric motor (EM) system. An engine generator set (EGS) and a lithium ion (Li-ion) battery pack are used to deliver electric power to the motor. The motor can run on both electric energy and thermal energy. Charges from the PV panel and wind turbine are stored in the battery, and thermal energy of the engine is transformed to electrical energy through a generator, and both are delivered to the motor. 16
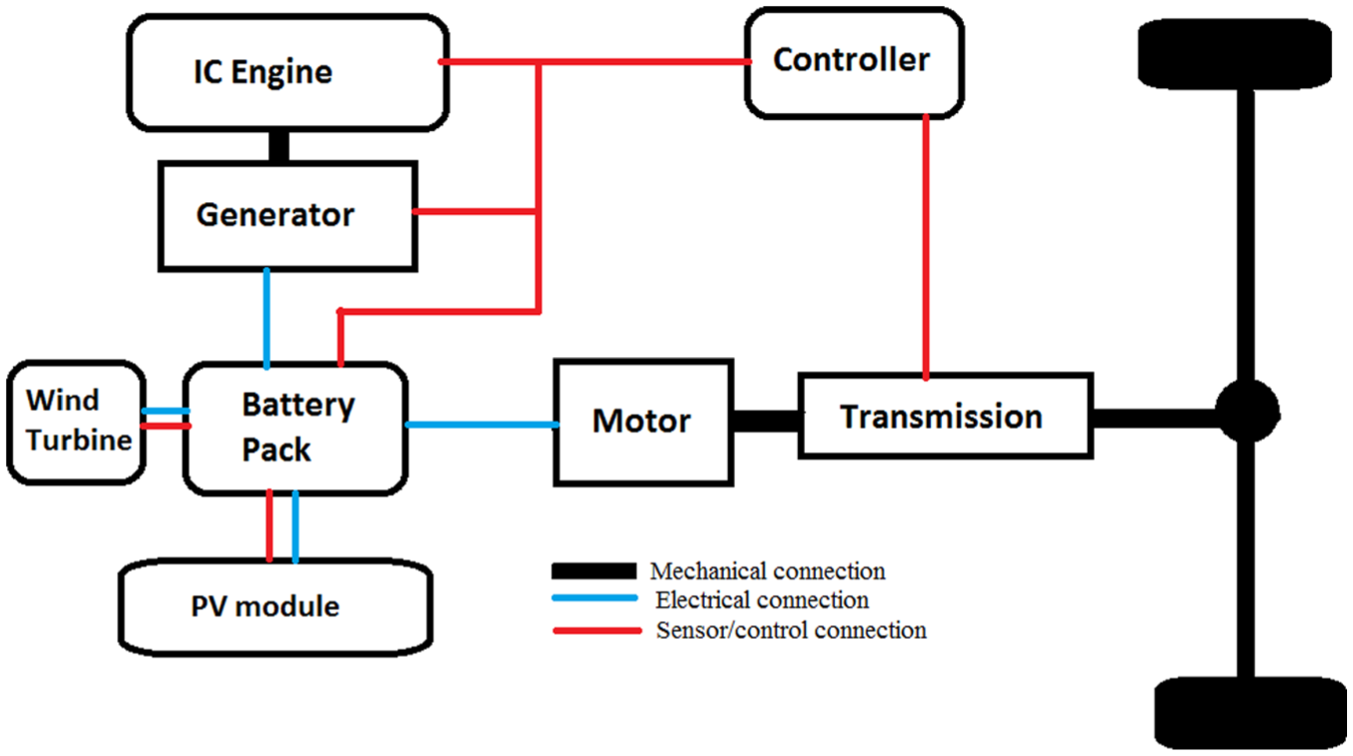
Schematic diagram of the vehicle powertrain.
The power alter relationship can be portrayed by the following equations (1)–(3). The EM yield control is determined by the driver action signals.17,18 Here, the driver is fundamentally demonstrated as a proportional–integral–derivative (PID) control as indicated by the objective velocity V* and real V feedback. When assembling the EGS and battery pack collaborate, the energy administration system will settle on the choices about power share between the EGS and battery


Figure 2 shows the energy flow diagram of the vehicle. The selection and modeling of the fundamental components are based on speed, vehicle drive command, and vehicle characteristics, and the city road conditions with the necessary demanded power must be met out to drive the wheels by the EM. The motor input power, split of generator unit power, and the battery power must be determined by the control system to reduce emissions and increase fuel efficiency. 19 Figure 2 represents the energy flow and control stratagies of the proposed vehicle. The control system splits the power required between the battery pack and the engine based on vehicle speed and battery state of charge (SoC) at the same time. The system must have the ability of spliting the power instanteneously at real-time application.
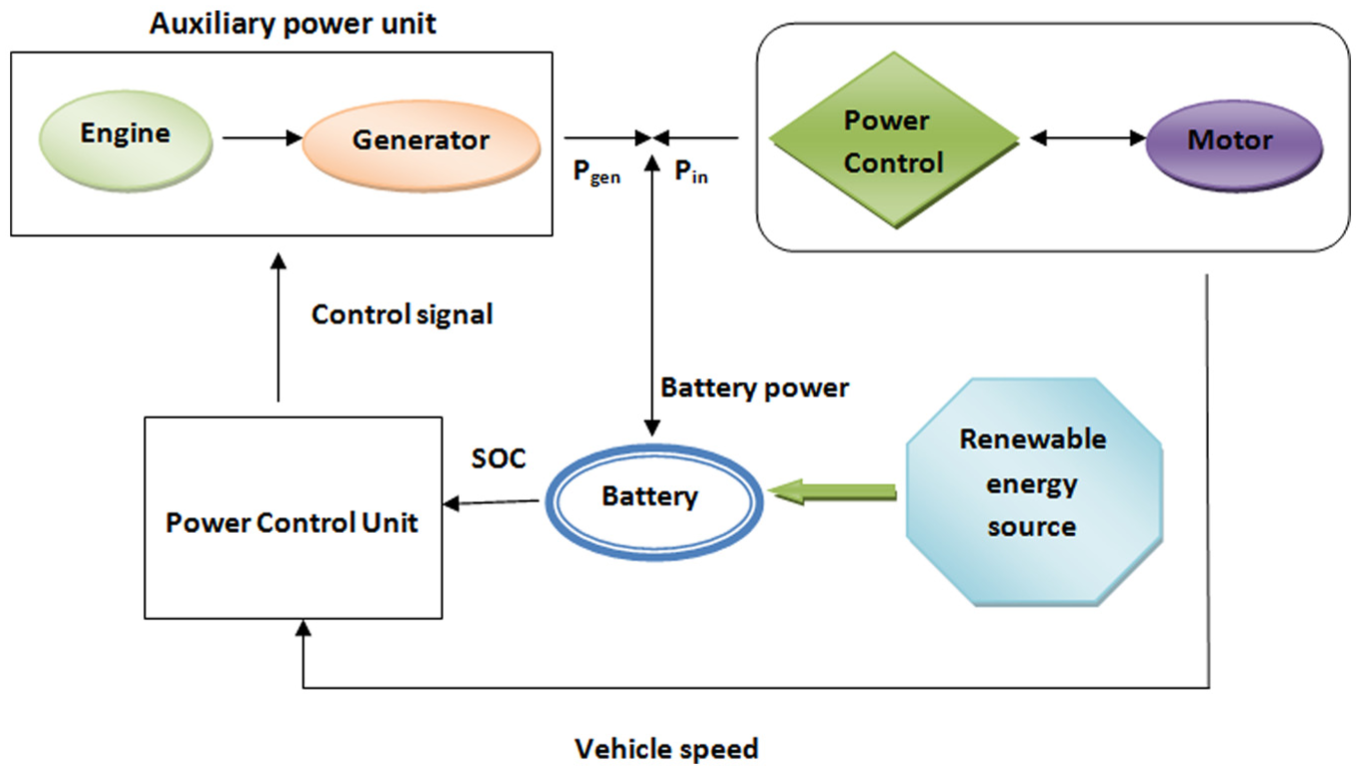
Energy flow diagram of the vehicle.
Materials and method
PV panel and wind turbine specifications
In this section, the specifications of the PV panel and wind turbine are stated. The values and data are taken from practical data. The specifications of PV panel are stated in Table 1. Wind energy is accessible in the form of kinetic energy, which can be transformed to other forms by mechanical adaptation; hence, the alteration is the production of electrical energy from mechanical energy. The full specifications of the wind turbine are shown in Table 2.
Solar PV panel specifications.

Wind turbine specifications.

PMDC: permanent magnet DC motor; HAWT: horizontal axis wind turbine.
Drive cycle
Drive cycle is one of the most vital parameters of a hybrid vehicle drivetrain. On the whole, an auto-rickshaw goes around 100–150 km per day. The drive cycle has been established by following the mild Asian drive cycle and using conventional auto-rickshaw properties. Here, distance travel and idle time are assumed for making the calculations easy. The normal drive cycle velocity is taken as 40 km/h, which is comparable to the interior city activity conditions.
Wind turbine blade simulation
The simulation is conducted by ANSYS CFD. The blades normally have aerofoil look with sinusoidal leading edge and dimpled surface. 20 The aspect ratio of the dimples is taken as 0.8, and center-to-center separation of dimples is taken as 3.5 cm. For these simulations, properties of Table 2 are used, and air velocity is taken as 12 m/s, and the velocity of the surfaces of the blade is taken zero. Vehicle speed is taken 40 km/h for this simulation. The lift and drag forces are calculated at different angle of attack to verify if the produced lift is sufficient enough to keep the blades rotating.
Selection of battery
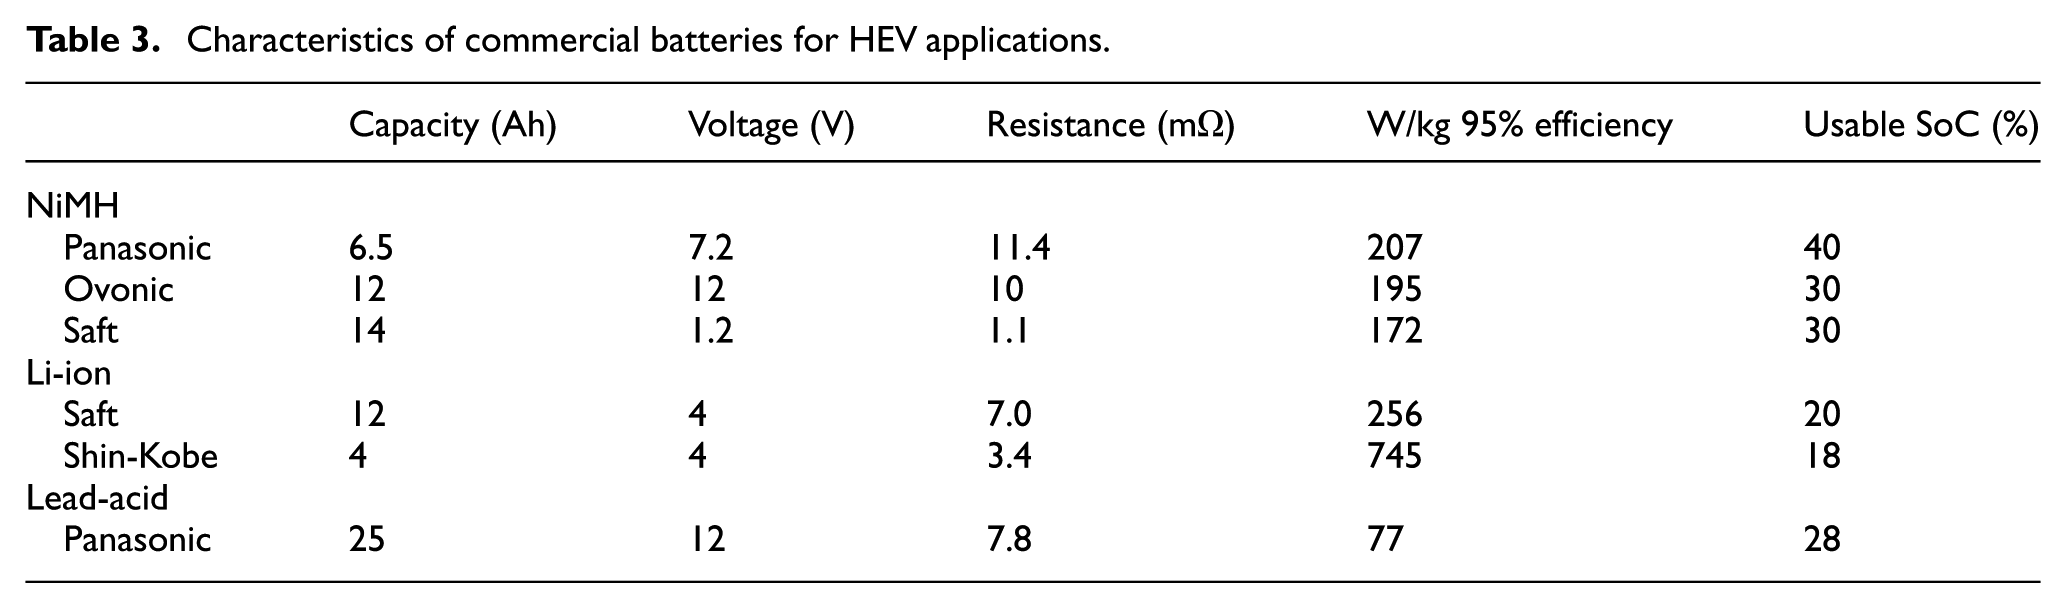
For hybrid electric vehicles, it is mandatory to store the produced power for a long time, thus special types of batteries are used. Among those types lead acid batteries, nickel-metal hydride (NiMH) batteries, Li-ion batteries, and nickel-cadmium (Ni-Cd)/nickel-zinc (Ni-Zn) batteries are mostly used because of their capacity to store energy for a long period. In Table 3, various important parameters are discussed, and Figure 3 depicts the comparison of fuel economy of these batteries.
Characteristics of commercial batteries for HEV applications.

Fuel economy (miles per gallon) comparison of different batteries.
Batteries should be selected area wise. The environmental conditions of a specific place can affect battery life. For these reasons, regarding the geographical and thermal conditions of Bangladesh, it would be better to use either Li-ion or Ni-Cd battery packs, as they have comparatively higher output potential.
Results and discussion
PV module power calculations
Let, total weight of vehicle is 500 kg (including all components and passengers)

Using equation (4), the required power to run the vehicle is calculated, where total power = 500 × 9.8 × 40 km/h × 0.03 W = 1430 W. Here, a 12 V/1 kW-rated induction motor is used. Current flow=P/V =1500/36 = 42 Ah. Load current per day = current flow running time per day × 1.2 = 42 × 5 h × 1.2 = 250 amp h/day. Capacity of the battery = load current per day × 1.2 = 300 amp h/day (overall 25% losses). Power required to run the motor = battery capacity × voltage difference = 250 × 36 = 9000 W h/day. No. of batteries = 1430/378 = 3.78 pieces = four pieces. Here, capacity of solar panel is 12 V and 270 W. Current flow = (270/12)/4 = 5.625 A to each battery. Charging time = 250/5.625 = 44.44 h. Now, the battery will be charged by one solar panel within 8 h of day light = (100 × 8)/44.44 = 18%. If two solar panels are used then battery will be charged to 36%.
Wind turbine power calculations
The output of wind turbine is expressed as


The capacity of the wind turbine is 12 V and 128 W. Current flow to each battery = (436.4/12)/4 = 9.09 A, and charging time = 250/14.44 = 27.50 h. If the auto runs for 5 h per day, then the battery will be charged = (100 × 5)/27.50 = 18.18% by the wind turbine. The PV module and wind turbine together will provide (36% + 18.18%) = 54.18% of total power.
In terms of wind turbine, four cases are depicted in Table 4, which can be considered. Table 4 shows that for cases 1, 2, and 3, the power is not enough to mention, as either air speed is too slow or the vehicle is stopped. Only in case 4, both vehicle and air are in functioning mode.
Vehicle speed and power.

Drive cycle
In Figure 4, the vehicle drive cycle of the vehicle is shown. The average speed of the vehicle is taken about 40 km/h. In Figure 5, the drive power demand is calculated at every moment for the entire span of the drive cycle. The drive power demand shows the estimated amount of power obligatory to run the vehicle according to drive cycle.

Urban part of modified Asian drive cycle.

Drive power demand of the vehicle.
Blade simulation results
After designing, the blade was imported to ANSYS CFD. For CFD analysis, meshing is one of the most important parameters for obtaining accurate results. For better results, the aerofoil element size was selected as 0.001 m and the boundary faces were selected to be sized 0.02 m. Smoothing was selected to be high, and other volume of the system was selected to be fine. Triangular mesh was applied for the analysis. K-epsilon (k-ε) turbulence model was selected for the simulation. It is a two-eq7 model which gives a general description of turbulence by means of two transport equations (partial differential equations (PDEs)). Figure 6 shows the velocity distribution at outlet. At the middle portion, velocity is about 1.089e + 001 m/s, and at the edges of the outlet surrounding velocity is about 3.2666e + 000 m/s, and at the very edges, it is approximately 0 m/s. Figure 7 shows the pressure distribution in the inlet from where the air enters or passes on the blade. At the middle, pressure is about 1.192e + 001 Pa, and at the edges, it is about −3.00e + 000 Pa. Due to the curvature in the blade inlet, the direction of the air is changed. Highest pressure on the blade is around 58 Pa. Figure 8 shows the dynamic pressure versus position XY plot. From this graph, dynamic pressure profile of the blade can be understood. It is the kinetic energy per unit volume around the fluid particle.
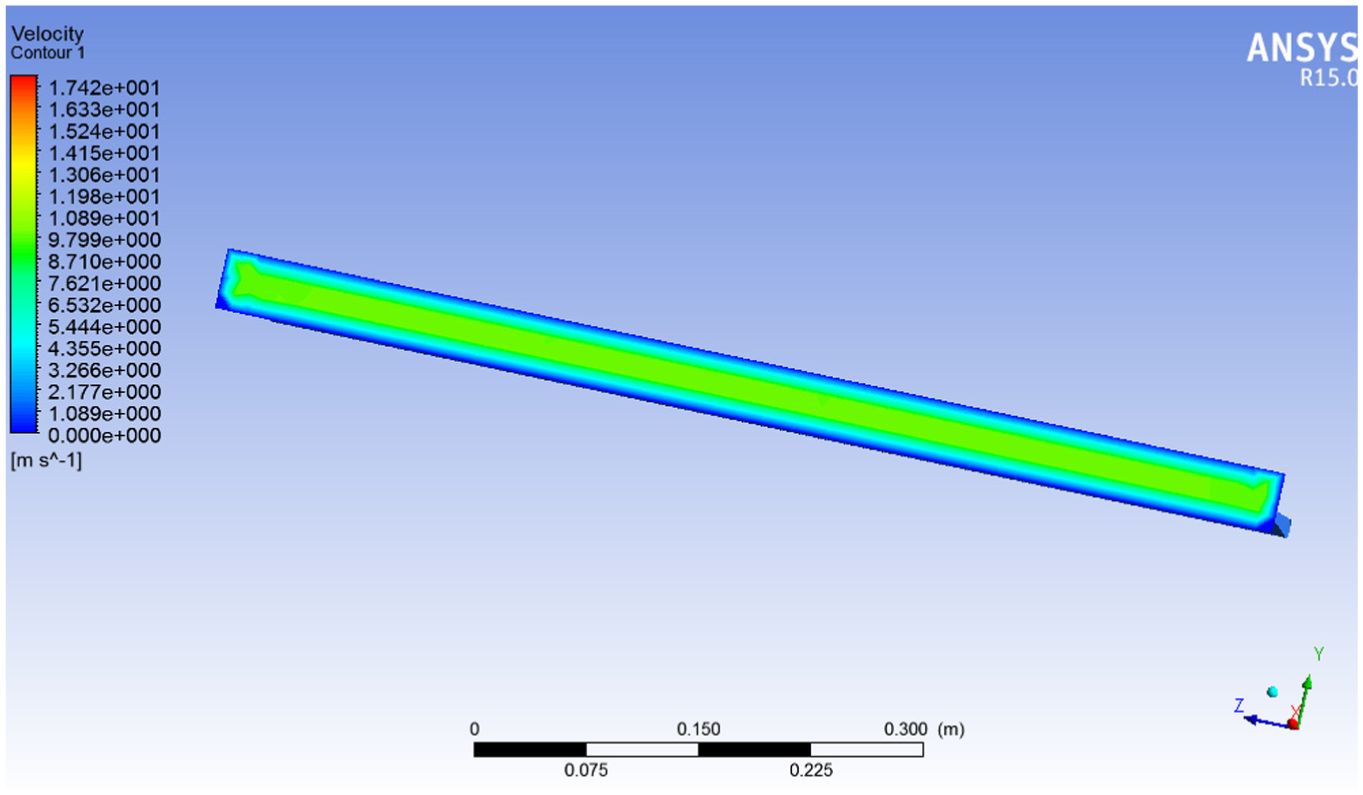
Velocity distribution at outlet.
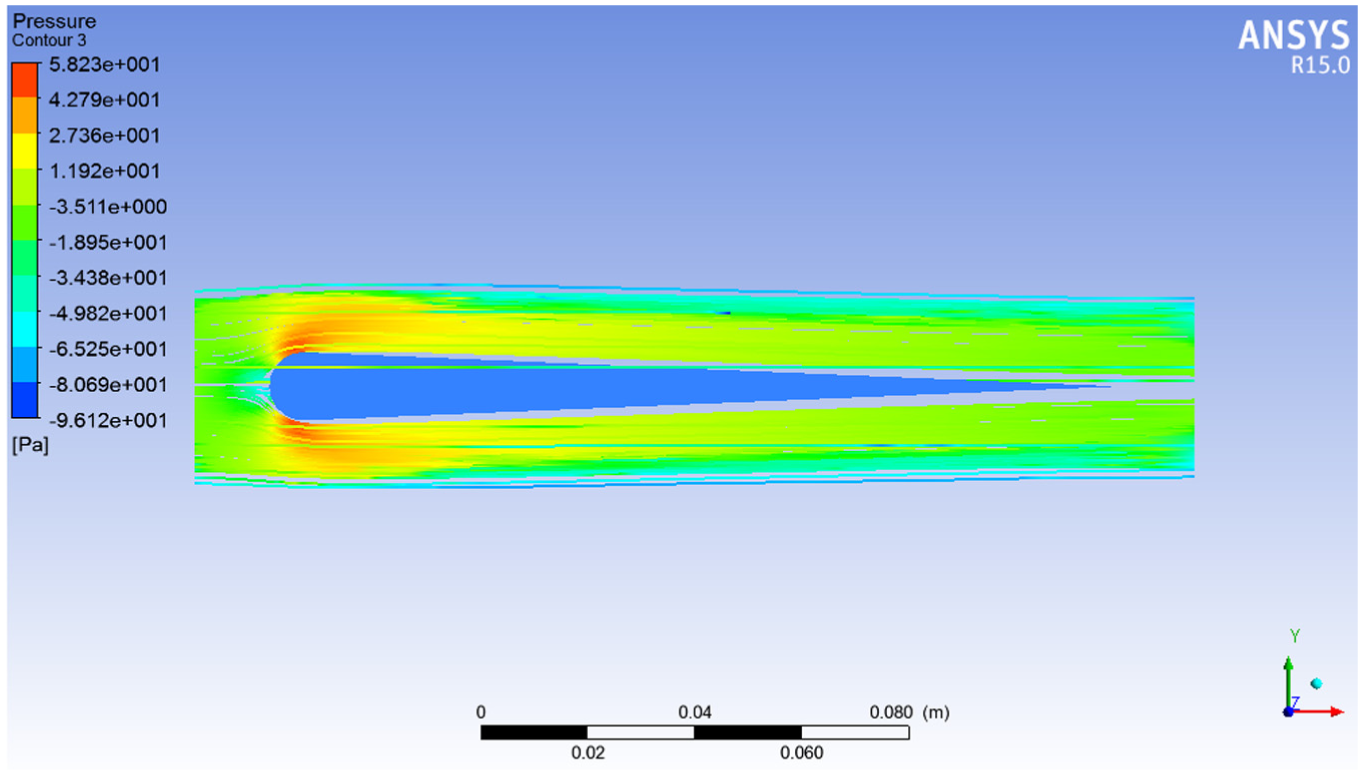
Pressure profile of the blade.

Dynamic pressure profile.
Figure 9 shows the coefficient of lift of the simple and modified designed aerofoil. At lower angles from 5° to 10° lifts, the results of both designs are quite similar. But, as the angle increases, the lift of modified design increases rapidly. At an angle of 20°, the highest lift in the modified design is obtained, and after 20° lift tends to decrease. Figure 10 shows the coefficient of drag at different angles of attack. The drag of both the models is almost similar at lower angles of attack. With the increase of angle of attack, the differences of drag in both models are visible. The obtained lift forces are sufficient enough to keep the blades moving.

Coefficient of lift for simple and modified design.

Coefficient of drag for simple and modified design.
Converter for storage
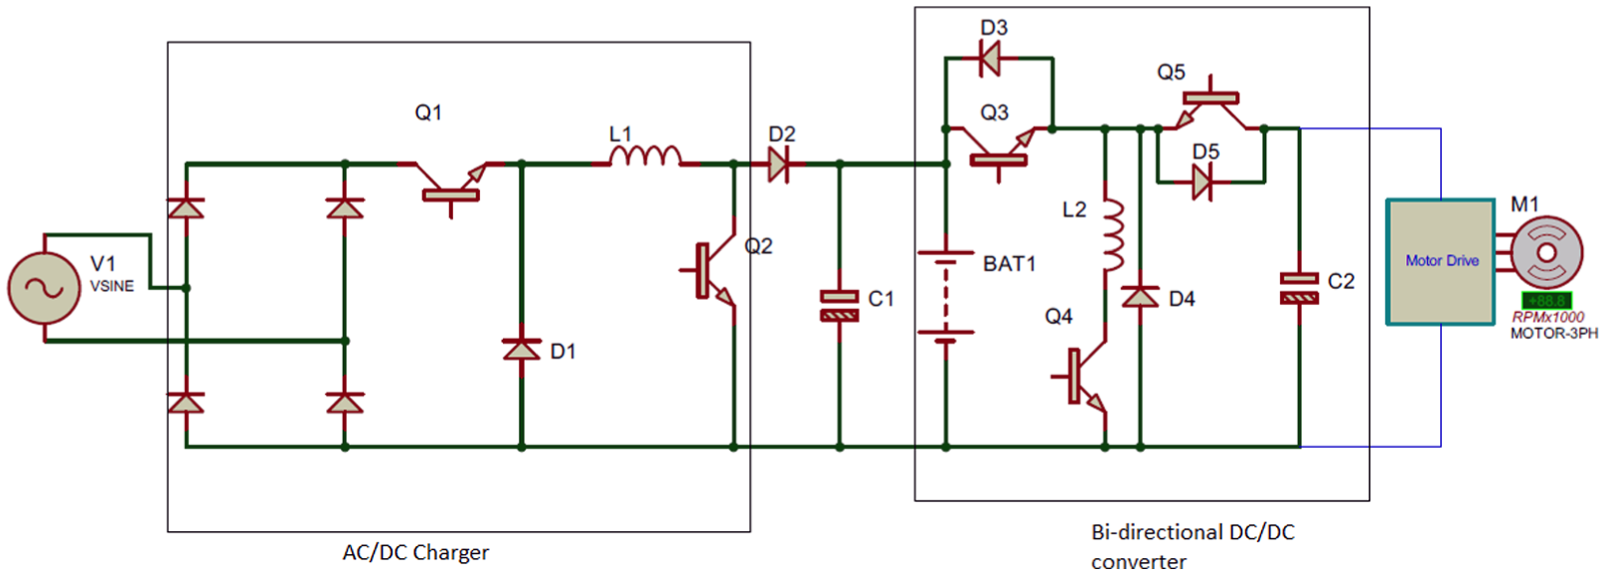
Figure 11 shows the conventional circuitry for charging and inverting characteristics of a PHEV. 21 In this topology, a grid charger, a battery pack, and DC converters are cascaded. The most negative issue of this topology is mainly the electrical loss in switches, limiting the efficiency of the vehicle. A group of researchers at the Indian Institute of Technology (Bangalore) have proposed a bi-directional converter integrated to the circuitry. 21 This system uses six field-effect transistors (FET) as switches and five half-bridge rectifier diodes, where this combination is used for buck and boost operations simultaneously when needed. Only one inductor is employed in this integrated converter, which allows reducing the number of high-current transducers. This helps reduce cost and weight. Figure 12, shows the circuitry of this topology.
Conventional charging and buck-boost circuit topology of PHEVs.

Integrated bi-directional buck-boost converting system for PHEVs.
Due to wind and vehicle speed, the mechanical input of the system is not constant. Vehicle speed fluctuates a lot due to city traffic and surrounding. For this reason, a low-cost and low-weight converter is necessary to regulate the speed. A buck-boost DC–DC converter can be a great solution to this. Table 5 shows the DC–DC converter topologies for this type of small-scale operations. 15 Since the power is varying from 0–100 W, it would be convenient to use a converter of Vout of 12 V, Iout of 5 A, and Pout of 60 W.
Several DC–DC converter topologies.

Feasibility analysis
Feasibility of the anticipated system is analyzed by taking into consideration the cost of the vehicle and its environmental impact.
Installation cost and payback period
In this section, installation cost of proposed system to a conventional engine operated vehicle is shown. Table 6 shows the cost assumptions for installing wind-PV/thermal combined plugged-in system.
Cost assumptions for installing wind-photovoltaic/thermal combined plugged-in system.

PV: photovoltaic; BDT: Bangladeshi Taka; ICE: internal combustion engine.
Here, as plugged-in system costs nearly the same of conventional gearing arrangement of internal combustion engine (ICE)-operated auto-rickshaw, so this cost can be omitted for the simplicity of cost estimation of new component installation.
In this system, it typically needs 1–2 PV panel(s), four batteries, an induction motor, and a wind turbine system (76,000–83,000 BDT (i.e. approximately US$991–US$995).
Thus, maximum installation cost of the proposed vehicle is 83,000 BDT (nearly US$1000).
Formula of payback period is

Here, ny is the number of years after the initial investment at which the last negative value of increasing cash flow occurs, n is the value of increasing cash flow at which the last negative value of cumulative cash flow occurs, p is the value of cash flow at which the first positive value of cumulative cash flow occurs.
In this proposed vehicle, total power calculated to run the system = 1430 W. Power required to run the motor 9 kWh/day = 9 unit. In Bangladesh, commercial electric line cost 25 BDT/unit (source: Dhaka Electric Supply Company Limited).
It requires = 9000/5 × 36 × 4 = 12.5 h to charge the full battery. The cost to charge the battery = 12.5 × 25 = 312.5 BDT/day (approximately US$3.5/day)
Table 7 shows the payback period for the system. From the above analysis and from Tables 7 and 8, it can be concluded that Case-2 is more favorable.
Estimation of payback period against new installing cost.

PV: photovoltaic; BDT: Bangladeshi Taka.
Life cycle cost estimation.

BDT: Bangladeshi taka.
Figure 13 shows how payback years vary with the variation of cost. Here, an expected price of the PV panel and the turbine have been taken, which is roughly 83,000 BDT (nearly US$1000). But this price may differ in different places. That is why, this graph is offered, which shows the variation of payback year with respect to variation of cost of the system. A typical auto-rickshaw operation age is between 18–20 years without much variation in its performance. 22 Hence, the obtained payback time is satisfactory.
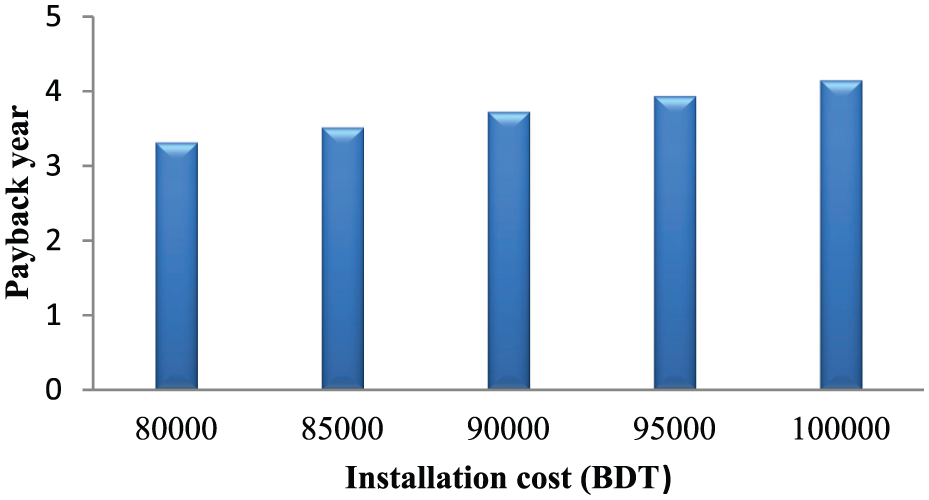
Variation of payback year with the variation of cost.
Life cycle cost estimation
In an effort to improve design of products, cost, and reliability, the life cycle cost assessment is a very efficient method. Calculation of life cycle cost estimation makes use of artificial and numerical neural method in theoretical product design. 23 The method is used in optimizing the design perception in early life cycle stage of a vehicle. It is usually done when the manufacturing of the product is in process.23–28 Here, the life cycle cost estimation is measured taking 20 years as a vehicle life span. Table 8 shows the life cycle cost estimation


The maintenance cost generally workshops equipment cost, material cost, and labor cost.18,19
For calculating COMO, the following data should be considered.
Price per liter of fuel.
Battery price.
Tire price.
Price of annual liability cover.
Accident insurance.
Industrial examination and exhaust emission measurement.

The disposal cost may be minus or plus value depending on the disposal technique. The plus value is obtained if the unprocessed materials are handed to a repudiate collection and the minus value is obtained if the vehicle is disposed by other company. 23 For all these reasons, the disposal cost is not considered here. Here, per liter fuel cost is also not considered, since it is very complicated to forecast life time fuel consumption. That is why, the life time cost estimation is conducted assuming the vehicle would run only on green energy.
Environmental impact
In Bangladesh, the majority of the power plants are thermal power plants. Those thermal power plants are a key source of CO2 gas emission, resulting in destructive greenhouse effect. A 500 MW thermal power plant can produce up to 1 kg/kWh of greenhouse gases.29,30 Figure 14 shows CO2 emission rates of some main power plants of Bangladesh.

CO2 emission rates of some major power plants of Bangladesh.
The proposed vehicle will save roughly 54.18% of total power consumption from national grid if we want to run the vehicle totally by national grid electricity. Here, for making the calculation easy, taking Ghorashal power plant under consideration: daily CO2 emission of the power plant = 14 tons, and maximum electricity supplied by the plant = 35,000 kWh.

If the proposed vehicle is applied in a big city, then let, the number of auto-rickshaws in the city is around 5000 (estimated). From previous calculation, energy savings per day per vehicle = 4.376 kWh. Total energy savings per day = (5000 × 4.476) = 21,880 kWh. The amount of CO2 emissions to produce 21,880 kWh electricity = (13,205 × 4 × 10−4) = 8.752 tons.
Therefore, reduction of CO2 emission by the proposed system = (8.752/14) × 100 = 62.51%.
Therefore, it can be concluded that if the proposed vehicle is implemented in a city of 5000 auto-rickshaws, due to power supplied by renewable energies, total CO2 emissions of the city can be reduced by 62.51% approximately.
Plug-in hybrid system emits approximately 40%–50% less emissions than conventional systems. From calculation, it is found that the vehicle will run on renewable energies for 2.5 h, assuming the rest of the power (46%) will be provided by the engine. Within this time, a conventional vehicle will emit around 8.04 kg CO2 (diesel) and 6.93 kg CO2 (petrol). However, the proposed vehicle will emit 4.824 kg CO2 (diesel) and 4.158 kg CO2, if it is runs by petrol. So, in case of 5000 vehicles, the proposed vehicle will save around 16,080 kg (diesel) and 10,530 kg (petrol) CO2 emissions.
Advantage of proposed vehicle
The advantages of the proposed vehicle are shown in Figure 15.

Advantages of the proposed system over conventional systems.
Conclusion
In this article, renewable energies are used in three-wheeler with a plugged-in hybrid technology. The characteristics, power consumption, and emissions of the vehicle are discussed in detail. Both the renewable energies will provide approximately 54.18% of total power to run the vehicle altogether. Implementation of this sort of vehicle in city areas will reduce huge amounts of pollution. At present, Bangladesh has extremely constraining energy assets of its own; moreover, the grid electricity is not available in many places. This type of vehicle will not only reduce the demand on fuel but also will reduce the pressure on national grid electricity. The implementation and maintenance cost of the vehicle are also very low. In summary, it is interesting to mention some future research considerations of the proposed methodology and vehicle:
The use of microtab with the turbine will increase the efficiency of the turbine, which should be a future research consideration.
The cost analysis should be considered in more detail.
Experimental investigations of the discussed converter must be done in future.
Footnotes
Appendix 1
Handling Editor: Yong Chen
Declaration of conflicting interests
The author(s) declared no potential conflicts of interest with respect to the research, authorship, and/or publication of this article.
Funding
The author(s) received no financial support for the research, authorship, and/or publication of this article.