
Abstract
To detect and recognize any type of events over the perimeter security system, this article proposes a fiber-optic vibration pattern recognition method based on the combination of time-domain features and time-frequency domain features. The performance parameters (event recognition, event location, and event classification) are very important and describe the validity of this article. The pattern recognition method is precisely based on the empirical mode decomposition of time-frequency entropy and center-of-gravity frequency. It implements the function of identifying and classifying the event (intrusions or non-intrusion) over the perimeter to secure. To achieve this method, the first-level prejudgment is performed according to the time-domain features of the vibration signal, and the second-level prediction is carried out through time-frequency analysis. The time-frequency distribution of the signal is obtained by empirical mode decomposition and Hilbert transform and then the time-frequency entropy and center-of-gravity frequency are used to form the time-frequency domain features, that is, combined with the time-domain features to form feature vectors. Multiple types of probabilistic neural networks are identified to determine whether there are intrusions and the intrusion types. The experimental results demonstrate that the proposed method is effective and reliable in identifying and classifying the type of event.
Keywords
Introduction
Nowadays, the sensing technology has become the mainstream of distributed optical fiber perimeter security system applications due to its high sensitivity, immunity to electromagnetic interference, intrinsic safety in volatile environments, high positioning accuracy, wide monitoring range, high reliability, and its cost-effectiveness over large distances. The sensing technologies are distinctly explained in the studies by Wu et al. 1 and Zhang. 2 It is widely used in the distributed perimeter security system such as oil and gas pipelines, the railways, and prisons.
The perimeter security monitoring system based on phase-sensitive optical time-domain reflection (Φ-OTDR) is difficult to effectively eliminate interferences. The accuracy of intrusion recognition is tricky to meet customer requirements, and the identification of several types of intrusion lacks precision. In order to solve the problems mentioned above, there is a need to improve the requirements of fiber vibration signal processing. Therefore, the study of fiber-optic vibration pattern recognition algorithm is particularly inevitable, thus establishing high security performance and limiting high costs. This algorithm includes three parts that are the data preprocessing, the feature extraction, and the classification decision; but the feature extraction of the signal is the key link. The signal feature extraction algorithm is mainly divided into time-domain analysis, frequency domain analysis, and time-frequency domain analysis. Features such as short-term energy and short-term zero-crossing rate are used in the time-domain analysis in order to improve the system performance in S Mahmoud and J Katsifolis 3 and Wu et al. 4 However, the time-domain features of the vibration signals of different intrusion types show the same trend of change before and after any intrusion; it is difficult in that way to accurately identify a variety of intrusion types. The frequency domain analysis adopts the Fourier transform to obtain the spectrum of the vibration signals of different intrusion types and analyzes the amplitude-frequency features to reduce the system false alarm rate in N Fang et al. 5 and A Catalano and FA Bruno. 6 Since the Fourier transform is a global transformation which cannot effectively extract the instantaneous frequency and instantaneous state of nonlinear and non-stationary fiber vibration signals, the wavelet transform is also used in frequency domain analysis to develop the fiber vibration signal at different scales. Then, in Yang 7 and Luo et al., 8 the vibration signals of various intrusion types are identified according to the signal characteristics of different frequency bands or the distribution characteristics of the signal variance amplitude at each scale. In Yousefi et al., 9 the multi-feature parameters (squared difference, short-time over-level ratio, short-time Fourier transform and disturbance duration) are extracted, and the pattern recognition is carried out using the weighted average comprehensive evaluation function. Two-level identification scheme is proposed in Liang et al. 10 and Li et al., 11 which is first placed through the time-domain features, after which the suspected perturbation position is extracted; then the short-term Fourier transform is used to qualitatively analyze the spectral features. However, the essence of the wavelet transform, the weighted average comprehensive evaluation function, and the two-level identification scheme are the windowed Fourier transform, which is still restricted by the indefinite principle. In the time-frequency domain analysis, the time-domain feature is generally used to judge the presence or absence of disturbance and then combined with time-frequency features to determine the type of disturbance. In Zhang et al., 12 an algorithm which combines the time-domain peak with short-term Fourier transform fixed-band energy integral is proposed. The appropriate window function and window length for short-term Fourier transform are selected in the algorithm to obtain the time-frequency amplitude distribution map through the time corresponding to the time-domain peak value of the signal. The energy integration is performed on the amplitude and frequency over a certain period of time to determine the presence or absence of intrusion, but the time and frequency resolution in the short-term Fourier transform is still constrained by the uncertainty principle. At higher frequency resolution, the local detail of the signal cannot be guaranteed. A fiber-optic perimeter vibration signal recognition method based on time-frequency characteristics is proposed in Zhu et al., 13 where the time-domain feature uses short-term energy and short-term average zero-crossing rate. The frequency domain feature adopts the complex wavelet energy distribution characteristics. But this frequency domain feature reflects the distribution of energy in different frequency bands and does not reflect the change of energy with time.
In light of all the problems mentioned above, this article proposes a fiber-optic vibration pattern recognition method based on the combination of time-domain features and time-frequency domain features knowing that the methods mentioned above are all Fourier transforms which are subject to indefinite principles. Thus, the method adopted in this article is empirical mode decomposition (EMD)-based time-frequency which is a method of two-dimensional spectral entropy, and the method is not constrained by indefinite principles. Even if the short-term signal is better for judging whether there is vibration or not, the effect of judging the vibration type is poor. Therefore, in this article, different vibration signals of the same length of time are selected to perform frame division and then the characteristics of the feature are analyzed with time to identify the type of vibration. This method can reflect not only the distribution of the characteristics of the time-frequency domain in the frequency band but also its changes with time.
System design and methodology
During the disturbance of the distributed optical fiber sensing system, the phase and polarization states are more sensitive to the fiber state, resulting from the technique of Φ-OTDR. In H Wu et al. 1 and Z Pan et al., 14 a Φ-OTDR sensing controller device was presented and described. It will inject a strong light of high-frequency stability into the optical fiber, using the photodetector to detect the coherent interference intensity of the scattered Rayleigh light backwards in the pulse range. This technology uses an ultra-narrow linewidth laser as the light source, injects strong coherent light into the sensor fiber, observes the result of coherent interference of backward Rayleigh scattered light in the pulse range, and finally locates the specific position of the disturbance event to perform distributed detection.
Installation of the system
In the implementation of the whole systems, the sensing cable is attached to the perimeter fence from Φ-OTDR sensing controller to the end of sensor located in pit, which is applied to the fence (Figure 1). During an event (intrusion and non-intrusion) case on the fence-cable, the signal generated is detected by Φ-OTDR sensing controller. Afterward, through a fiber-optic vibration pattern recognition method used in this article, the signal is treated. Then, the server which is connected to Φ-OTDR sensing controller via data transfer cable proceeds to the analysis of the data to determine the type of event and to classify it and then presents the results. For a good system performance, the equipment should be of very good quality and attached correctly on the fence.
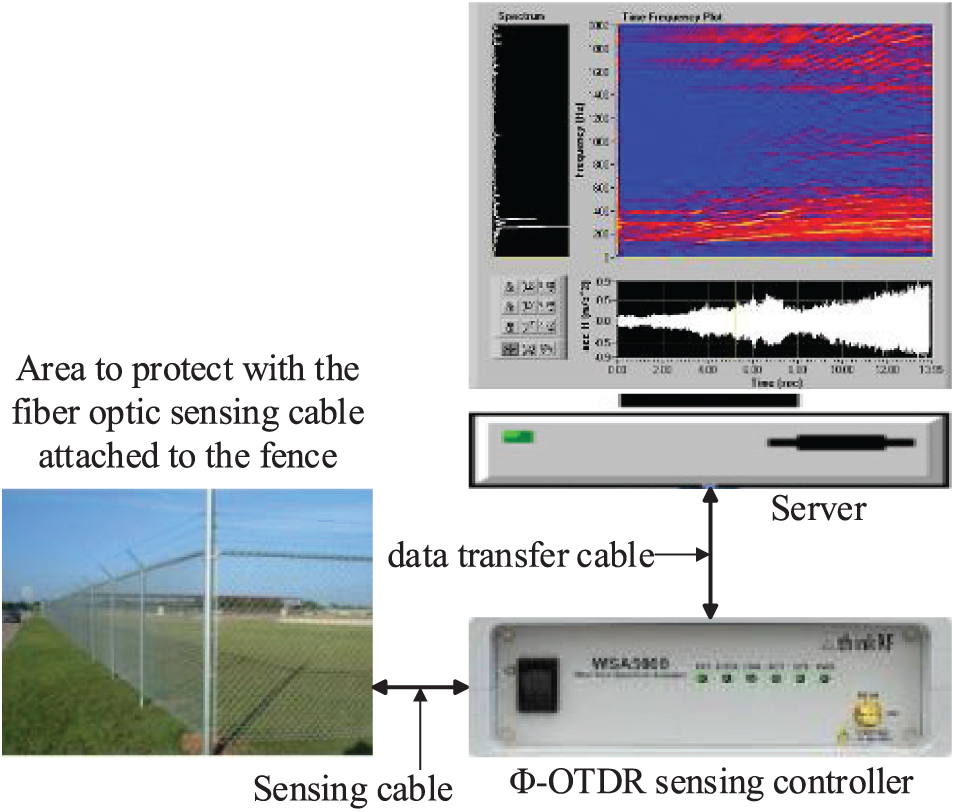
Implementation of the sensor on a fence.
Poor installation brings a non-accuracy of the system whatever the mitigation algorithm used. These system performance parameters—event recognition, event location, and event classification—describe the validity of any perimeter detection system.
Optical fiber vibration pattern recognition
Considering that the system is in a normal state for most of the time and the deliberate intrusion is only a short period of time, in order to improve the system identification accuracy and meet the requirements of multiple intrusion type identification, this article proposes an optical fiber vibration pattern recognition method based on the combination of time-domain and time-frequency domain features. Preprocessing of the fiber vibration signal is carried out to improve the real time and efficiency of the system. A first-level prejudgment is performed through time-domain features, and the vibration signal predicting the intrusion event is used to perform the second-level vibration pattern recognition. The time-frequency domain features are extracted and combined to the time-domain features to form the feature vector, which is trained in various types and input into sample database multi-class model, to determine whether there are intrusions and intrusion types. The method includes four steps, and the overall flow diagram is presented in Figure 2.
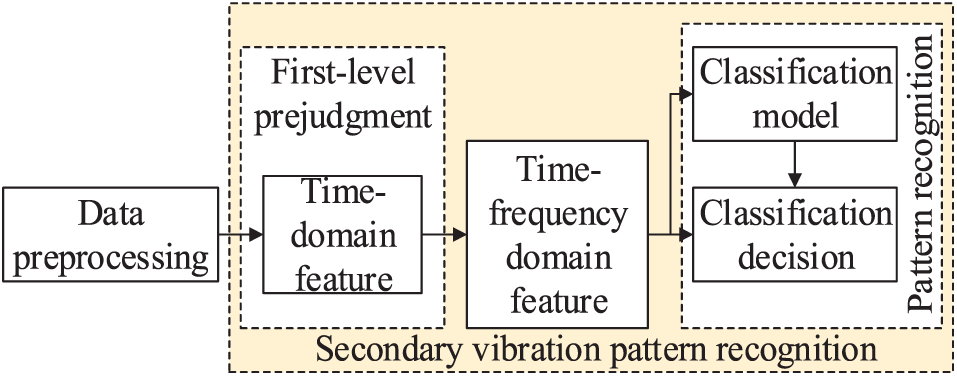
Block diagram of the fiber vibration mode recognition method.
Data preprocessing
There are three processes included in data preprocessing: the data acquisition, the signal de-noising, and the frame division processing. The Φ-OTDR-based fiber-optic vibration detector acquires one-dimensional data, which is collected 10 K times per second, and data of 90 position points are collected at a time. In order to eliminate all kinds of interference effects, and to reduce noise and frame processing, the signal is filtered to facilitate the analysis.
First-level prejudgment of time-domain features
It is discovered that when the system is in the normal state, the amplitude and the fluctuating frequency of the vibration signal are very small; when the system is deliberately invaded, the amplitude and frequency of the vibration signal will increase significantly. To characterize the intrusion intensity and fluctuations, and perform the first-level prejudgment, the short-term energy and the short-term over-threshold rate are used.
Time-frequency domain feature of the secondary discrimination
The first-level prejudgment of time-domain features of the fiber-optic vibration signal suspected of an intrusion event is used for secondary discrimination. By extracting the time-frequency features of the signal, the joint time-domain features constitute the feature vector as the input of the pattern recognition. The time-frequency domain feature is the time-frequency entropy that characterizes not only the energy distribution of different intrusion types of signals in Mandic et al. 15 and Yan et al. 16 but also the gravity center frequency of the signal energy concentration locations of different intrusion types.
Pattern recognition
A packet decomposition method which spreads the signal on different scales to extract the energy distribution as a signal feature is proposed in Wu 17 and Yu et al. 18 It involves the classification method using neural networks, which is easy to train, has fast convergence rate, and is very suitable for real-time processing. Therefore, the method used in this article for pattern recognition is probabilistic neural network (PNN). The eigenvectors of the real-time vibration signals are normalized and input into the multi-class models created in the sample database training to output the intrusion and determine the intrusion types.
Fiber vibration signal preprocessing
To facilitate the extraction of valid data, one-dimensional data are transformed into two-dimensional data of the position-sampling points. The data for the same period of time are selected as the data sample. In this article, K non-intrusion, tapping, and climbing fiber vibrations are selected as data samples; then, the selected data samples are de-noised by an N-order Butterworth filter. After de-noising the data samples, they are divided into frames of length M; each data sample is divided into P frames.
First-level prejudgment of time-domain features of the fiber vibration signals
Considering the actual situation, in this article, the first-level prejudgment is carried out by extracting the time-domain features to predict whether there is intrusion. If the short-term energy

Distribution signals of different fiber vibration signals: (a) non-intrusion, (b) tapping, and (c) climbing.
Fiber vibration signal of secondary vibration pattern recognition
The time-frequency two-level vibration is used in the article because the variation trends of time-domain feature distribution diagrams of different fiber vibration signals are very similar. Using the EMD decomposition and the Hilbert transform to obtain the instantaneous frequency and the instantaneous amplitude of the signal, the time-frequency distribution of the signal is obtained as well. By analyzing the differences in the time-frequency distribution of different signals, the time-frequency entropy is used to quantify the uniform distribution of signal energy in the time-frequency plane. Since the center-of-gravity frequency quantifies the concentrated energy of signals in the frequency band, the time-correlated gravity center frequency is selected to quantify the trend of the concentration of signal energy on the frequency band over time. Finally, the time-domain features are combined with the time-frequency domain features to form the total feature vector for pattern recognition and the intrusion type determination.
Frequency-domain feature analysis of fiber-optic vibration signals
The Fourier frequency is the incarnation of the signal over the entire time range and does not reflect the time-frequency transformation of the signal. Equivalently, the Fourier transform is only applicable to stationary signals or non-time-varying signal. However, the optical fiber vibration signal collected by this system is a non-stationary, nonlinear, time-varying signal, thereby introducing an instantaneous frequency. An instantaneous frequency is a local representation of a signal at a specific time that is relative to an analytical signal. Since the Hilbert transform can constitute an analytical signal, the Hilbert transform is selected. To make use of the analytical signal method to obtain a meaningful instantaneous frequency, this requires that the signal satisfies the following conditions: (1) the signal must be a single-component signal; (2) the signal must be a zero mean and symmetrically above and below the zero mean, with the same number of extremes point and zero crossings. These requirements are the core idea of EMD decomposition. Therefore, in order to obtain a meaningful instantaneous frequency, the signal must be processed by EMD.
EMD and Hilbert transforms
EMD decomposition is to decompose the signal from high frequency to low frequency into a series of smooth and linear single-component signals, that is, intrinsic modal function (IMF). Equation (1) shows the signal decomposition; each of the IMFs decomposed satisfies the requirement for obtaining a meaningful instantaneous frequency, and the Hilbert transform is then used to construct the analytical signal. An analytical signal is a complex signal and the resulting amplitude function is the instantaneous amplitude; the derivative of the resulting phase function is the instantaneous frequency that can be seen from equations (2)–(5). In Huang et al.,19,20 the instantaneous amplitude and the instantaneous frequency change with time


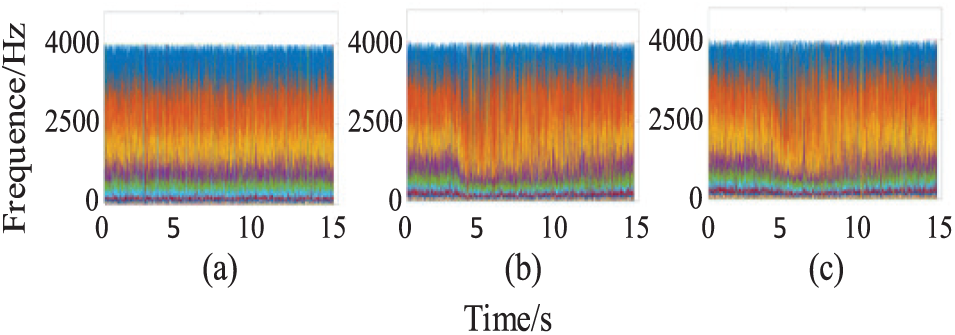
The non-intrusion, tapping, and climbing signals are selected and scrutinized. Hilbert’s time spectrum analysis is displayed in Figure 4. The scanning frequency of the fiber vibration signal collected by the system is 10 kHz. On the basis of Nyquist theorem, the effective frequency band of the time spectrum is 0–5000 Hz. Since the Hilbert transform is not constrained by the indefinite principle, the time resolution and frequency resolution can be determined according to the requirements mentioned above. The time resolution and frequency resolution of Hilbert spectra in the three figures of Figure 4 are the same; the time resolution is 1, the maximum scale of the selected frequency axis is 25, and the frequency resolution is 200. The value of the instantaneous frequency is mapped onto a frequency axis of length 25 to form a time-frequency plane with a time resolution of 1, a frequency resolution of 200, and the instantaneous amplitude is projected onto the time-frequency plane to form a Hilbert spectrum. Thus, the instantaneous amplitude of the Hilbert spectrum is the weight of each time-frequency unit.

Hilbert time spectrum signals of (a) non-intrusion, (b) tapping, and (c) climbing.
In the Hilbert-time spectrum, the greater the instantaneous amplitude weights of the signal, the brighter the color at the time-band element. As shown in Figure 4, for different fiber vibration signals, the instantaneous amplitude of the Hilbert spectrum in the time-frequency plane is different in the weights of each time-frequency unit. It can be seen that the distribution of the instantaneous amplitude of the Hilbert spectrum of different fiber vibration signals varies greatly in the time-frequency plane. The instantaneous amplitude of non-intrusion signals is more evenly distributed on the time-frequency plane. The instantaneous amplitude of the tapping signal is in the low-frequency range, it changes constantly with time, and the distribution is not uniform; in the middle- and high-frequency bands, there is no obvious change with time and the distribution is more uniform. The instantaneous amplitude of a climbing signal changes with time throughout the entire frequency band and is unevenly distributed.
Similarly, the non-intrusion, the tapping, and the climbing signals of the same period of time are selected in order to scrutinize their instantaneous frequency-time distribution chart. As shown in Figure 5, each color represents the instantaneous frequency of each IMF component as a function of time. In the high- and low-frequency bands, the instantaneous frequencies of different types of fiber vibration signals have different degrees of change. In the low-frequency band, the instantaneous frequency of non-intrusion signals does not change significantly with time, while the instantaneous frequency of the tapping signal and the climbing signal decreases with time. As indicated by the dotted line 2, in the high-frequency band, the instantaneous frequency of non-intrusion signal and tapping signal does not change significantly with time, while the instantaneous frequency of the climbing signal has a significant attenuation with time. As a conclusion of this part, in the high- and low-frequency bands, the concentrated locations of different types of fiber vibration signals in the frequency band have different changes with time.
Instantaneous frequency-time profile signals of (a) non-intrusion, (b) tapping, and (c) climbing.
Time-frequency entropy
Information entropy refers to the average degree of uncertainty of the system. If the probability distribution of
In terms of the time-frequency distribution of fiber vibration signals, the instantaneous amplitudes of different types of fiber vibration signals have obvious changes in time and in frequency bands. In order to quantitatively describe this degree of change, time-frequency entropy is then used to quantify the uniformity of signal energy distribution in the time-frequency plane. The more evenly distributed the signal energy is on the time-frequency plane, the greater the time-frequency entropy value; otherwise, the smaller the time-frequency entropy. The signal energy is obtained by taking the instantaneous amplitude of the signal as a square.
In this article, five non-intrusion, tapping, and climbing signals of the same period of time are selected, and the scatter plot of time-frequency entropy of different fiber vibration signals is displayed in Figure 6. It is observed that the instantaneous amplitude of non-intrusion signal is more evenly distributed in the time-frequency plane, so its time-frequency entropy is the largest; the instantaneous amplitude of the tapping signal is unevenly distributed in the low frequency, and the distribution in the middle-high frequency is relatively uniform, so its time-frequency entropy is the second highest; while the instantaneous amplitude of the climbing signal is unevenly distributed in the time-frequency plane, so its time-frequency entropy is the smallest. It can be seen that the time-frequency entropy value can be used as a time-frequency feature to distinguish between non-intrusion, tapping, and climbing signals.
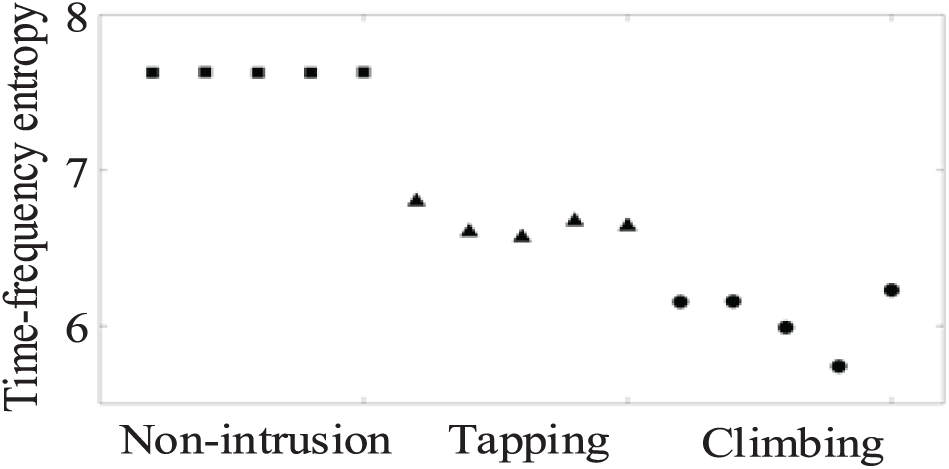
Time-frequency entropy scatter plot of different fiber vibration signals.
Center-of-gravity frequency
According to the description of the instantaneous frequency-time profile in section “EMD and Hilbert transforms,” in the high- and low-frequency bands, the concentrated locations of different fiber vibration signals in the frequency band have different changes with time. The center-of-gravity frequency characterizes the concentrated position of the fiber vibration signal energy in the frequency band. In this article, the time-correlated high-frequency center-of-gravity frequency and low-frequency center-of-gravity frequency are used to quantitatively describe the variation of the concentration position of different signal energies in the high- and low-frequency bands with time.
The non-intrusion, tapping, and climbing signals are still selected, and the frequency distribution of the center of gravity of different types of signals in the low- and high-frequency bands is presented in Figure 7. For the non-intrusion signal, the frequency of the center of gravity is concentrated in the low-frequency band near the 1400 Hz frequency and is concentrated in the high-frequency band around the 3600 Hz frequency, without obvious change with time. For the tapping signal, the frequency of the center of gravity is significantly attenuated with time in the low-frequency band and is concentrated near the frequency of 3600 Hz in the high-frequency band, without significant change with time. The center of gravity of the climbing signal varies significantly with time in both high- and low-frequency bands. It can be seen that the associated high-frequency center-of-gravity frequencies and low-frequency center-of-gravity frequencies can be used as time-frequency features to distinguish between non-intrusion, tapping, and climbing signals.

High- and low-frequency band distribution of the center-of-gravity frequency signals.
Time-frequency domain feature extraction method
Figure 8 shows the flowchart of the time-frequency feature extraction process for optical fiber vibration signals. The steps used for extracting the time-frequency features of optical fiber vibration signals are as follows:
Perform EMD processing on each data sample to obtain a series of IMF components.
A Hilbert transform is performed on each IMF component to obtain an analytical signal, thereby obtaining the instantaneous frequency and the instantaneous amplitude of each component. The maximum scale of the selected frequency axis is
The time period of Hilbert spectrum time-frequency plane is divided into
Calculate the energy
Calculate
The time spectrum divided into
In the low-frequency band, the time period of the spectrum is still divided into

Time-frequency feature extraction method flowchart.
The time-domain feature
Fiber-optic vibration signal pattern recognition
PNN is a neural network with supervised learning that needs to calibrate the intrusion type corresponding to the feature vector, with non-intrusion scale of 1, tapping scale of 2, and climbing scale of 3. The time-domain feature vector of the data sample is combined with the time-frequency domain feature to form the total feature vector
Experimental demonstration and result analysis
The experimental environment is a Windows 7 server, 64-bit operating system, the processor is Intel(R) Xeon(R) CPU E5-2620 v3 @ 2.40 GHz 2.40 GHz (2 processors) with 16 GB of memory; and the programming is carried out on MATLAB R2014a (8.3.0.532).
Verification of program validity
The system collects 240 non-intrusive, 90 tapping, and 90 climbing fiber-optic vibration signals with a total of K = 360 data samples. Each data has P = 24 frames with the length of M = 0.4096s; and the selected data is de-noised by an N = 6 Butterworth high-pass filter.
In the first-level prejudgment of the fiber vibration signal, the short-term energy threshold
In the second-level pattern recognition method of the fiber vibration signal, the maximum scale of the selected frequency axis is
Events accuracy analysis
According to the steps given earlier, the joint feature vector of the time-domain and the time-frequency domain is used as input into the PNN, and the intrusion type can be obtained as output, thereby obtaining the recognition accuracy of non-intrusion, tapping, and climbing signals. The recognition accuracy rates of different types of fiber vibration signals under different characteristics are presented in Table 1.
System identification accuracy.
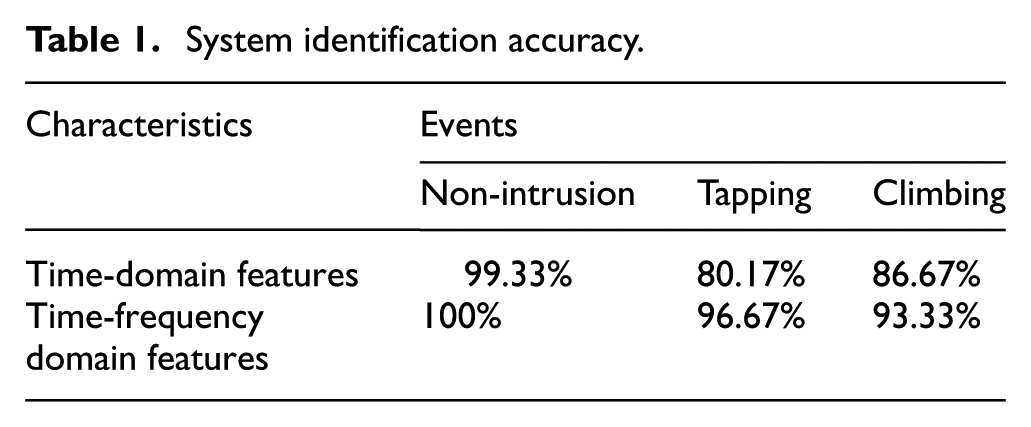
Comparing the time-domain feature with the time-frequency domain feature, the recognition accuracy of the events types (non-intrusion, tapping, and climbing) is improved.
Conclusion
In order to improve the recognition accuracy and meet the needs of multiple intrusion type recognition, this article proposes a fiber-optic vibration signal recognition method based on the combination of time-domain features and time-frequency domain features. According to the time-domain features of different vibration type signals, the first-level prejudgment of the intrusion events was carried out; then, the EMD processing and Hilbert transform were used to obtain the time-frequency distribution of the signal. The time-frequency entropy and the center-of-gravity frequency were introduced, and combined with the time-domain features to form the feature vector, which was input into multi-class model in the PNN for training and testing the data; thus, determining whether there is intrusion and generating the intrusion type. From the different stages of the experiment, it was discovered that the accuracy of non-intrusion recognition can reach 100%, while the accuracy of tapping recognition can reach 96.67%, and the climbing accuracy recognition can reach 93.33%, which indicates that the method is reliable and effective in identifying vibration conditions.
The shortcoming of this article is that the system data processing time is about 4.3704 s which is far greater than the real-time data acquisition time of 0.4096 s, and the probe response time is about 4.78 s (ignoring the delay redundancy) which is quite greater than 2 s. In fact, there is no improvement on the endpoint effect generated during the EMD decomposition process, and this will be future research to complete in this area.
Footnotes
Handling Editor: Fei Yu
Declaration of conflicting interests
The author(s) declared no potential conflicts of interest with respect to the research, authorship, and/or publication of this article.
Funding
The author(s) disclosed receipt of the following financial support for the research, authorship, and/or publication of this article: This work has been supported by the National Natural Science Foundation of China (Nos 61672338 and 61673160).