
Abstract
Spot welding of dissimilar materials can utilize the respective advantage comprehensively, of which reliable prediction of fatigue life is the key issue in the structure design and service process. Taking into account almost all the complex factors that have effects on the fatigue behavior such as load level, thickness, welding nugget diameter, vibrational frequency, and material properties, this article proposed an energy dissipation-based method that is able to predict the fatigue life for spot-welded dissimilar materials rapidly. In order to obtain the temperature gradient, the temperature variations of four-group spot-welded joint of SUS301 L-DLT stainless steel and Q235 carbon steel during high-cycle fatigue tests were monitored by thermal infrared scanner. Specifically, temperature variation disciplines of specimen surface were divided into four stages: temperature increase, temperature decrease, continuous steady increase in temperature, and ultimate drop after the fracture. The material constant C that a spot-welded joint of dissimilar material needs to reach fracture is 0.05425°C·mm3. When the specimen was applied higher than the fatigue limit, the highest error between experimental values and predicted values is 18.90%, and others are lower than 10%. Therefore, a good agreement was achieved in fatigue life prediction between the new method and the validation test results.
Introduction
High speed, heavy load, energy saving, safety, and comfort are the main features of Chinese high-speed train technology, and the lightweight structure is an effective way to achieve the above goals. The SUS301 L-DLT austenitic stainless steel train is widely used by the advantages of light weight, well corrosion resistance, high tensile strength, and safe performance. Q235 low carbon steel possesses the fine weldability and hardening capacity. Thus, most low carbon steel welded joints and heat-affected zone have higher hardness than the parent materials. Some frameworks of trains are manufactured by the connection method of dissimilar material spot-welded joint of SUS301 L-DLT stainless steel and Q235 carbon steel, on one hand, which has comprehensive utilization of the both advantages. On the other hand, it can overcome the joint strength reduction resulting from large welding deformation of traditional thin plate arc welding. However, overload mechanical performance and fatigue property of the two materials and the fracture mechanism are completely different.1,2 So, the reliable prediction of the fatigue life of the dissimilar material spot-welded joint is an important part of the structure design process. 3 While there are some limitations to the traditional fatigue test method, for example, time-consuming test period, overmuch demand for specimens, and large dispersion of the data, 4 many factors make the reliable determination of fatigue life a tough practical problem.
Temperature variation, as the associated phenomena in the fatigue process, is critical to the study of thermal dissipation and thermodynamic analysis of fatigue behavior. 5 The physical state and mechanical properties of material fatigue damage can be studied by analyzing the temperature change in the fatigue process. The application of infrared (IR) thermography which possesses the advantages of real-time display, wide-view horizon, non-touch monitor, and non-destructive detection to investigate the fatigue process and predict the fatigue properties of materials and components has been globally blossomed in the past several decades.6–10 After 15 years of concentrative study, Risitano Research Group 11 put forward that the fatigue limit of specific load level can be determined with the help of the thermographic technique. When the optimal matching curve between the load levels and the stationary temperature increments is extrapolated down to zero, the value of abscissa can be defined as the fatigue limit. Thanks to that, it is not only to carry out the test up to fracture but also does not need to reach the stable temperature increase; the method was proved to be a rapid tool for the fatigue limit assessment. According to the research of Luong, 12 when the applied stress is lower than the fatigue limit, the temperature rise in the specimen surface also occurred. The fatigue limit could be obtained by intersecting the two fitting lines between the stable temperature and the load levels, which are, respectively, lower and higher assigned applied stresses. Crupi et al. 13 took advantage of the Risitano method to realize the prediction of fatigue life for butt welded joints, which was manufactured of AH36 shipbuilding steel. The predicted values of the fatigue behavior by the method are identical to those from the traditional experiment. In addition, Amiri and Khonsari14–16 used first stage of the temperature evolution during fatigue test to predict the fatigue life of ferritic steel. Fargione et al. 17 put forward the hypothesis that the energy dissipated to fatigue failure is a constant for a particular material or a mechanical component.
These thermometric approaches have been verified by many research achievements, while they are restricted to phenomenological thermographic type and do not deep into the physical nature of fatigue. The essence of temperature revolution is the transformation of energy that the material or component absorbed from external cyclic load. The energy evaluation during cyclic loading made by Morrow 18 is of great significance. Based on the relationship between stress and strain of the cyclic process, hysteresis loop was introduced to compute the plastic strain energy, and then the energy consumption per week was obtained. Subsequently, Tchankov and Vesselinov 19 came up with a scheme based on total consumed hysteresis energy to fracture for fatigue life evaluation. This way does not require any extra procedure for counting miscellaneous cycles. A reasonable verification was carried out using 35 types of steels. The loading modes include various forms, for example, random loading, impulse amplitude, or uniform distribution of stresses. Skelton 20 designed a thermomechanical fatigue (TMF) test with a full strain scale of 0.6%. The minimum and the maximum temperature limits are 270°C and 570°C, respectively. In need to be noted that the cycle test time was 5 min. A project is carried out to depict the practical profile of every hysteresis loop from the tests.
Although many achievements have been gained in present researches, they principally concentrated on steel, aluminum alloy, and some non-metallic materials. Investigations of welded component, especially spot-welded joints of dissimilar materials, are rarely investigated by combining the IR thermography and energy dissipation theory. In this article, IR thermography was employed to study and analyze the temperature revolution discipline of spot-welded joint of SUS301 L-DLT stainless steel and Q235 carbon steel during high-cycle fatigue test. Theoretically, an energy dissipation-based fatigue life prediction model is set up for spot welding of dissimilar materials. The theoretical models were formulated to predict the fatigue life, and a material constant C that a spot-welded joint of dissimilar material needs to reach fracture was obtained. Finally, the fatigue life of the experimental results and the predicted values are consistent with each other. The research achievement in this article can be conducive to uncover and explore the fundamental theory of the relationship that lies between fatigue behavior and energy dissipation, and it presents the underlying implication in the process of design, manufacture, and service reasonably and securely for spot-welded joint.
Theoretical modeling
Fatigue is an irreversible process of energy dissipation. During the fatigue process, external mechanical energy is absorbed into experimental material, and it has a direct relationship with the fatigue life.21–23 From the perspective of energy, various complex damage mechanisms of fatigue can be physically analyzed. Under cyclic loading, the mechanical energy W consumed by the unit volume material in a cycle is converted into two parts, and some of the energy Q dissipates in the modality of heat. Another part in the energy U results in changing of internal energy in materials. According to the first law of thermodynamics, 24 this process of energy transformation can be expressed by equation (1)

Heat dissipation Q consists of three forms, heat convection, heat radiation, and heat conduction, which can be expressed as Qcv, Qir, and Qcd, respectively

The change of internal energy U includes two parts: the internal energy change caused by the increase in the temperature of the material, shown as Ut; the other part is the so-called energy storage ΔUs, which is related to changes in the microstructure of the material, such as the rearrangement of the defect of the crystal and the formation of the slip belt

For materials with volume V, the internal energy change Ut in a cycle is 25

where ρ is the material density, f represents the vibrational frequency, the implication of parameter c is the material specific heat, and
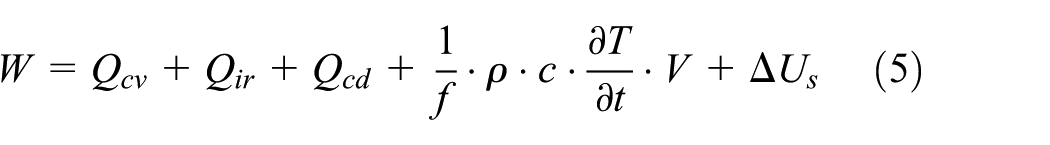
Under the action of cyclic load, the temperature change of materials is mainly caused by the movement of the inner defects of the material such as dislocations that result in the change of material microstructure. Therefore, when studying the temperature evolution curve of the material under cyclic loading, it is necessary to have a correct understanding of the inner physical process of the material during the fatigue process. This article aims to explore the microscopic physical processes of the spot-welded joint of dissimilar materials behind the phenomenal temperature variation under the condition of cyclic loading. The whole fatigue experiment system is in a completely closed laboratory. In order to simplify the analysis, we can consider the high-cycle fatigue test in adiabatic condition. At this point, in each cycle, the heat dissipation Q can be neglected and the mechanical energy W consumed by the specimen is only converted into internal energy changes. However, the amount of the energy storage, ΔUs, is related to the dislocation density of the material. Because of the low load level of the spot-welded joint of dissimilar materials compared to base metal, the number of dislocations is small and it increases slowly. Therefore, it can be considered that the mechanical energy W consumed by the fatigue specimens in every cycle is almost equal to the change of internal energy caused by temperature rise, which can be shown as

For high-cycle fatigue behavior, Zhang et al. 25 discovered that the total expended mechanical energy corresponding to failure was assumed to be a constant which depends on temperature and material and has nothing to do with loading history. Hence, hypothesis can be concluded that the total mechanical energy need to be consumed when a given specimen breaks is Wf, a constant. Meanwhile, Feltner and Morrow 26 deemed that the mechanical energy consumed in every cycle of the experimental material is nearly a constant when the fatigue life of the material is beyond 5 × 10⁴. Therefore, the relationship between the total mechanical energy Wf required for material fracture and the fatigue life Nf is shown as

In this work,

where D is the diameter of welding nugget on the side of SUS301 L-DLT stainless steel and t1 is the thickness of the SUS301 L-DLT stainless steel. Substituting equation (8) into equation (7), so far, the energy dissipation model for fatigue life prediction of the spot-welded joint of SUS301 L-DLT stainless steel and Q235B carbon steel is constructed as

Considering

where
Experimental procedure
Materials and methods
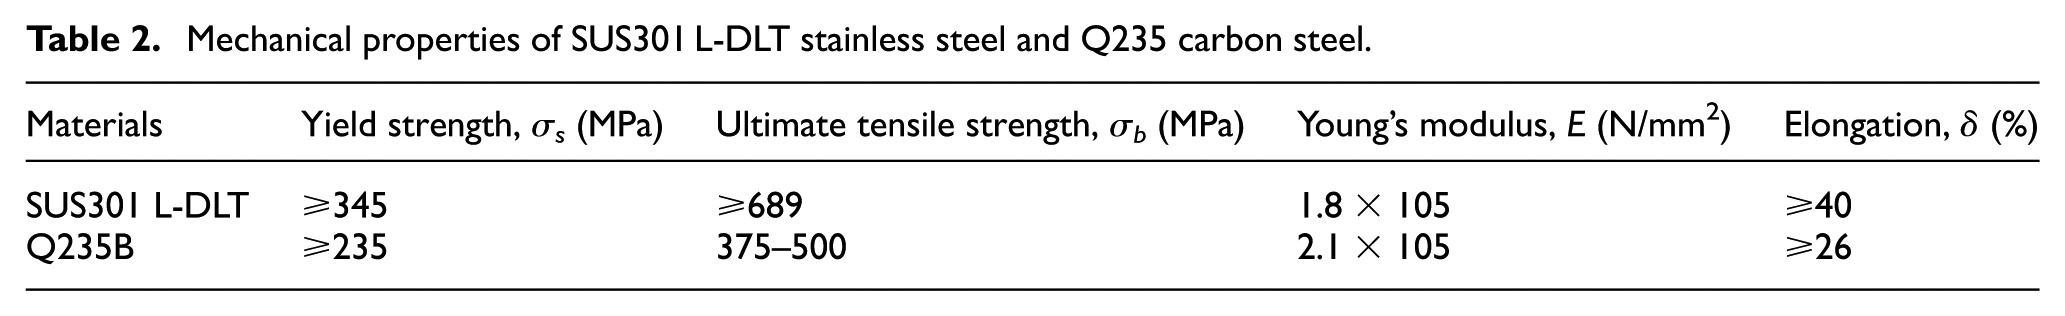
In the experiment, SUS301 L-DLT stainless steel and Q235B low carbon steel were selected, and double-sided single-spot welding of the dissimilar materials was carried out. Chemical components and mechanical properties of the materials are illustrated in Tables 1 and 2, respectively.27,28 In order to ensure the quality of resistance of spot-welded joints, pre-welding treatment was carried out on the surface of the joints to remove surface dirt and oxidation films, which can make the contact resistance small and uniform. It is the main premise to ensure the quality of spot welding and the stability of tests. The resistance spot welding test was carried out on the suspension spot-welding machine. The electrode material is CrZrCu. The diameter of the electrode is 22 mm, the radius of the electrode tip is 100 mm, and the electrode travel is 30 mm. According to JIS Z3140-2000, JIS Z3139-2000 standard, appearance, smoothness, and cross section were detected.
Chemical components of SUS301 L-DLT stainless steel and Q235 carbon steel (wt%).

Mechanical properties of SUS301 L-DLT stainless steel and Q235 carbon steel.
Fatigue test
Different spot-welded joints of five combination of various thickness were designed along the extrude direction according to the configuration in the article. Four groups of specimens named Test 1 to Test 4 were prepared for identification of the proposed model, whereas one group of specimens named Verification 1 was prepared for validation. Dimensions and materials are as reported in Figure 1 and Table 3. Fatigue tests of various load levels, with the load ratio of 0.1, were conducted under uniaxial cyclic load on a ±100-kN high-frequency electro-magnetic fatigue experiment machine under normal environment. The adopted test frequencies varied from 110 to 150 Hz according to the geometric shapes of the five groups of fatigue samples. Fatigue tests were run until specimens completely fracture or reach 2 × 10⁶ cycles, by which staircase method is used to gain the fatigue limit. Initial load level and load stair of the groups were selected according to preliminary work.

Geometry of the spot-welding fatigue test specimens.
Categories and dimensions of the spot-welding fatigue test specimens.

Temperature measurement
In this study, black matt varnish was painted on the surface of the specimens so that reflections from the environment can be avoided and their emissivity can be magnified, which can guarantee a more accurate measurement results. Surface temperatures at the welding molten nugget and plastic ring on the SUS301 L-DLT stainless steel side of the spot-welded joint were supervised via a high-performance IR scanner Fluke Ti450. The thermographic pictures can be captured at a frequency of 9 Hz and maximum resolution of 384 × 288 pixel. The IR scanner was placed ahead of the fatigue test specimen with a distance of approximately 30 cm so as to monitor the whole view of the specimen. Afterwards, the pictures were handled with the Fluke Smart software to read the initial temperature, and then filtering processing was carried out to eliminate the elastic vibration effect and the changes of environmental conditions.
Results and discussion
Stair fatigue test results and analysis
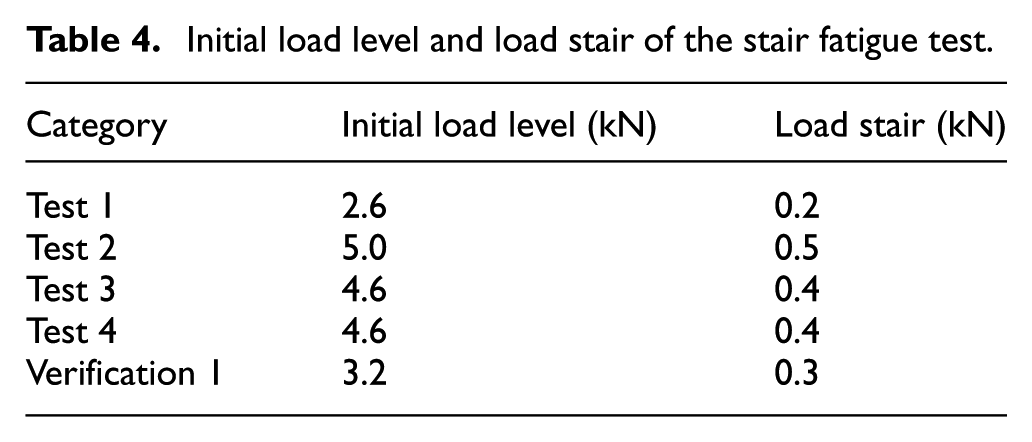
Aforementioned in section “Fatigue test,” initial load level and load stair of the specimens were selected based on the tensile strength of the preliminary test and experience, as expressed in Table 4. According to GB/T15111-94 standard for spot-welding joint shear tensile fatigue test method, 2 × 10⁶ is set as the judging standard for fatigue test. When the specimen run to reach the 2 × 10⁶ cycle and does not display obvious macroscopic crack, it is labeled as a “pass,” otherwise labeled as a “not pass.” The fatigue load applied on the fatigue specimen started from the initial load level. If the specimen failed to pass in the previous test, the load would be reduced by a load stair in the next test. On the contrary, it increased by a load stair.
Initial load level and load stair of the stair fatigue test.
The fatigue test under the same loading frequency and stress ratio was repeated as per the rule. According to GB/T24178-2009 standard for metal material fatigue test data statistical scheme and analysis method, at least eight specimens and four evenly spaced load levels were used to interpret the test, and two samples of every load level are tested, the results of which are shown in Figure 2.

Stair fatigue test data distribution of the four groups of tests: (a) Test 1, (b) Test 2, (c) Test 3, and (d) Test 4.
According to the statistical analysis of the test data, the fatigue limits corresponding to the four groups of spot-welding joints at 2 × 10⁶ cycles are as follows


By comparing Test 1 and Test 2, a conclusion can be drawn that the fatigue limit rises when both of the materials become thicker. Through comparing Test 1 and Test 3, and Test 3 and Test 4, we can find that no matter which one of the two materials become thicker, the fatigue limit can increase. As a result, increasing the thickness of the materials of the spot-welding joint can increase the fatigue limit greatly. When Test 3 and Test 4 are compared to Test 2, it is worth noting that blindly increasing one part of the spot-welded joint is inferior to the both thicker plates. So, increasing both parts of the spot-welded joint properly can improve fatigue strength remarkably.
Temperature variation results and analysis
As mentioned in section “Theoretical modelling,” the fatigue life of the spot-welded joint of SUS301 L-DLT stainless steel and Q235B carbon steel can be evaluated by the gradient change rate of the total temperature variation. Hence, here, we focused on the temperature variation change versus fatigue cycle. It should be noted that the measured temperature range is the relative temperature rise which has removed the room temperature. In this work, the temperature monitored with the scanner is regarded as a representative of how much changed within the whole gauge section of the spot-welded joint fatigue specimen.
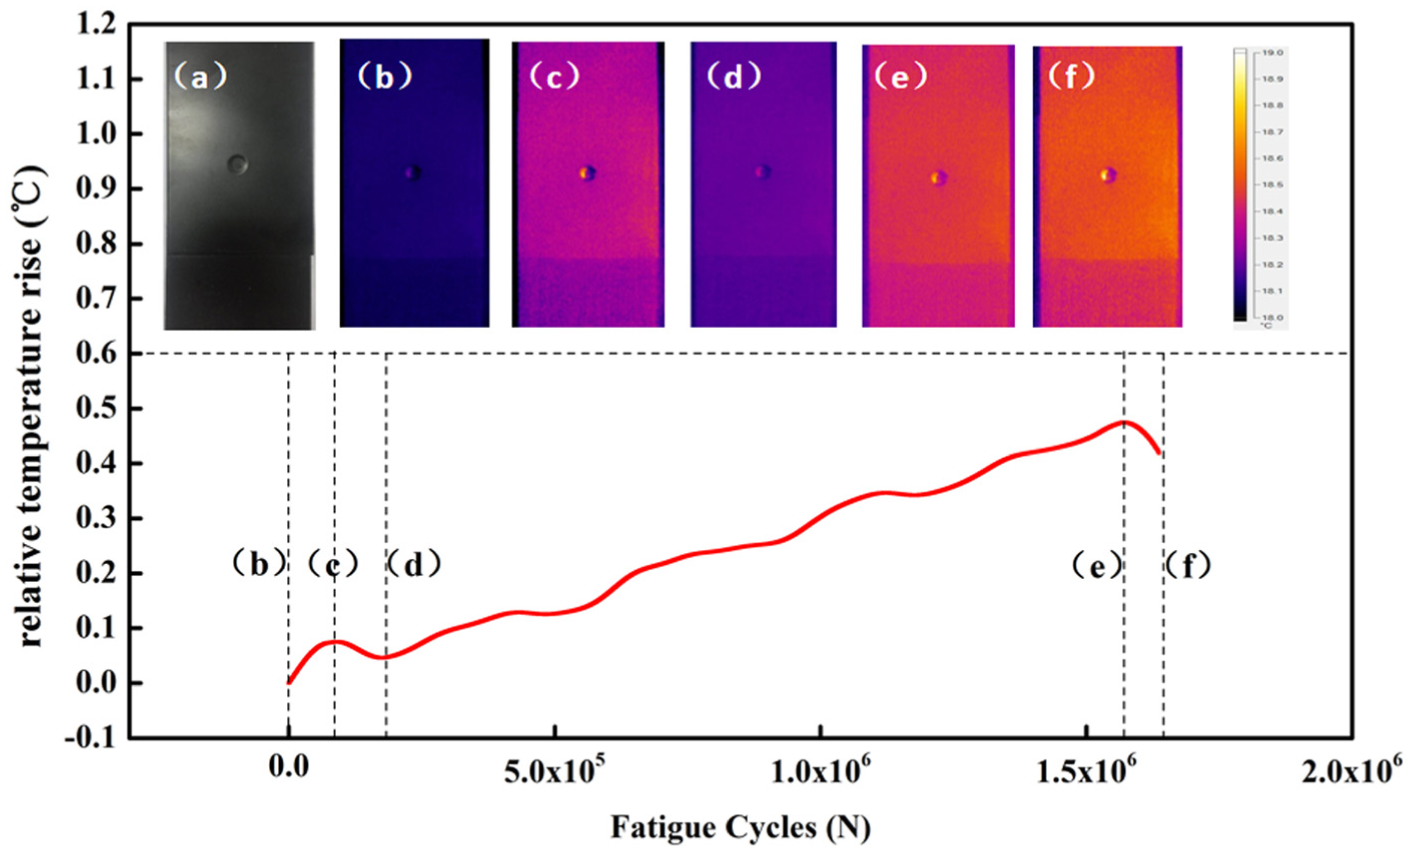
Next, the temperature variation of spot-welded joints between SUS301 L-DLT stainless steel and Q235 carbon steel under cyclic loading will be analyzed. One attempted specimen of Test 1 group under cyclic loading is taken as an example, which is exhibited in Figure 3. When the specimen ran 1,637,078 cycles, it fractured. Figure 3(a) shows the photograph under the visible light, and Figure 3(b)–(f) shows the key time node of the whole fatigue life. A closer observation of the temperature evolution indicates that the mean temperature of the specimen consists of four stages.
Temperature revolution of the attempted specimen.
In stage I (Figure 3(b) and (c)), once the test starts, the temperature continues to rise at a fast and constant rate, which is a macroscopic manifestation of the physical change of microscale. From the microscopic scale, the plastic deformation in material is the reflection of dislocation motion, and the size of plastic deformation is related to the number of dislocations. Under the action of external cyclic loading, the movable dislocation of the material first occurs. However, on one hand, the number of movable dislocations was less before the test. Furthermore, because the load level is beyond the fatigue limit and below the yield strength, macroscopic plastic deformation will not occur in the material; when the dislocation runs into the boundary, sub-boundary, and precipitation phases, movement will be impeded. At the early stage of cyclic loading, the fast propagation of dislocation source is not realized due to the short loading time. In this case, the microstructural change is limited, which almost will not produce the inner surface of the micro-cracks, thus energy storage ΔUs accumulated inside the material is very less. So, most of the mechanical energy the material consumed is used for temperature rising, and stage I shows a high temperature rising rate.
In stage II (Figure 3(c) and (d)), a small drop in the temperature is displayed. There is no precise physical connotation of such phenomenon that is well recognized. A possible assumption was raised under the foundation of the atomic construction in the specimen. 29 An undamaged specimen could be considered which is of locally disordered atomic state, while it presents a globally ordered condition. When loaded externally, the specimen transforms from a comparatively less-ordered state to a more well-aligned state. From the perspective of thermodynamics, the specimen is certainly cooled down which leads to the small drop. Thus, the rising rate of temperature variation could be determined once the specimen reaches a more ordered condition. Stage II is so short that it does not appear in some other temperature evolutions, especially for the specimen loaded under higher loading level.
In stage III (Figure 3(d) and (e)), the temperature increases gradually at a relatively constant speed. Naderi and Khonsari
9
and Jiang et al.
30
considered that due to the process of fatigue specimen under the influence of convection, radiation, and heat conduction, when testing time is long enough, there is a large temperature gap deviation between the surface of the specimen and the laboratory environment, thus the heat loss of the specimens is accelerated. While as previously mentioned, when the material is under adiabatic condition, the heat generated by the specimen will not dissipate by convection, radiation, and conduction. In the present fatigue experiment, the closed-laboratory environment can be nearly regarded as the adiabatic condition. The mechanical energy consumed by the fatigue specimen is applied to the change in the internal energy of the material, which will result in the temperature increase in the specimen. Dynamic equilibrium is achieved to make the increasing temperature reach an approximately constant value, and the temperature gradient
In stage V (Figure 3(e) and (f)), the temperature gradually decreases after the fatigue specimen fractures. This stage happens after the fatigue fracture, thus it is not the focus of the investigation.
Temperature variation results of different joint dimension
It has been discussed earlier that the energy dissipation of the spot-welded joint is considered to be a constant value under various fatigue loading. Thus, the evolution of temperature versus number of cycles of the four fatigue test groups is shown in Figure 4. For every test group, five load levels around the fatigue limit, which is gained in section “Stair fatigue test results and analysis,” or several load stairs higher than it are selected.

Temperature variation of the fatigue test groups: (a) Test 1, (b) Test 2, (c) Test 3, and (d) Test 4.
As can be seen from Figure 4, the endurance of stage III almost occupies the whole fatigue and depends on the load level observably. Once the load levels are beyond the fatigue limit, the temperature gradient of stage III increases rapidly as the increase in stress, whereas for the stresses below or near the fatigue limit, the temperature gradient of stage III is nearly zero.
Determination of material constant C
As revealed in Figure 4, the temperature gradient is strongly dependent on loading level. The temperature gradients of the all four fatigue test groups under each loading level are obtained by linear fitting, which are listed explicitly in Table 5. According to equation (10), in order to acquire the material constant C, the relevant fatigue test parameters of the four groups are also involved. Ultimately, the material constant C is calculated and listed on the far right in the table, of which, the unit °C·mm3 is deduced from equation (10).
Parameters to determine the material constant C.

Next, the material constant C of the four test groups is used to construct the following histogram, as shown in Figure 5. In total, 20 bars are labeled as two colors. For the blue ones, it can be discovered in Table 5 that they ran to reach the cycle of 2 × 10⁶ without fracture. Thus, there was remaining energy that had not been consumed, so that they cannot be utilized to calculate the material constant C and are discarded. For the red ones, they failed within 2 × 10⁶ cycles. Based on the previous theory, when they were fractured, the consumed energy is a constant. Eventually, the average of the material constant C is 0.05425°C·mm3. So far, the material constant C is obtained and the fatigue life of spot-welded joint between SUS301 L-DLT stainless steel and Q235B carbon steel can be predicted rapidly.

Determination of the material constant C.
Model verification
For the purpose of verifying the prediction method, the group of Verification 1 was measured under the entirely same experiment conditions as the four test groups, and fatigue limit is 3.275 kN through the stair fatigue test. The fatigue life experimental values and predicted values of six load level are compared in Table 6 and the predicted error δ is defined as

Comparison of fatigue life between the experimental values and the predicted values.
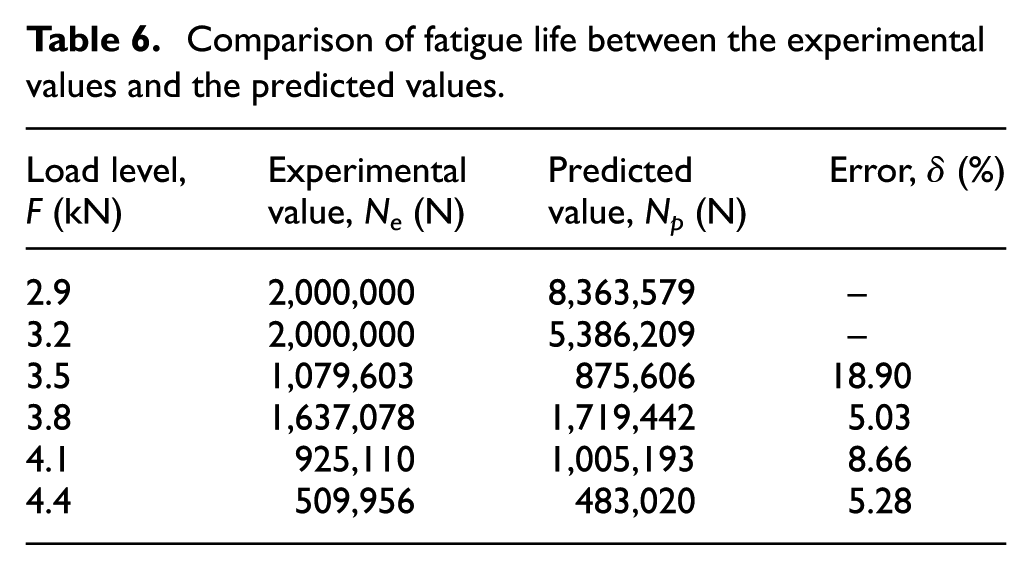
It is worth noting that when the specimen was applied with 2.9 or 3.2 kN, both which are lower than the fatigue limit 3.275 kN, the specimen ran to reach the cycle of 2 × 10⁶ without fracture. There was remaining energy that had not been consumed, so that the predicted fatigue life is beyond 2 ×10⁶, thus the prediction model loses efficacy. For the rest, the highest error is 18.90%, and others are all lower than 10%. Therefore, the fatigue life of the experimental results and the predicted values are consistent with each other.
Conclusion
Based on the energy dissipation theory, a rapid fatigue life prediction method is proposed for spot-welded dissimilar materials of SUS301 L-DLT stainless steel and Q235 carbon steel. The following conclusions can be made:
Temperature variation of the four-group dissimilar material spot-welded joint of SUS301 L-DLT stainless steel and Q235 carbon steel under various load levels was monitored via thermal IR scanner. Specifically, temperature variation discipline of specimen surface was divided into four stages: temperature increase, temperature decrease, continuous steady increase in temperature, and ultimate drop after the fracture.
Fatigue limit corresponding to the four groups of spot-welded joints at 2 × 10⁶ cycles is 2.65, 5.125, 4.2, and 4.6 kN, respectively. Increasing the thickness of the materials of the spot-welded joint can increase the fatigue limit. However, it is worth noting that blindly increasing one part of the spot-welded joint is inferior to the both thicker plates. Increasing both part of the spot-welded joint properly can improve fatigue strength remarkably.
The theoretical models based on energy dissipation theory were formulated to predict the fatigue life, which can take into account almost all the complex factors that have effects on spot-welded joint fatigue behavior such as load level, thickness, welding nugget diameter, vibrational frequency, and material properties. The material constant C that a dissimilar material spot-welded joint needs to reach fracture was obtained as 0.05425°C·mm3.
When the specimen was applied with lower load level than the fatigue limit, there was remaining energy that had not been consumed, so that the predicted fatigue life is beyond 2 × 10⁶, thus the prediction model loses efficacy. For the rest, the highest error is 18.90%, and others are all lower than 10%. Therefore, the fatigue life of the experimental results and the predicted values are consistent with each other.
Footnotes
Handling Editor: Jan Torgersen
Declaration of conflicting interests
The author(s) declared no potential conflicts of interest with respect to the research, authorship, and/or publication of this article.
Funding
The author(s) disclosed receipt of the following financial support for the research, authorship, and/or publication of this article: This study was supported by the Natural Science Foundation of China (no. 51875072).