
Abstract
The dynamic wheel–rail responses during the rolling contact process for high-speed trains were investigated using the explicit finite element code LS-DYNA 971. The influence of train speed on the wheel–rail contact forces (including the vertical, longitudinal, and lateral forces), von Mises equivalent stress, equivalent plastic strain, vertical acceleration of the axle, and the lateral displacement of the initial contact point on the tread, were examined and discussed. Simulation results show that the lateral and longitudinal wheel–rail contact forces are very smaller than the corresponding vertical contact forces, and they seem to be insensitive to train speed. The peak value of dynamic vertical wheel–rail contact force is approximately 2.66 times larger than the average quasi-static value. The elliptical wheel–rail contact patches have multiple stress extreme points due to the plastic deformation of the wheel tread and top surface of the rail. The vertical acceleration value of the axle in the steady condition is around ±5 m/s2 for the perfected wheel–rail system with the running speed below 300 km/h.
Introduction
High-speed railways have been developed rapidly for the past two decades in many countries around the world. It is especially prominent in China since 2008—the commercially running mileage has exceeded 20,000 km to date, and the operating speed of high-speed trains ranges from 200 to 350 km/h. However, the increasing train running speed surely requires the higher service safety performances closely related to the dynamic performance of the train/track coupling system.1–5 The wheel–rail system, as an essential and important component of the train/track coupling system, is directly subjected to all the train loadings and it therefore plays a vitally important role in guaranteeing the running safety and riding comfort.6–8 The serious failures of wheel–rail systems in service will cause a series of disastrous consequences and great economic loss.9–11 The wheel–rail interaction issues have been widely studied in the past decades, mainly using the multi-body dynamics (MBD) approach and newly developed finite element method (FEM).2,5,9,12–18 The advantages of FEM over MBD in simulating the wheel–rail rolling contact behavior, especially for the high-speed cases, have been discussed in detail by Jing and Han, 16 since the strong nonlinearities and dynamic effects must be considered then.
Therefore, a three-dimensional wheel–rail rolling contact finite element (FE) model was built to investigate the dynamic wheel–rail response in this study. The influence of train speed on the characteristics of the typical dynamic wheel–rail responses—the wheel–rail contact forces (including the vertical, longitudinal and lateral forces), the lateral displacement of the initial contact point on the tread, vertical acceleration of the axle, and related von Mises stress and equivalent plastic strain—was explored and discussed.
FE modeling
Considering a typical wheel–rail system for CRH3A trains, the corresponding three-dimensional FE model comprising two wheels, one axle, and two rails was built using the commercial software HyperMesh 13.0, as shown in Figure 1. The actual hollow axle was equivalent to a solid axle with the same outside dimension and mass, by varying the input material density parameter, for the convenience of applying the two concentrated forces representing the axle load to the centerline of the rotating axle. The wheels have a S1002CN tread and the diameter of 860 mm, while the rails are of the CN60 rail and have a base slope of 1:40. To balance the computational cost and precision, the treads of wheels were fine meshed into 1 mm × 1 mm × 1 mm and the top surfaces of rails were meshed into 2 mm × 2 mm × 2 mm using eight-node solid elements, while the remaining areas were medially meshed into eight-node solid elements. An enlarged view of the fine-meshed tread and rail was given in Figure 2. The entire FE model of the wheel–rail system comprises 6,343,961 nodes and 5,956,372 elements.

Three-dimensional finite element model of the wheel–rail system.

Enlarged view of the fine-meshed tread and rail.
The mechanical behaviors of the wheels, axle, and rails were described by the plastic–kinematic hardening model in LS-DYNA 971, where the corresponding inputting parameters including the mechanical performance parameters obtained from the standard quasi-static tests at room temperature and a strain rate of 10−5 s−1 were presented in Table 1. It should be noted that the density of the axle was set to 7575 kg/m3 due to the equivalent reason as mentioned above.
Inputting material parameters for the components of the wheel–rail system.

The nodal constraints in all degrees of freedom (DOFs) were imposed to the bottom surface of two rails, and an axial translational constraint was applied to the two endpoints of the axle (i.e. the translational DOF of the two endpoints of the axle was constrained). The gravitational acceleration was set to be 9.81 m/s2 and was endowed to the whole wheel–rail system. The values of two concentrated forces can be obtained according to the definitions in the criterion of BS EN 13104:200919 given by

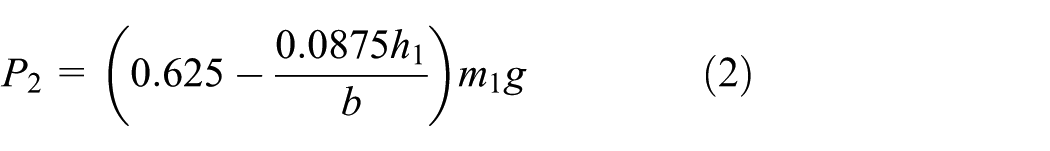
where h1 is the height above the axle centerline of vehicle center of gravity of masses carried by the wheelset, b is the half distance between vertical force input points on axle journals, m1 is the mass on journals including bearings and axle boxes, and g is the gravitational acceleration and g = 9.81 m/s2. For the axle load of 17 t, these two concentrated forces were easily calculated to be P1 = 110.41 kN and P2 = 77.56 kN, which were, respectively, applied to the right side and the left side of the centerline of the axle, as shown in Figure 1. The initial translational and rotational velocities were endowed to the wheelset (both wheels and axle) for a given train speed case, and the values were as follows: the translational velocity v = 27.78 mm/ms and ω = 0.0646 rad/ms for the 100 km/h case, v = 55.56 mm/ms and ω = 0.129 rad/ms for the 200 km/h case, and v = 83.33 mm/ms and ω = 0.194 rad/ms for the 300 km/h case, respectively. The tied surface-to-surface option was used for the surfaces between the wheels and the axle, while the automatic surface-to-surface options with the frictionless contact interaction were generally used for all the remaining possible surfaces.
For the purpose of comparison, the corresponding quasi-static FE model was also built using ANSYS 14.0 to explore the quasi-static wheel–rail contact response. In this model, the geometry, mesh, and all the material parameters were kept the same as those of the dynamic FE model, except that the initial translational and rotational velocities were removed.
Results and discussion
The proposed wheel–rail rolling contact FE model has been validated with the analytical results in our previous studies,15,16 by introducing the wheel flat defect to this model. The corresponding details were omitted here, and the simulation results were presented and discussed in terms of wheel–rail contact force, von Mises equivalent stress, equivalent plastic strain, vertical acceleration, and lateral displacement.
Wheel–rail contact force
The wheel contact force versus time histories in three directions—the lateral (x-direction), vertical (y-direction), and longitudinal (z-direction)—derived from both quasi-static and dynamic FE simulations are represented in Figure 3. From the quasi-static simulations, the vertical resultant contact force of the wheelset is 187.97 kN, which is equal to the sum of the values of imposed P1 and P2 forces. The average value of 93.985 kN is used for the average quasi-static vertical wheel–rail contact force at two sides to compare with the corresponding dynamic wheel–rail contact force derived from the dynamic simulations. Since only the straight railway line is considered in this study, the quasi-static lateral and longitudinal wheel–rail contact forces are very small, which are theoretically equal to zero. From the dynamic wheel–rail contact force histories under three various train speeds (i.e. 100, 200, and 300 km/h), some conclusions can be drawn as follows: (1) the dynamic lateral wheel–rail contact force is much smaller than the dynamic vertical contact force, since the wheel–rail contact position is nearby the nominal rolling circle of the wheel in the straight railway line condition; (2) the dynamic lateral wheel–rail contact forces at two sides have a similar change trend with the time in opposite direction and have an approximately equivalent amplitude at any moment under three various train speeds, which indicates a dynamic balance of the wheelset in the lateral direction is achieved to ensure it rolls straightly forward on the rail; (3) the dynamic vertical wheel–rail contact force at the left side (the side P1 force imposed) is obviously greater than that at the right side (the side P2 force imposed); (4) the difference in the dynamic vertical wheel–rail contact force at two sides is gradually decreased as the increased calculation time; and (5) the dynamic longitudinal wheel–rail contact forces at both sides are very small (the peak values under three train speeds are less than 0.1 kN), since the frictionless contact condition is considered in the simulations to keep moving forward with a constant velocity.

Typical wheel–rail contact force history curves under quasi-static and dynamic conditions: (a) vertical, (b) lateral, and (c) longitudinal.
Comparing the dynamic FE analysis with quasi-static analysis, the influence of train speed on the wheel–rail contact force response can be observed and quantified. The peak values of dynamic vertical wheel–rail contact forces at two sides are greatly larger than the average quasi-static value (93.985 kN), and they are close to 250 kN at three various train speeds, which is approximately 2.66 times larger than the average quasi-static value. The train speed appears to have a slight influence on the vertical contact force at the left side (corresponds to the larger loading force P1), while it has obvious influence on the right vertical contact force and the corresponding peak values are 176 kN for the 100 km/h case, 182 kN for the 200 km/h case, and 188 kN for the 300 km/h case, respectively. Moreover, the peak values of the lateral and longitudinal wheel–rail contact forces seem to be insensitive to train speed. The wheel contact force versus time histories in three directions have obvious high-frequency oscillations with the increased train speed.
von Mises equivalent stress
Since the larger loading force P1 is imposed at the left side, resulting in the occurrence of larger von Mises equivalent stresses of the left wheel and rail, the von Mises equivalent stresses of the left wheel and rail are discussed here. Figure 4 presents the typical von Mises equivalent stress contours on the tread and vertical cross section of the left wheel obtained from both quasi-static and dynamic simulations. The moments of the occurrence of the maximum von Mises equivalent stress of the wheel at different train speeds correspond to those moments of the peak vertical wheel–rail contact forces, that is, ∼7 ms for the 100 km/h case, ∼7 ms for the 200 km/h case, and ∼6.5 ms for the 300 km/h case, respectively. It is obvious that the maximum von Mises equivalent stresses under both quasi-static and dynamic conditions all exceed the yield stress of the rim (561 MPa), surely resulting in the plastic deformation of the wheel tread. From the view of stress contours on the tread, the plastic deformation of the wheel tread under the large axle load results in the change of the contact surface as well as the stress distribution of the contact surface. Different from the elastic wheel–rail contact with a single stress extreme point, the present contact patches all have multiple stress extreme points due to the plastic deformation, although they are also elliptically shaped. From the cross-sectional stress contours, the maximum stress values occurred on the subsurface of around 2–6 mm below the wheel tread, which may cause the plastic damage and the initiation of fatigue cracks in service. The maximum von Mises equivalent stresses under dynamic conditions are obviously larger than that quasi-static value (589.438 MPa), and the maximum values of von Mises equivalent stress appear a slight increase with the increasing train speed, especially for the train speed exceeding 200 km/h, as illustrated in Figure 5

von Mises equivalent stress contours of the left wheel derived from both quasi-static and dynamic simulations: (a) quasi-static, (b) 100 km/h, (c) 200 km/h, and (d) 300 km/h.
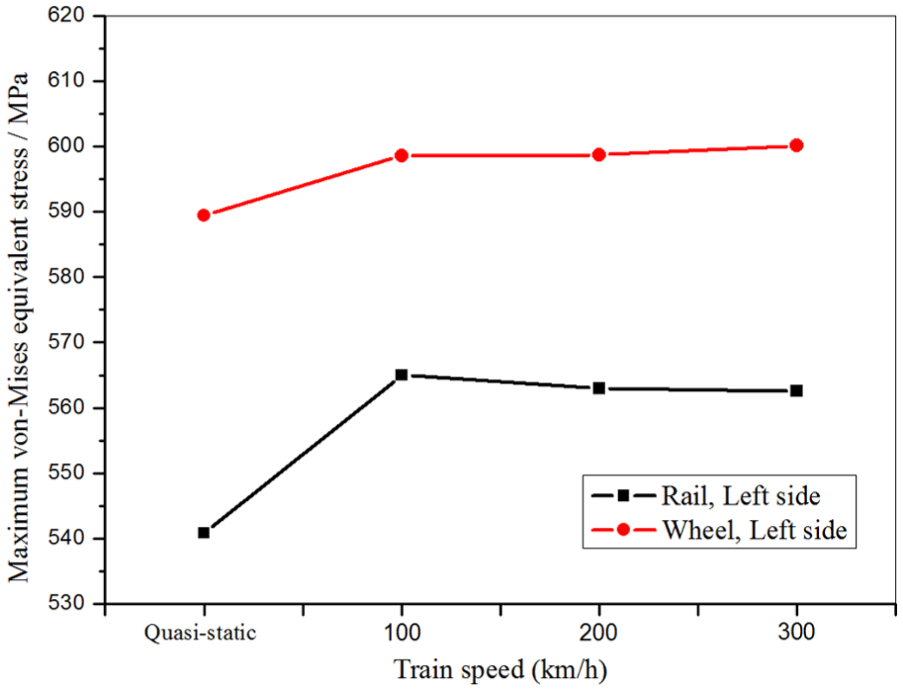
Maximum von Mises equivalent stresses of the left wheel and rail as a function of train speed.
Similarly, the von Mises equivalent stress contours on the top surface and vertical cross section of the left rail obtained from both quasi-static and dynamic simulations are shown in Figure 6. For a given train speed, the moment of the occurrence of the maximum von Mises equivalent stress of the rail is corresponding to that of the wheel. Same as the wheel, the elliptical contact patches on the rail have multiple stress extreme points due to the plastic deformation, and the maximum stress values occurred on the subsurface below the top surface of the rail. Although all the dynamic von Mises stress values are greater than the quasi-static value (540.832 MPa), different from the wheel, the maximum von Mises stress slightly decreases with the increased train speeds, as shown in Figure 5.
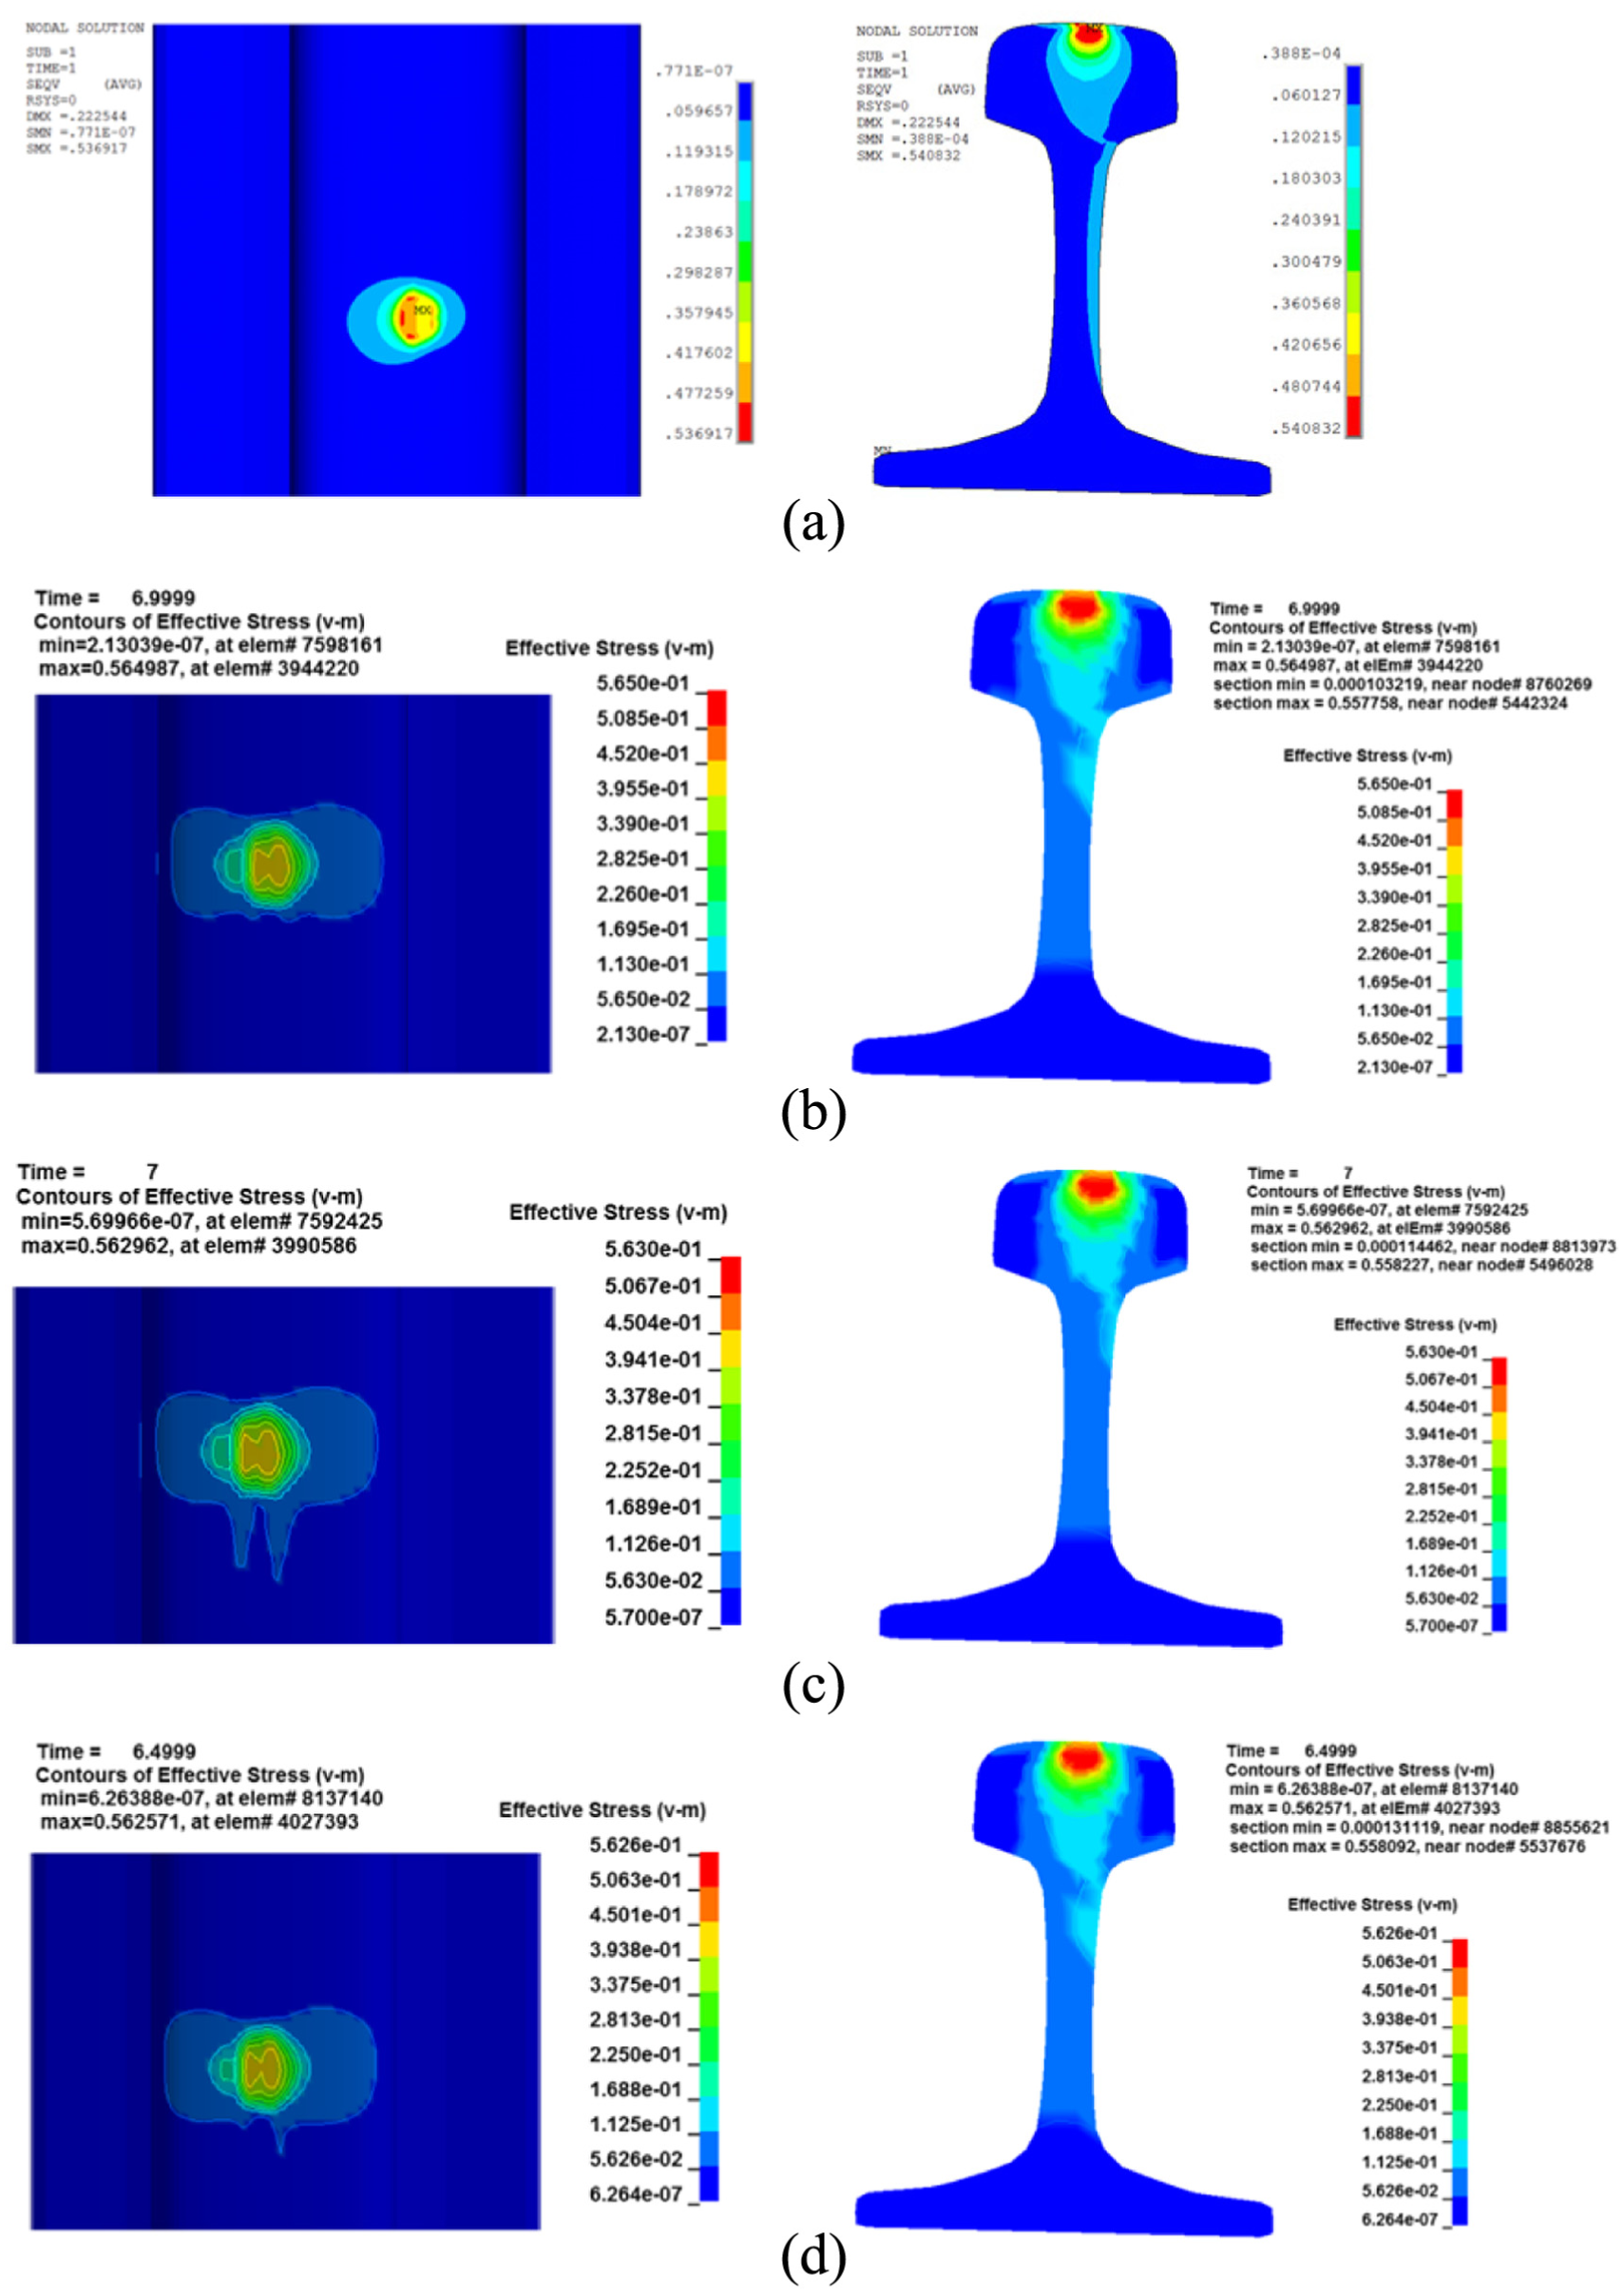
von Mises equivalent stress contours of the left rail derived from both quasi-static and dynamic simulations: (a) quasi-static, (b) 100 km/h, (c) 200 km/h, and (d) 300 km/h.
Equivalent plastic strain
Similar to the von Mises equivalent stress, the maximum equivalent plastic strain values also occur at the left wheel–rail contact region. Figure 7 presents the equivalent plastic strain contours of the wheel cross section under quasi-static and three train speed cases. It can be found that the maximum equivalent plastic strain occurred on the subsurface below the wheel tread for both quasi-static and dynamic conditions, which are same as the positions of the corresponding maximum von Mises equivalent stress occurred, and the corresponding strain values are 0.14% for the quasi-static case, 0.20% for the 100 km/h case, 0.21% for the 200 km/h case, and 0.21% for the 300 km/h case, respectively. The maximum equivalent plastic strains under dynamic conditions are obviously larger than that quasi-static value, and they present the insensitivity to the train speed, as shown in Figure 8. It is consistent with the conclusion from the above von Mises equivalent stress analysis that the plastic deformation occurred since wheel–rail contact stress has exceeded to yield stress of the rim.

Equivalent plastic strain contours of the left wheel derived from both quasi-static and dynamic simulations: (a) quasi-static, (b) 100 km/h, (c) 200 km/h, and (d) 300 km/h.

Maximum equivalent plastic strains of the left wheel and rail as a function of train speed.
The corresponding typical equivalent plastic strain contours of the left rail under both quasi-static and dynamic conditions are shown in Figure 9. Similarly, for a given train speed, the moment of the occurrence of the maximum equivalent plastic strain of the rail is corresponding to that of the wheel. Under both quasi-static and dynamic conditions, all the maximum equivalent plastic strains occurred on the subsurface of the rail, which corresponds to those positions of maximum von Mises equivalent stress, respectively. From Figure 8, the maximum equivalent plastic strain values of the rail under dynamic conditions are greater than the quasi-static value, and they are also insensitive to the train speed, similar to the wheel. However, the maximum dynamic equivalent plastic strain value of the rail (∼0.273% for the 200 km/h case) is around 2.48 times greater than the quasi-static value (∼0.11%), which is greater than the ratio value of 1.5 times for the wheel.
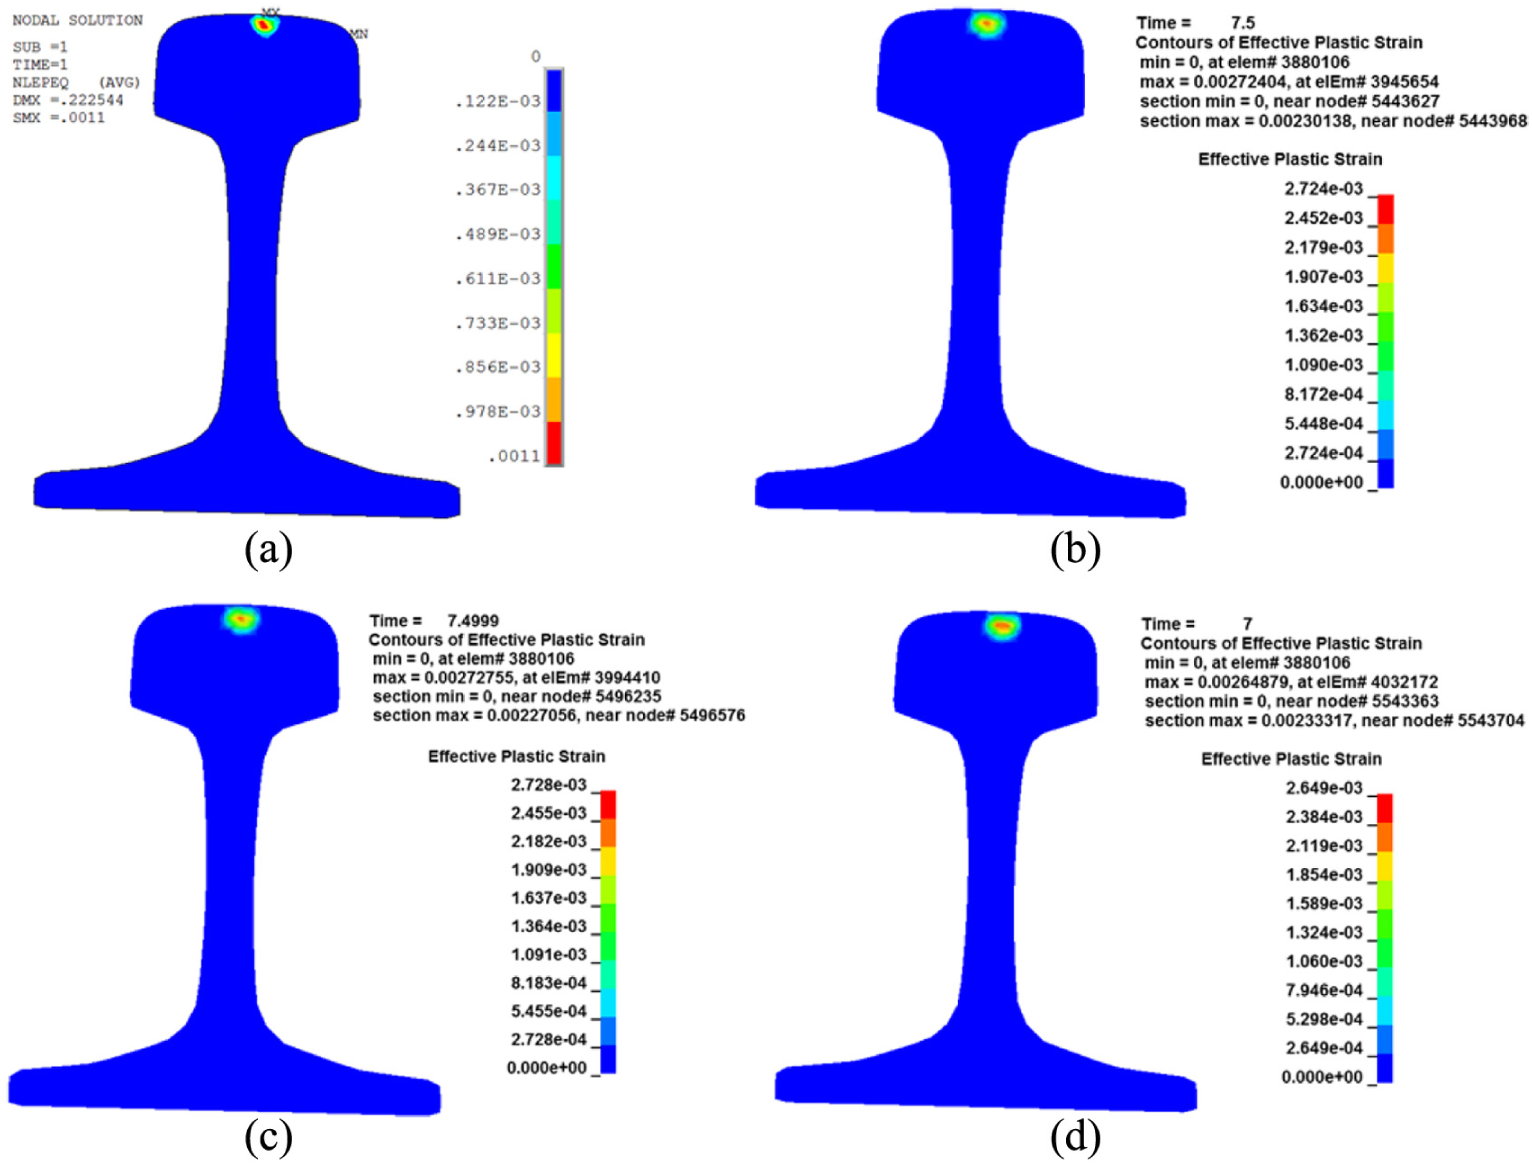
Equivalent plastic strain contours of the left rail under both quasi-static and dynamic conditions: (a) quasi-static, (b) 100 km/h, (c) 200 km/h, and (d) 300 km/h.
Vertical acceleration response of the axle
The typical sets of the vertical acceleration versus time histories of two endpoints in the centerline of the axle under three different train speeds are illustrated in Figure 10. The vertical acceleration response curves of two endpoints at both sides are almost coincident for each train speed condition, and they all present the very large fluctuation in the early stage within 6 ms and then stabilize at the lower acceleration value of around ±5 m/s2 with the time. This large fluctuation may be attributed to the fact that when the initial loading conditions were applied to the wheel–rail system in the dynamic simulations, a special distance was needed to reach the required quasi-static state. 20 Combining the vertical acceleration versus time histories with the vertical wheel–rail contact force response curves in Figure 3, it can be found that there is a one-to-one correspondence between each crest and trough of the vertical acceleration and the crest and trough of the vertical wheel–rail contact force, which indicates that the vertical wheel–rail contact force is a main source of the vertical acceleration of the wheelset.

Vertical acceleration of the axle versus time histories under three different train speeds: (a) 100 km/h, (b) 200 km/h, and (c) 300 km/h.
Lateral displacement of the initial contact point on the tread
Figure 11 represents the lateral displacement of the initial contact point on the wheel tread versus time histories for three different train speeds, that is, 100, 200, and 300 km/h. It can be found that the lateral displacement values of the initial contact point under three speed conditions stay at a very small level (the maximum value is less than 0.7 mm), attributed to the small lateral wheel–rail contact force (the maximum value is less than 9.5 kN) for the straight line railway case, as stated earlier. Besides, the lateral displacements of the initial contact points on the treads of the right and left wheels have an opposite direction and approximately equivalent amplitude, which reflects the automatic centered ability of the wheelset forced by the wheel–rail contact, to ensure the straight running of the trains. By comparing the lateral displacement curves at three speed cases, it can be found that the automatic centered ability of the wheelset is better at the lower train speed, while it declines gradually with the increased train speed for the presence of the difference in the lateral displacement between the left and right wheels; this will change the wheel–rail contact position and affect the wheel–rail interaction.

The lateral displacement of the initial contact point on the wheel tread versus time histories for three different train speeds: (a) 100 km/h, (b) 200 km/h, and (c) 300 km/h.
Conclusion
A three-dimensional wheel–rail rolling contact FE model was built to investigate the dynamic wheel–rail response in this study, compared to the quasi-static FE analysis of the wheel–rail contact behavior. The typical dynamic wheel–rail responses—the wheel–rail contact forces, related von Mises stress and equivalent plastic strain, the vertical acceleration of the axle, and lateral displacement of the initial contact point on the tread—were examined. Some main conclusions can be drawn as follows:
The dynamic lateral wheel–rail contact forces and the lateral displacement of the initial contact point on the wheel tread at two sides, which are maintaining the dynamic balance of the wheelset in the lateral direction, are successfully captured using dynamic FE simulations.
The lateral and longitudinal wheel–rail contact forces are very smaller than the corresponding vertical contact forces, and they seem to be insensitive to train speed. The peak value of dynamic vertical wheel–rail contact force is approximately 2.66 times larger than the average quasi-static value.
The maximum von Mises equivalent stresses of the wheel and rail under both quasi-static and dynamic conditions exceed the yield stress of the rim, resulting in the plastic deformation of the wheel tread and top surface of the rail. So, the elliptical contact patches all have multiple stress extreme points. The maximum equivalent plastic strain occurred on the subsurface below the wheel tread and top surface of the rail for both quasi-static and dynamic conditions, which are same as the positions of the corresponding maximum von Mises equivalent stress occurred.
The vertical acceleration response of the axle presents the very large fluctuation in the early stage within 6 ms and then stabilizes at the lower acceleration value of around ±5 m/s2 with the time.
Footnotes
Handling Editor: Wensu Chen
Declaration of conflicting interests
The author(s) declared no potential conflicts of interest with respect to the research, authorship, and/or publication of this article.
Funding
The author(s) disclosed receipt of the following financial support for the research, authorship, and/or publication of this article: The authors greatly appreciate the financial support by the National Natural Science Foundation of China (grant nos 51475392 and 1772275) and the Fundamental Research Funds for the Central Universities (grant no. A0920502051707-2-040).