
Abstract
Insufficient gap between adjacent buildings may lead serious poundings under seismic loadings. Installing polymer bumpers may decrease the pounding forces between colliding buildings, which can prevent column yielding from overlarge shearing forces. This article focuses on the analysis on energy responses of adjacent structures equipped with polymer bumpers. Based on a novel pounding analysis method, systematic comparisons of structural pounding performance are conducted and specific results are obtained and discussed. First, time history responses for pounding force, displacements, and yielding shearing forces in selected floors are calculated. Then, energy response analysis considering viscoelasticity of bumpers is investigated. Afterward, under different seismic waves, input energy response, pounding force procedures, and story displacements are studied and discussed. And finally, parametric studies on energy responses, including gaps, sizes, and viscoelasticity parameters, are carried out to investigate influence sensitiveness of bumper parameters. The results show that the novel viscoelastic pounding force model is effective in simulating and calculating adjacent structural pounding with polymer bumpers. Although, in many cases, viscoelasticity has little effect on pounding forces and energy response time histories, it still has certain influences on maximum values. And, equipping with polymer bumpers on adjacent buildings can decrease maximum pounding forces under all types of seismic waves, but pounding times and maximum displacements of stories increase after being equipped with bumpers. By comparing cases under different seismic waves, energy responses show sensitive characteristics to different earthquake waves. Besides, gaps, sizes of bumpers also have significant influence on energy performance. They affect peak yielding energy and peak damping energy significantly.
Introduction
Adjacent buildings with insufficient gaps may lead to pounding interactions under seismic loads. These have been observed in many major earthquakes, such as San Fernando earthquake in 1971, 1 Loma Prieta earthquake in 1989, 2 Wenchuan earthquake in 2008, 3 and Christchurch earthquake in 2011. 4 These pounding interactions between adjacent buildings resulted in surface damage of components, structure tilts, and even overall collapse. Poundings between adjacent buildings change the intrinsic dynamic characteristics of solo buildings, and the strong nonlinear feature brings difficulties in accurate prediction, simulation, and evaluation.
Many studies have focused on structural pounding induced by seismic load since 1980s. Many analysis methods are proposed to simulate and calculate pounding process and results. Structural poundings were first investigated by Miller and Fatemi 5 who paid attention to adjacent structures subjected to harmonic base excitations. Anagnostopoulos 6 systematically studied structural pounding using a simplified model of several adjacent buildings due to strong earthquakes in 1988. Since then, lots of studies are dedicated to adjacent structural pounding, especially different analysis methods to calculate or simulate pounding force procedure. Jankowski 7 proposed response spectrum analysis method to evaluate the pounding force between adjacent structures, and numerical investigations were also presented to verify the effectiveness of this new tool. Anagnostopoulos and Spiliopoulos 8 studied single degree of freedom (SDOF) systems with impact elements and carried out parametric study for structural pounding, and offered a possible explanation for building collapse. Ganjavi and Hao 9 presented numerical results of structural pounding considering soil–structure interaction from making multiple degree of freedom (MDOF) system equivalent to SDOF system. Ghandil and Aldaikh 10 developed a three-dimensional (3D) inelastic finite element (FE) modeling for underlying soil to investigate structure–soil–structure interaction (SSSI)-induced pounding problem of two adjacent symmetric in plan buildings excited by uniaxial earthquake loadings. Komodromos et al. 11 proposed a linear viscoelastic impact model to make parametric study on structural pounding of seismically isolated buildings, in which the proposed analysis model can avoid tensile impact forces during detachment. Zhai et al. 12 utilized dimensional analysis method to study seismic pounding response of MDOF adjacent buildings with bilinear inter-story resistance characteristics.
Reducing pounding effects between adjacent structures has been studied by many means. Applying bumper as shock absorber between adjacent components is a reasonable way to prevent damage of buildings during poundings. Raheem 13 proposed a mitigation solution involved rubber to deal with the typical pounding problems between adjacent structures, and parameter optimizations were also presented. Polycarpou et al. 14 gave an efficient methodology to illustrate the performance of soft material (like rubber) bumpers during structural poundings. Shrestha et al. 15 presented an extensive investigation on the effectiveness of combining rubber bumpers as a shock-absorbing device to mitigate pounding and unseating damages on multiple-span bridges subjected to spatially varying ground motions.
A suitable pounding force model to illustrate the relationship between force and displacement is a key foundation to study the influence of pounding on structures. Many analysis methods or pounding force models have been proposed to simulate interactions between colliding bodies. The linear spring model is based on the classical theory of impact, considering the interaction between two colliding bodies as a linear spring. This analysis method is the simplest way to ignore energy dissipation during pounding process, and it has been utilized by many researchers (such as Ruangrassamee and Kawashima 16 and Wang and Shi 17 ). Many nonlinear pounding force models were also proposed to overcome shortcomings of linear elastic model. Jankowski18–21 proposed a well-known pounding force model to avoid tension force at the end of force–displacement curve. Muthukumar and Desroches 22 combined the Kelvin model and the Hertz spring model to obtain the “Hertzdamp model,” which is another efficient analysis model. Aydin et al. 23 proposed a new damper optimization method for finding optimal size and location of the added viscous dampers based on the elastic base moment in planar steel building frames. This method is actually a frequency-domain analysis method which can solve matrix differential equation containing viscous dampers. Xue et al. 24 also proposed a viscoelastic pounding force analysis method and utilized it in a pounding tuned mass damper (PTMD) simulation. This method is based on contact mechanics and linear viscoelasticity mechanics, which can be suitable to different contact geometries and complicated viscoelastic constitutive models with high-order differential equation types.
Many researches have focused on energy dissipation analysis for structure equipped with vibration-control devices. Wong and Chee 25 studied the process of structural energy transfer ability for the structure to dissipate energy with a tuned mass damper (TMD). And, Wong 26 also investigated the energy transfer process of inelastic structures using TMD to improve the ability to dissipate earthquake input energy. Wang et al. 27 investigated characteristics of reducing lateral vibrations for offshore jacket platforms under impact loading using TMD. Symans et al. 28 presented a summary of practice and developments for applications on passive energy dissipation systems.
Despite previous studies on structural pounding and applying bumpers to reduce vibration and damage induced from earthquakes or impact loads, bumpers’ mechanical property influence on structural pounding performance is still need to be investigated by energy view. Using the pounding force analysis method proposed by Xue et al., 24 viscoelasticity of polymer bumpers can be considered during pounding process. In this article, energy dissipation analysis is carried out on adjacent buildings equipped with polymer bumpers. Based on a novel pounding analysis method, systematic comparisons of structural pounding performance are conducted and specific results are also obtained and discussed. First, time history response for pounding force, displacements, and yielding shearing forces in a selected floor are calculated in cases with and without polymer bumpers. Then, energy response analysis considering viscoelasticity of bumpers is discussed. Afterward, under different seismic waves, input energy response, pounding force procedures, and story displacements are investigated. And finally, parametric studies on energy responses, including gaps, sizes, and viscoelasticity parameters, are carried out to investigate influence sensitiveness of bumper parameters.
Numerical structure models
Two multistory adjacent buildings with unequal heights are considered as research objects to demonstrate structural performance. Left building has 15 stories and right building has 8 stories. In order to simplify the analysis, a discrete two-dimensional planar model is applied. The structure model is shown in Figure 1(a). Both the buildings have same inter-floor heights. Bumpers are installed in each interactional floor, which is from 1st floor to 8th floor. For engineering practice, the bumper should be fixed at slab–column nodes of the left building and pounding protectors are installed in the right building (Figure 1(b)). The bumper shape is thin cylindrical type with radius R and thickness w.

Sketch of adjacent structures with bumpers: (a) adjacent unequal height buildings, (b) installation of polymer bumper, and (c) polymer bumper.
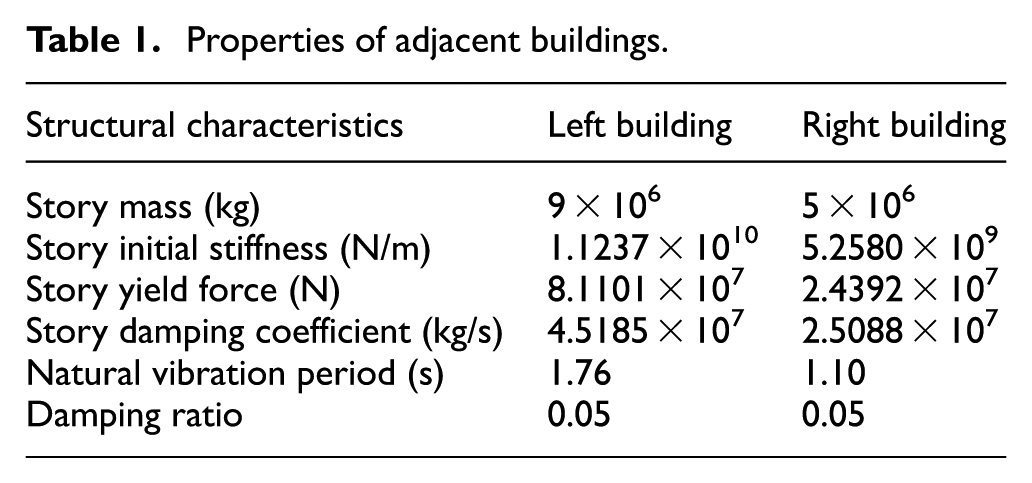
The numerical model is obtained by lumped masses to each floor. Inter-floor interactions via spring and damping are obtained (Figure 2(a)). Two buildings have different floor masses, stiffness values, and damping coefficients. Detailed information is given in Table 1. Damping coefficient can be calculated as given by Chopra. 29 This model was proposed and investigated by Maison and Kasai 30

Numerical model of adjacent buildings: (a) numerical model of main structure, (b) three-parameter viscoelastic model, and (c) geometry of pounding bodies.
Properties of adjacent buildings.
The dynamic equations of motion considering pounding effects between adjacent buildings at each floor level can be written as
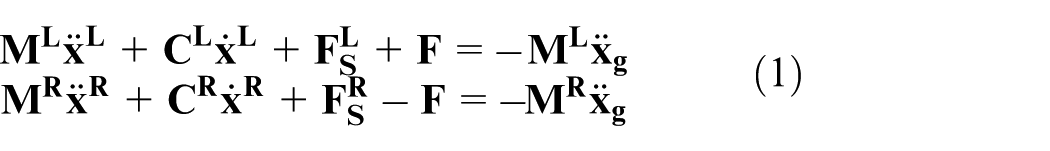
where
Plastic effects of columns bearing shear forces are also considered. During the elastic stage,
Model of pounding force
Pounding force model of viscoelasticity
Considering viscoelasticity of polymers, we take use of linear viscoelasticity pounding force model to calculate structural responses. In mechanics of linear viscoelasticity, constitutive models are composed of springs and dash-pots in series or parallel relations, and they can be written as the following differential equation

The equation can be written in short as

P and Q are differential operators. Laplace transformations are introduced to both sides of the equation, and the expression in Laplace domain can be obtained

where

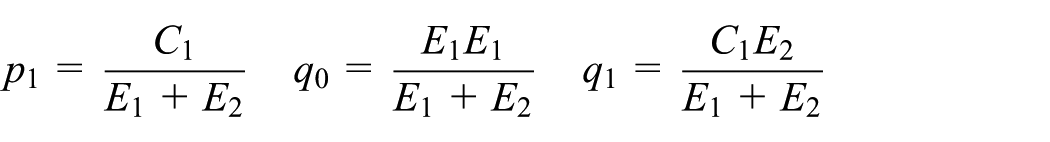
For the three-parameter solid viscoelastic model (Figure 2(b)), it can be written as

with
During pounding process, the pounding force can be written in the following form

where
In the case that the pounding bodies possess the properties with viscoelasticity, the following expression in Laplace domain can be achieved according to the principle of correspondence

Since parameter

where
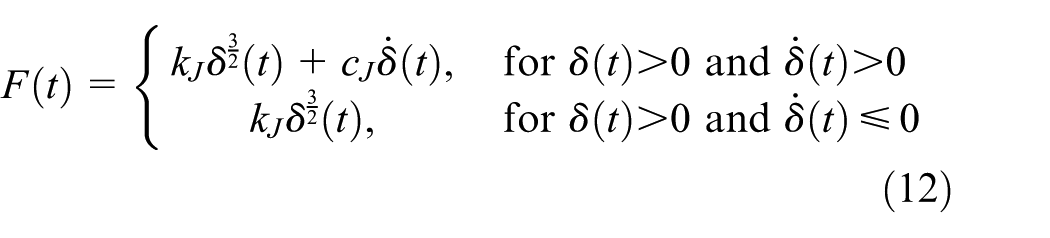
The three-parameter solid viscoelastic constitute model (Figure 2(b)) is selected to describe the viscoelasticity of polymer bumper. When the contact geometry is plane to plane (Figure 2(c)), pounding force can be expressed by following equation

where A, w, and
where
Pounding force model of elasticity
To compare result differences between viscoelastic and elastic analysis models, an elastic pounding force model is taken as following expression

where
Pounding force model of structural pounding without bumper
Because structure frames pounding without bumper involves concrete-to-concrete impact, an improved Kelvin model proposed by Jankowski 21 is utilized to simulate pounding responses of adjacent buildings. The method is widely used by many studies and its effectiveness has been proved by several studies such as Polycarpou and Komodromos 31 and Naserkhaki et al. 32 The expression of the pounding force model regarding to concrete-to-concrete impact is shown as 18
where

where
The pounding will happen when the bumper and collision wall contact. Penetration displacement

Energy response equations
During earthquake-induced vibrations, input energy of structure can be divided into three parts. The first part is stored as kinetic energy, the second one is the recoverable elastic strain energy, and the last one is the energy dissipated by structural damping. Besides, if a structural system is equipped with polymer bumpers, then it provides an additional way to dissipate energy.
We can denote following expressions to evaluate the energy response of the structural pounding system 26


where

where
Analysis results
As mentioned previously, three types of poundings between two adjacent buildings are investigated to study pounding responses under seismic effects:
Pounding between buildings without bumper utilized concrete-to-concrete pounding force model to calculate impact responses.
Pounding between buildings equipped with bumpers utilized elastic pounding force model to obtain vibration-reducing effect from bumpers.
Pounding between buildings equipped with bumpers utilized viscoelastic pounding force model to investigate viscoelasticity influence on pounding performance and vibration-reducing effects.
Time history results, energy responses, and parametric studies under seismic waves are conducted in this part. El earthquake record in W-E direction is chosen as a standard input seismic effect.
Time history results
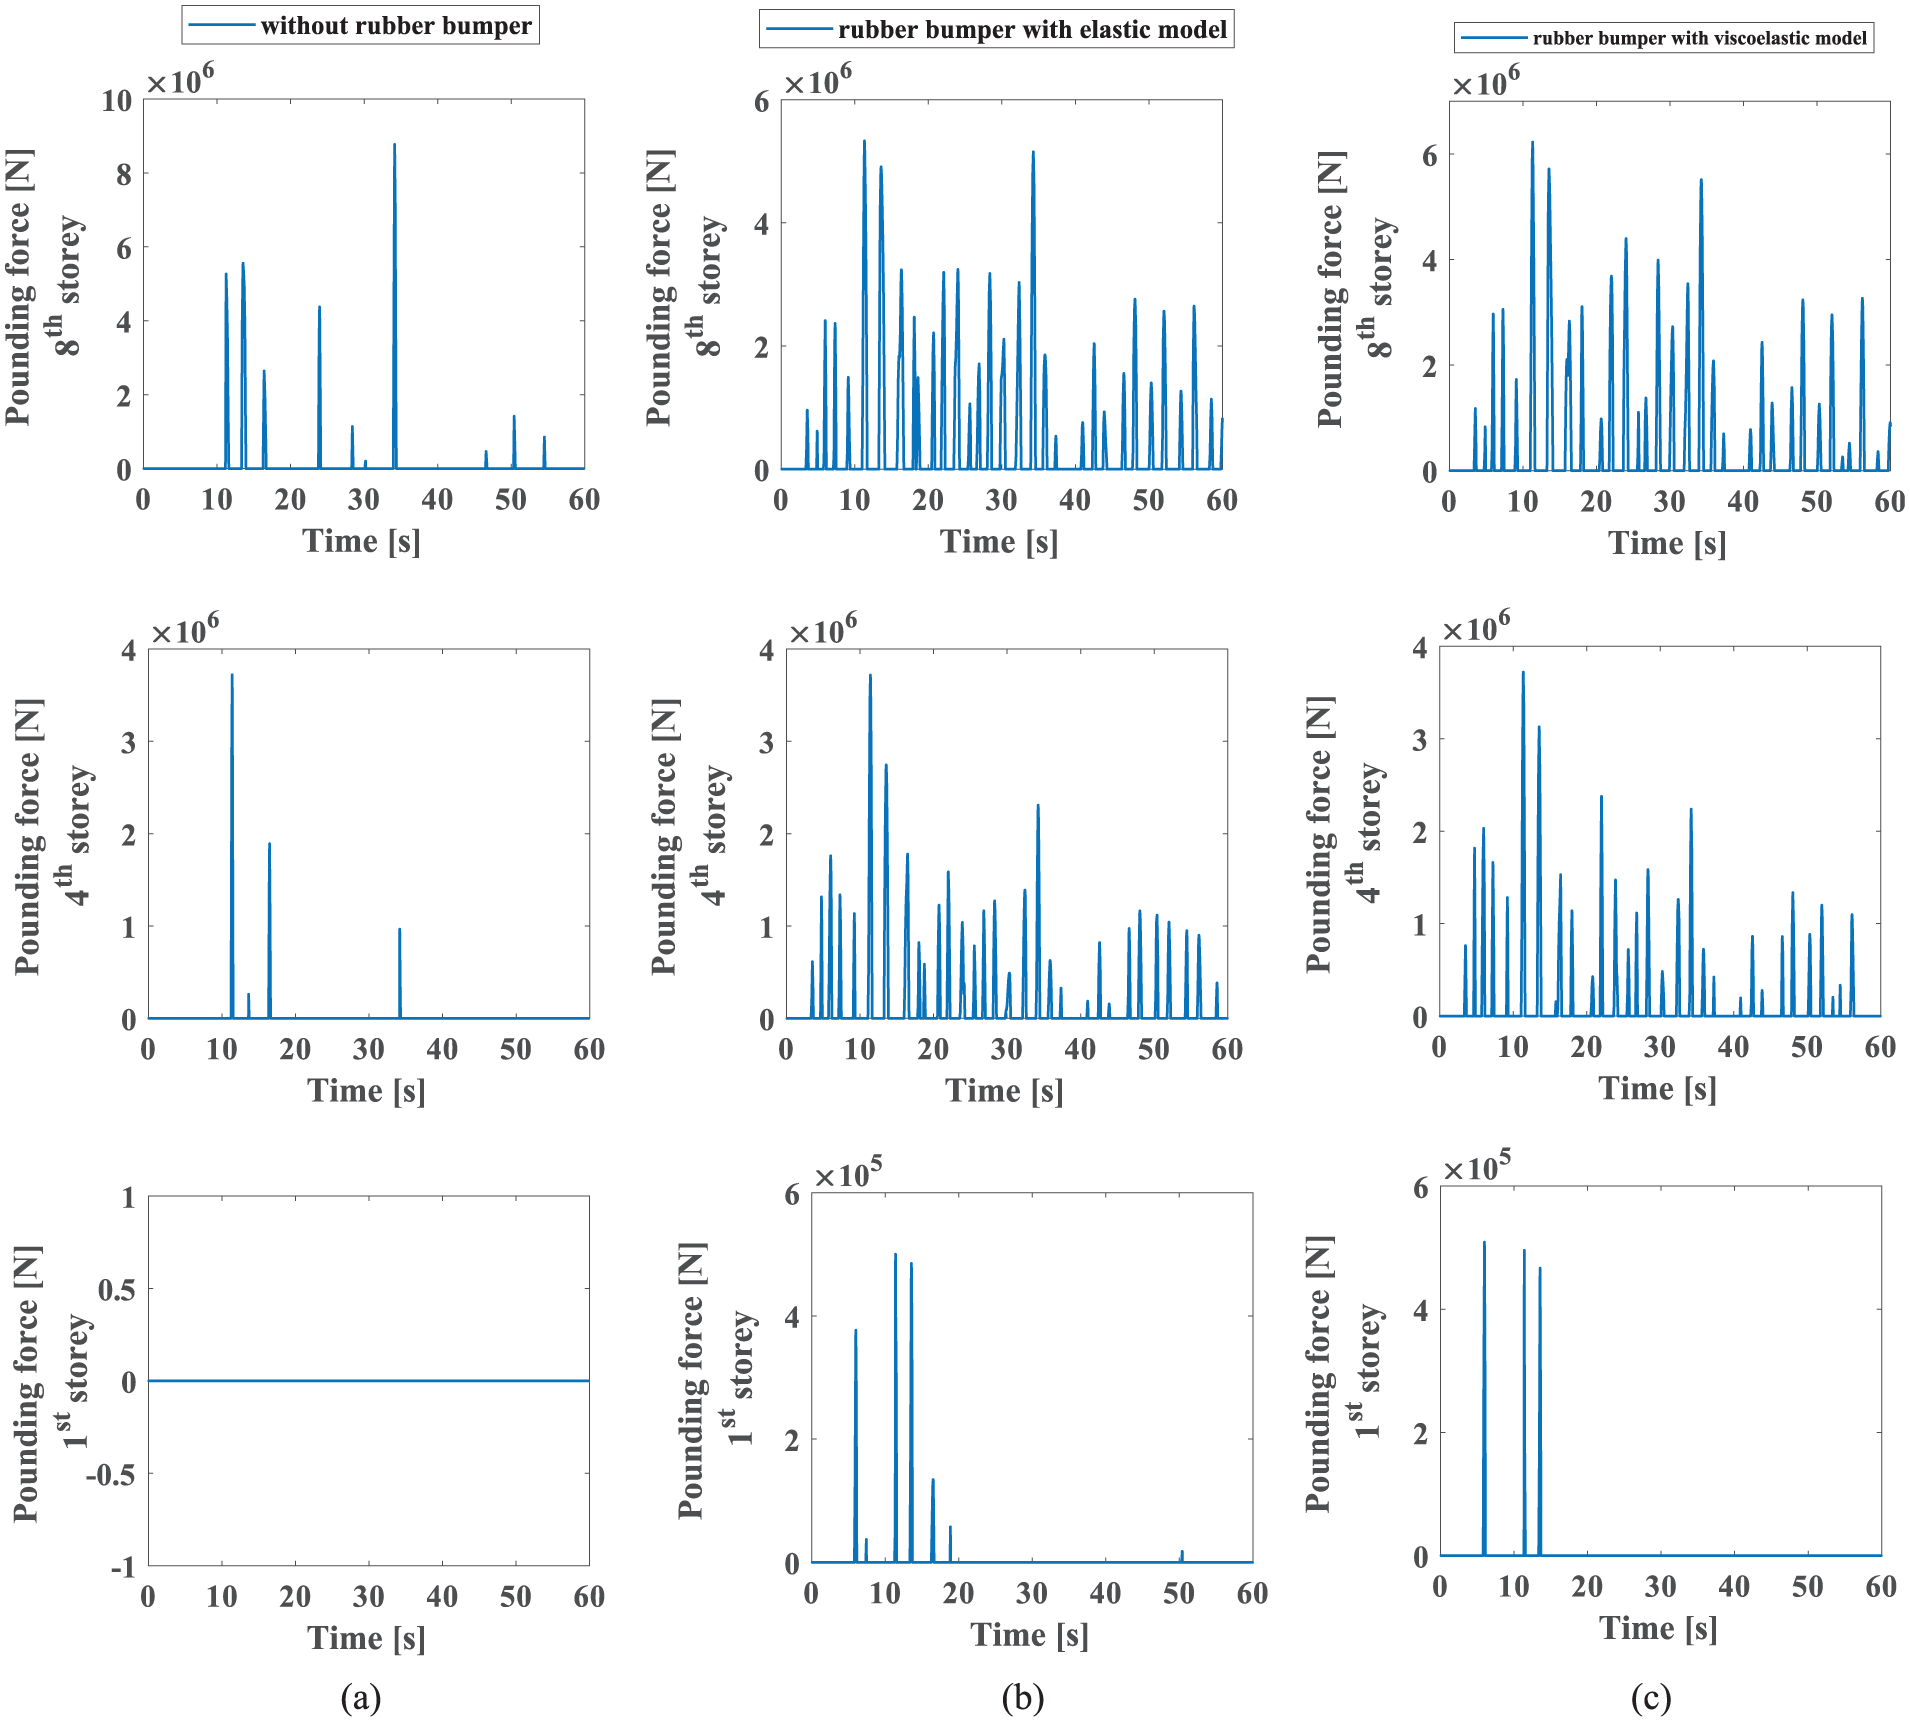
Figure 3 shows pounding force time-histories with three types of pounding analysis under El W-E wave ground motions. It can be observed that the maximum pounding force for model equipped with polymer bumpers has a significant decrease compared to the model without polymer bumper. In this example, maximum pounding force value decreases from 6.54 × 10⁶ to 4.89 × 10⁶ N after being equipped with polymer bumpers. Moreover, the pounding forces at lower stories show smaller values compared to higher stories. Besides, pounding times also increase tremendously after being equipped with bumpers. This is because the polymer block installed between structures reduces the distance of the initial separation gaps. Comparing pounding force history between viscoelastic pounding force model and elastic model, there is almost no difference in 4th and 8th stories. But in 2nd story, pounding times and maximum values are obviously different.

Pounding force time history of three types of poundings: (a) without bumpers, (b) equipped with bumper calculated by elastic pounding force model, and (c) equipped with bumper calculated by viscoelastic pounding force model.
Shearing force time-histories with three types of analysis for colliding buildings are shown in Figure 4. It can be seen that interactions between adjacent buildings installed with polymer bumpers result in a “delay” in the curve shape in the left building. And, in the right building, only a small difference between responses with and without bumper. Furthermore, platforms in curves represent the threshold of yielding force, times of reaching threshold have been reduced for the cases installed with bumpers. Comparing results between elastic and elastic pounding force models, curves almost coincide with each other, except some peak positions.
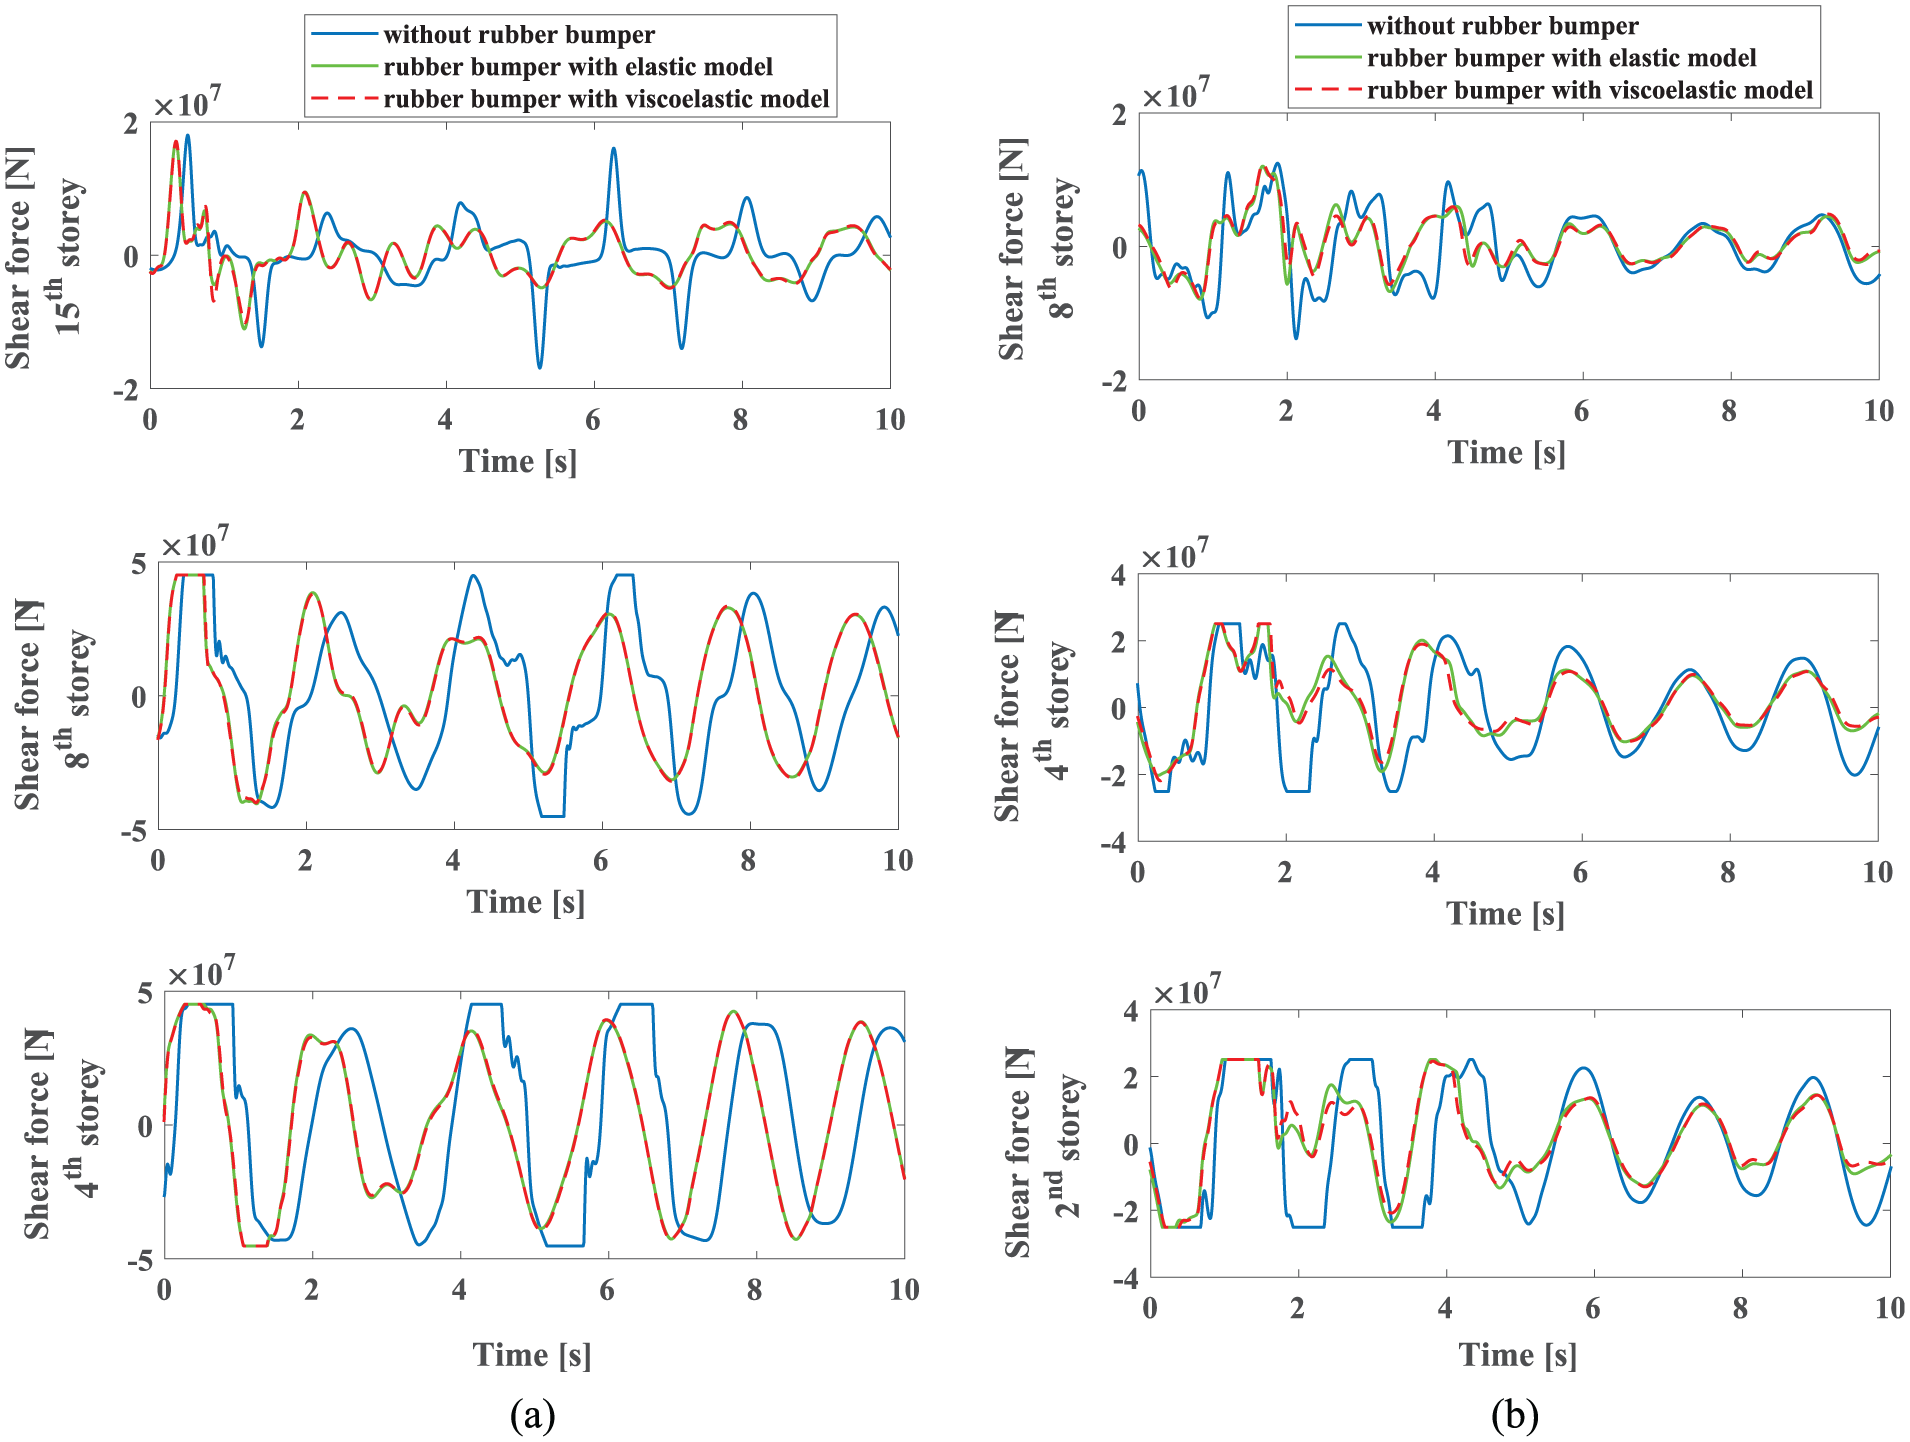
Shearing force time-histories with three different models of collision for the (a) left building stories and (b) right building stories.
Energy responses in El W-E direction wave
Figure 5 shows input energy responses for both buildings under El W-E direction wave. In the left building, input energy difference in the case equipped with bumpers has slightly larger values than without damper. But for the right building, input energy in the case installed with bumper has significantly increased compared to the case without bumper. Higher stories correspond to larger differences. Comparing cases between elastic and viscoelastic pounding force models, input energy curves show almost coincidence in the right building and show a little difference in the left building. It can be concluded that in this case, the influence of the viscoelastic properties of the bumpers on input energy cannot be ignored.
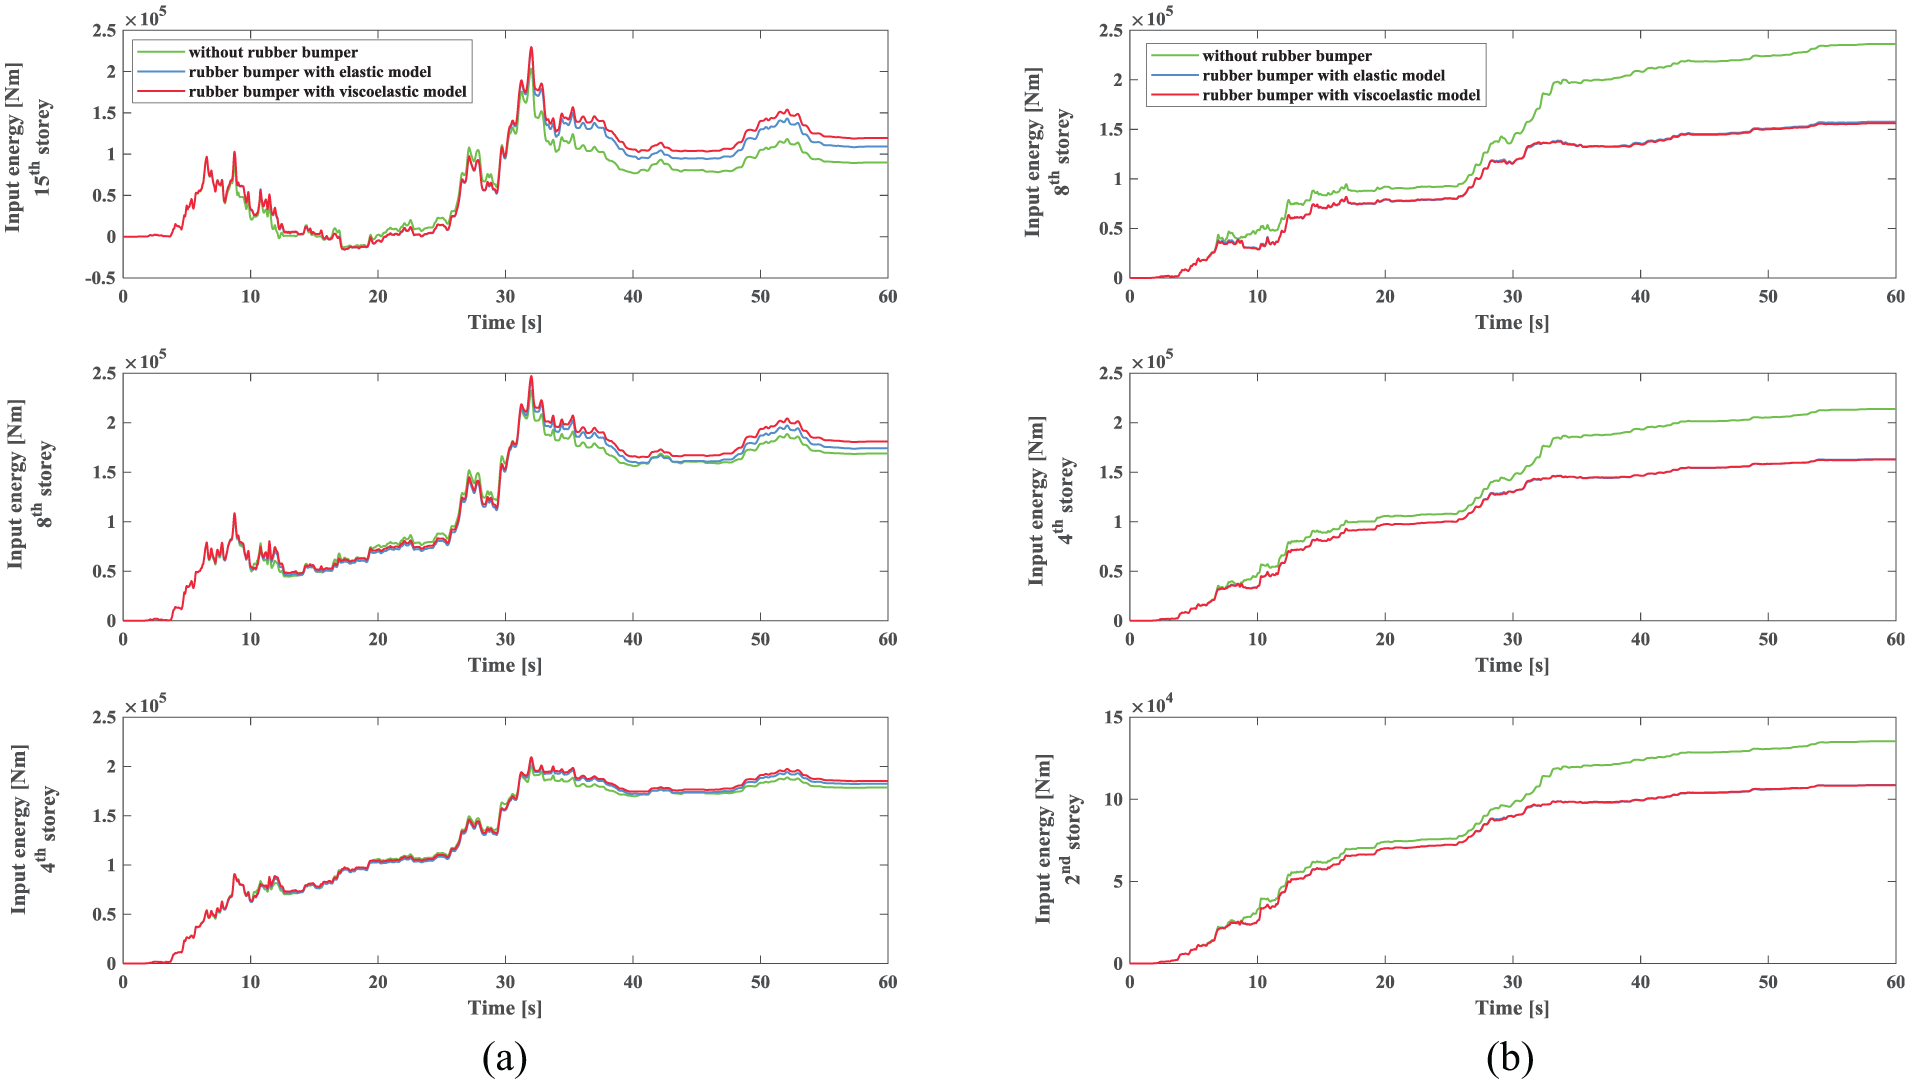
Input energy time history for selected stories in the left and right buildings: (a) 4th, 8th, and 15th stories in the left building and (b) 2nd, 4th, and 8th stories in the right building.
Figure 6 shows the dissipated damping energy in two adjacent buildings. It can be observed that all curves have same variation trends which are similar to the input energy results. The existence of bumper can increase energy dissipation slightly in the left building but decrease in the right building. Bumpers here show a re-arrangement effect distribution, which increases dissipated energy on one side and decrease on the other side. Figure 7 shows yielding energy dissipation time history in two buildings. Comparing cases equipped and not equipped with bumpers, inapparent differences are seen in the left building, but significant differences are seen in the right building. Existence of bumpers can decrease the yielding energy dissipation. This is because energy dissipation mainly comes from plasticity of columns. And, the existence of bumper can decrease the times of reaching yielding threshold. Similar to previous input energy results, energy dissipation curves with bumpers obtained by elastic and viscoelastic models coincide together in both buildings. And, this means viscoelasticity of bumper has no influence on energy results in this case.

Dissipated damping energy time history for selected stories in the left and right buildings: (a) 4th, 8th, and 15th stories in the left building and (b) 2nd, 4th, and 8th stories in the right building.
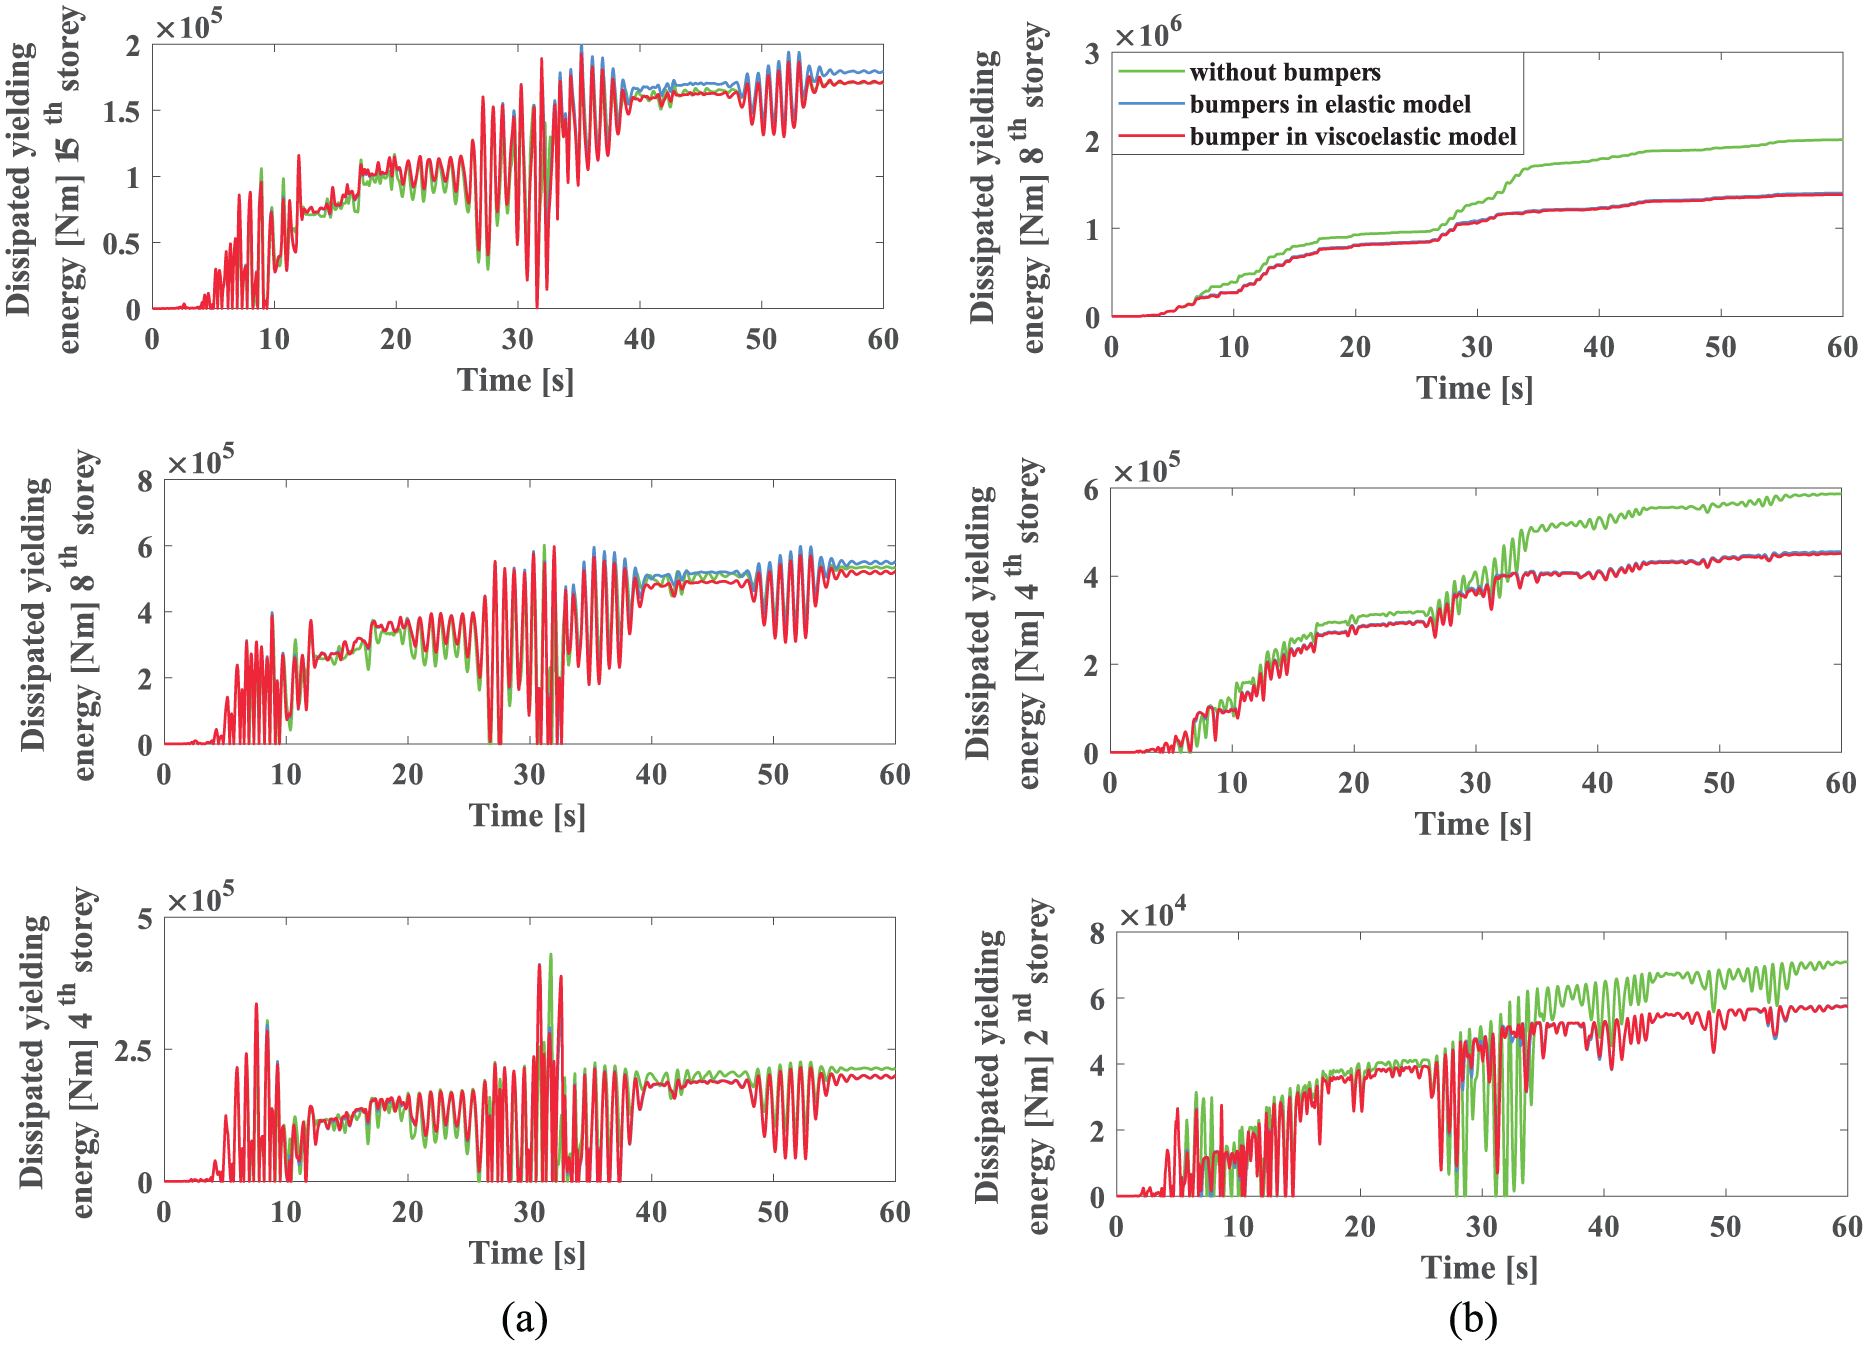
Dissipated yielding energy dissipation time history for selected stories in the left and right buildings: (a) 4th, 8th, and 15th story in the left building and (b) 2nd, 4th, and 8th story in the right building.
Figure 8 shows the absorbed kinetic energy time history in two buildings. In both the buildings, higher stories have larger kinetic energy. And, for the left building, all the three stories have same variation trends regardless with or without bumpers. But in the right building, variation trends have obvious difference. Besides, similar re-arrangement effect is also found from curves. Installing bumper will increase the kinetic dissipated energy for the left building, but decreases kinetic energy absorption in the right building.

Dissipated kinetic energy dissipation time history for selected stories in the left and right buildings: (a) 4th, 8th, and 15th stories in the left building and (b) 2nd, 4th, and 8th stories in the right building.
Responses in different seismic waves
Previous studies are based on one seismic wave, El wave in W-E direction. In this section, responses, including displacements and input energy, are studied under different seismic waves. Figure 9 shows four types of seismic wave time history. Another three seismic waves, El wave in N-S direction, Chichi wave in W-E direction, and Tabas wave in W-E direction, are used to study seismic wave influences.

Four types of seismic waves: (a) El wave in W-E direction, (b) El wave in N-S direction, (c) Chichi wave in W-E direction, and (d) Tabas wave in W-E direction.
Figure 10 shows input energy responses for selected stories in the left and right buildings under El N-S direction wave. These graphs show a different trend with previous results. In the left building, lower stories have larger difference between cases equipped and not equipped with bumpers. And in right buildings, results are similar to the previous case. Buildings without bumper have higher input energy in 2nd, 4th and 8th storeys. Pounding system equipped bumpers has lower input energy than without bumpers in almost both left and right buildings. Curves for buildings with bumpers in different analysis methods have little difference. These are different with previous result under El W-E direction wave, shown in Figure 5.

Input energy time history for selected stories in the left and right buildings under El N-S direction wave: (a) 4th, 8th, and 15th stories in the left building and (b) 2nd, 4th, and 8th stories in the right building.
Pounding force time history curves under El N-S direction wave are shown in Figure 11. Comparing to system without bumper, pounding force has an obvious decrease in case with bumpers. At the same time, maximum pounding force value and pounding times also decrease significantly. Curves equipped with bumper in different pounding force methods have similar pounding force results, not only the pounding times but also the pounding force values. Maximum pounding force value of representative stories without bumper are 8.77 × 10⁶, 3.72 × 10⁶ and 0 N in 8th, 4th, and 1st stories, respectively. And, for case installed with bumper, the pounding force values are 5.33 × 10⁶, 3.71 × 10⁶, and 0.50 × 10⁶ N in 8th, 4th, and 1st stories, respectively. Pounding times are 9 versus 41 in 8th story, 5 versus 27 and 0 versus 7 for equipped and not equipped with bumpers in same representative stories, respectively.
Pounding force time history with three different models of collision under El N-S direction wave: (a) without bumpers, (b) equipped with bumpers calculated by elastic pounding force model, and (c) equipped with bumpers calculated by viscoelastic pounding force model.
Figure 12 shows input energy time history for 2nd, 4th, and 8th stories under Chichi W-E direction waves. In the left building, similar to the results in El N-S wave, the system without bumpers has lower input energy than with bumpers. Curves for case with bumpers in different pounding force methods have little difference. In right building, all the storeys without bumper have lower input energy than the cases equipped bumpers. And, all the three representative stories have significant gaps between for all cases without bumper.

Input energy time history for selected stories in the left and right buildings under Chichi W-E direction wave: (a) 4th, 8th, and 15th stories in the left building and (b) 2nd, 4th, and 8th stories in the right building.
Pounding force time history curves under ChichiN-S direction wave are shown in Figure 13. Comparing cases without bumper, pounding force have an obvious decrease in the case with bumpers. But pounding times have no significant decrease except in the 2nd story. Besides, curves with bumper in different analysis methods have similar pounding force values. Maximum pounding force value of representative stories without bumper are 3.47 × 10⁷, 2.55 × 10⁷, and 1.87 × 10⁶ N in 8th, 4th, and 2nd stories, respectively. And, for the case equipped with bumper, the pounding force values are 1.85 × 10⁷, 1.57 × 10⁷, and 5.62 × 10⁶ N in 8th, 4th, and 2nd stories, respectively.

Pounding force time history with three different models of collision under Chichi N-S direction wave: (a) without bumpers, (b) equipped with bumpers calculated by elastic pounding force model, and (c) equipped with bumpers calculated by viscoelastic pounding force model.
Figure 14 shows the input energy time history under Tabas W-E direction wave. It can be found that system without bumpers has larger input energy than the case equipped with bumpers except in the 8th story of the left building. Curves for system with bumpers calculated by different analysis methods have little difference. In the left building, lower stories have larger difference among stories equipped and not equipped with bumpers. And, in the right building, all the three representative stories have significant gaps away from cases without bumpers.

Input energy time history for selected stories in the left and right buildings under Tabas W-E direction wave: (a) 4th, 8th, and 15th stories in left building and (b) 2nd, 4th, and 8th stories in the right building.
Pounding force time history curves under TabasW-E direction wave are shown in Figure 15. Comparing system without bumpers, although pounding times are about equal to each other, pounding forces have an obvious decrease in the case equipped with bumpers. Maximum pounding force values of representative stories without bumper have 3.67 × 10⁷, 2.74 × 10⁷, and 6.71 × 10⁶ N in 8th, 4th, and 2nd stories, respectively. And, for the system equipped with bumper, the maximum pounding force values are 1.75 × 10⁷, 1.92 × 10⁷, and 5.41 × 10⁶ N in 8th, 4th, and 2nd stories, respectively.
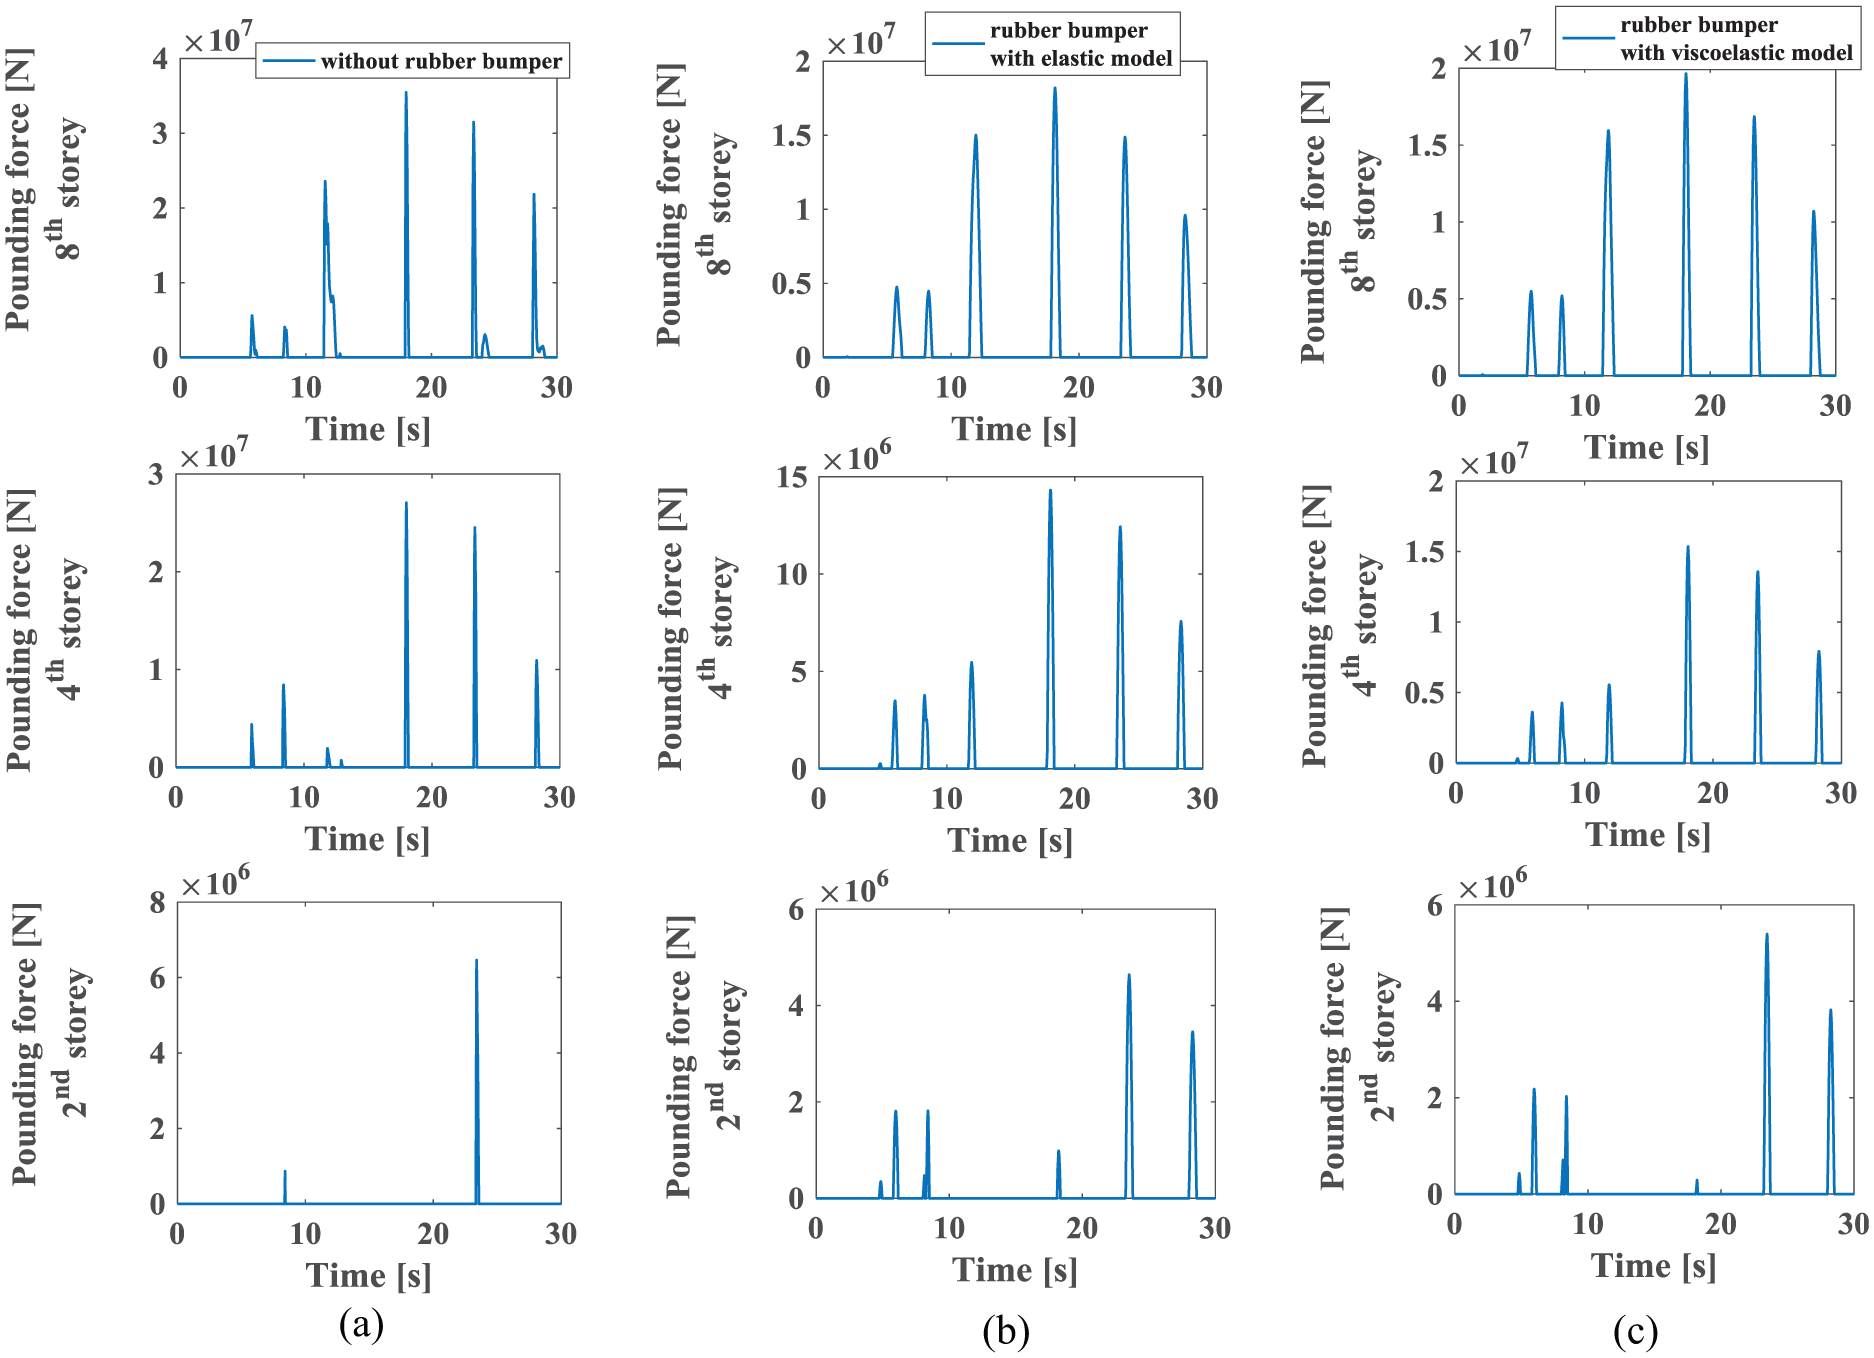
Pounding force time history with three different models of collision under Tabas W-E direction wave: (a) without bumpers, (b) equipped with bumpers calculated by elastic pounding force model, and (c) equipped with bumpers calculated by viscoelastic pounding force model.
Figure 16 shows maximum input energy value curves in different stories under various seismic waves. Curves in the left of axis Y represent stories in the left building. And, curves in the right of axis Y represent stories in the right building. For ChiChi earthquake curve, higher storeys are corresponding to larger input energy values. Maximum input energy appears in top story for Chichi W-E wave. Under Tabas earthquake wave, maximum input energy values appear in 1st story in the right building and 2nd story in the left building and under El earthquake wave (including W-E and N-S directions), maximum input energy appears in 8th storey in left building and 6th storey in the right building, respectively. Cases equipped with bumpers calculated by two pounding analysis method show a certain accordance. Combining previous analysis, input energy is sensitive to seismic waves. And, analysis method also has influence on input energy results. This means although the viscoelasticity of materials has little effect on simulation results for most cases, and its influence cannot be ignored.

Maximum input energy value in different stories under varies seismic waves: (a) El wave in W-E direction, (b) El wave in N-S direction, (c) Chichi wave in W-E direction, and (d) Tabas wave in W-E direction.
Figure 17 shows maximum displacement values in different stories under various seismic waves. In the left building, maximum displacements in cases with bumper are larger than without bumpers in three seismic waves: El N-S, El W-E, and Chichi W-E waves. In right building, maximum displacements in cases with bumper are lower than without bumpers in El seismic waves (includeing W-E and N-S directions) except the Chi-Chi W-E wave. The reason is because installing bumpers will decrease gap values between two buildings. This makes pounding times increase and leads to larger displacements. Under Tabas earthquake wave, three curves are almost coincided. This is because Tabas wave’s acting time is only about 30 s. And, systems with bumpers calculated considering viscoelasticity of materials will lead a smaller maximum displacement than elastic models. From the damage view, story drift or story displacement is one of the key factors to evaluate safety of whole structure. So, we can conclude although installation of bumpers can reduce maximum pounding forces, this will lead to larger story displacements, which is harmful to structure safety.
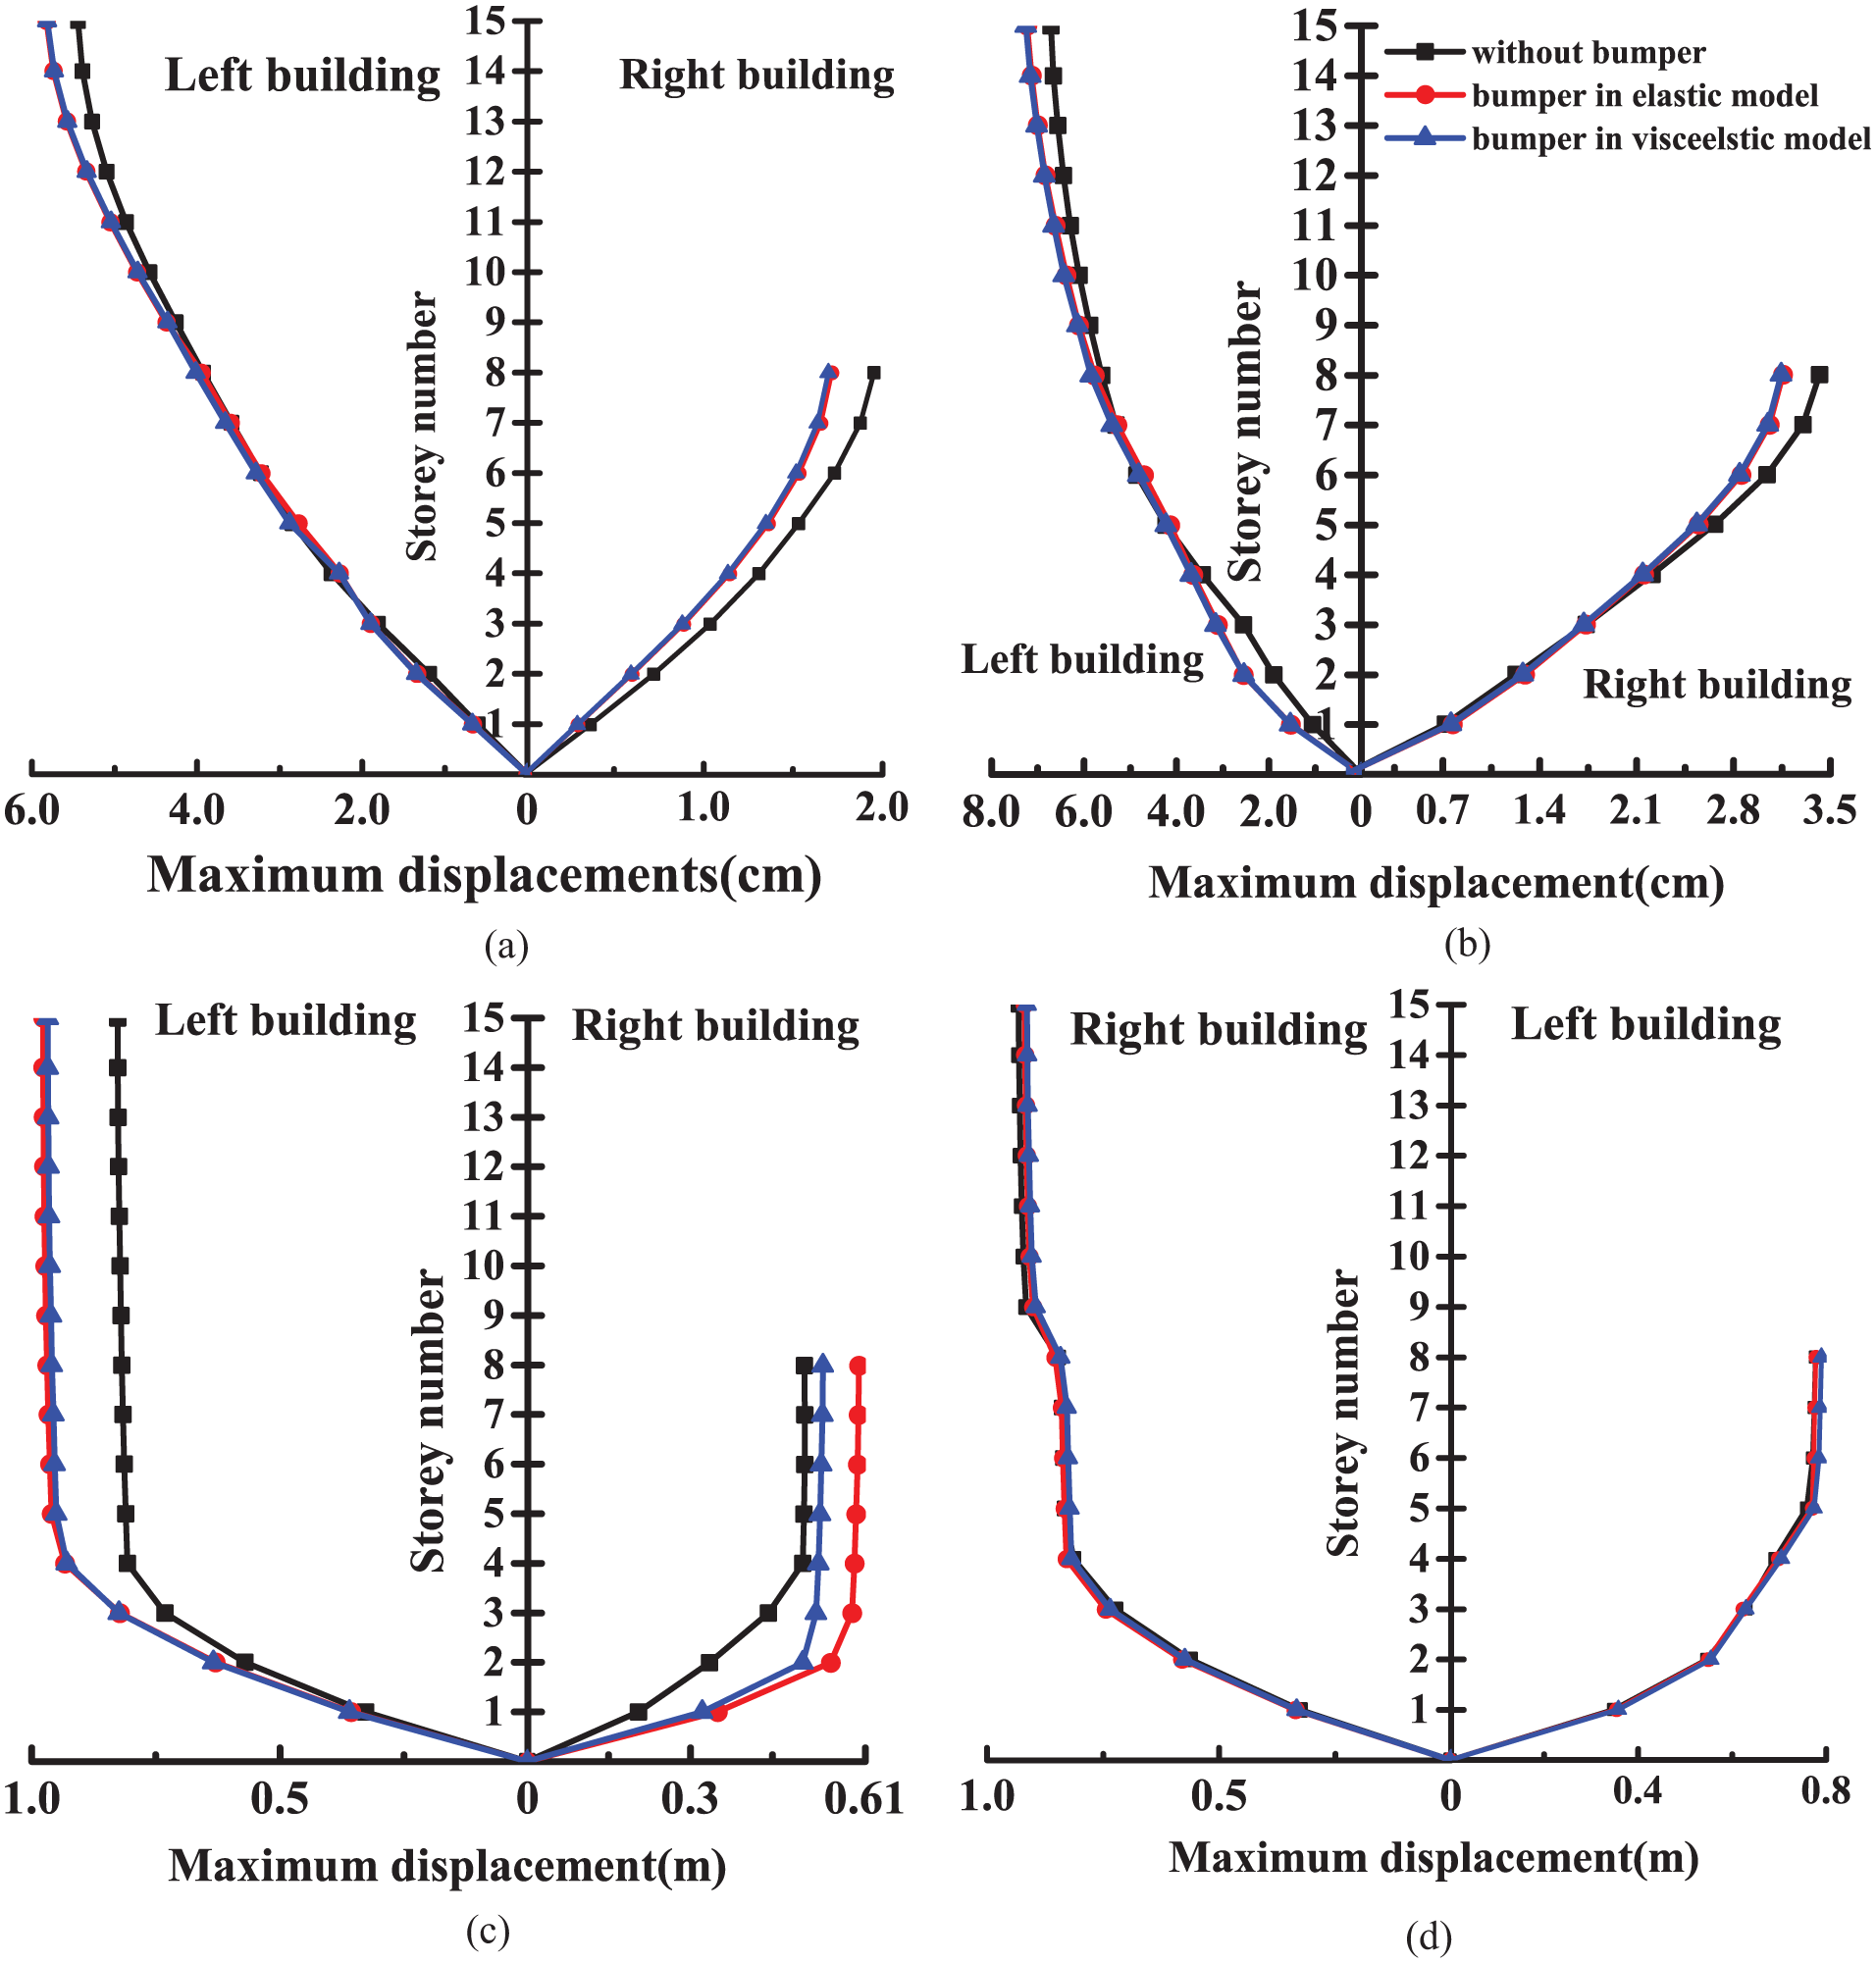
Maximum displacement value in different stories under various seismic waves: (a) El wave in W-E direction, (b) El wave in N-S direction, (c) Chichi wave in W-E direction, and (d) Tabas wave in W-E direction.
Parameter studies for bumpers
In this section, bumpers with different parameters are calculated to carry out parametric studies. Figure 18 shows dissipated damping energy for different thickness values of bumpers. In the left building, maximum thickness leads to maximum damping energy dissipation. And, higher stories have larger damping energy values. Unlike the left building, larger thickness value does not result in large energy dissipation in the right building. On the contrary, larger thickness leads to less energy dissipation, except in the case of w = 0.05 m. We can conclude that the existence of bumpers make energy dissipation re-arrange between two buildings, which makes energy dissipation in the left building increase and the right building decrease.

Dissipated damping energy for two buildings with different thickness values of bumpers: (a) 4th, 8th, and 15th stories in the left building and (b) 2nd, 4th, and 8th stories in the right building.
Figure 19 shows dissipated yielding energy for two buildings with different thickness values of bumpers. For the left building, larger thickness values selected lead to lower yielding energy values. When thickness is equal to 0.05 m, minimum yielding energy value is obtained. In the right building, it can be seen that curves trends are similar to the left building. But for higher stories, maximum thickness values cannot obtain minimum energy dissipation values, and thickness with 0.04 m gets the smallest value.
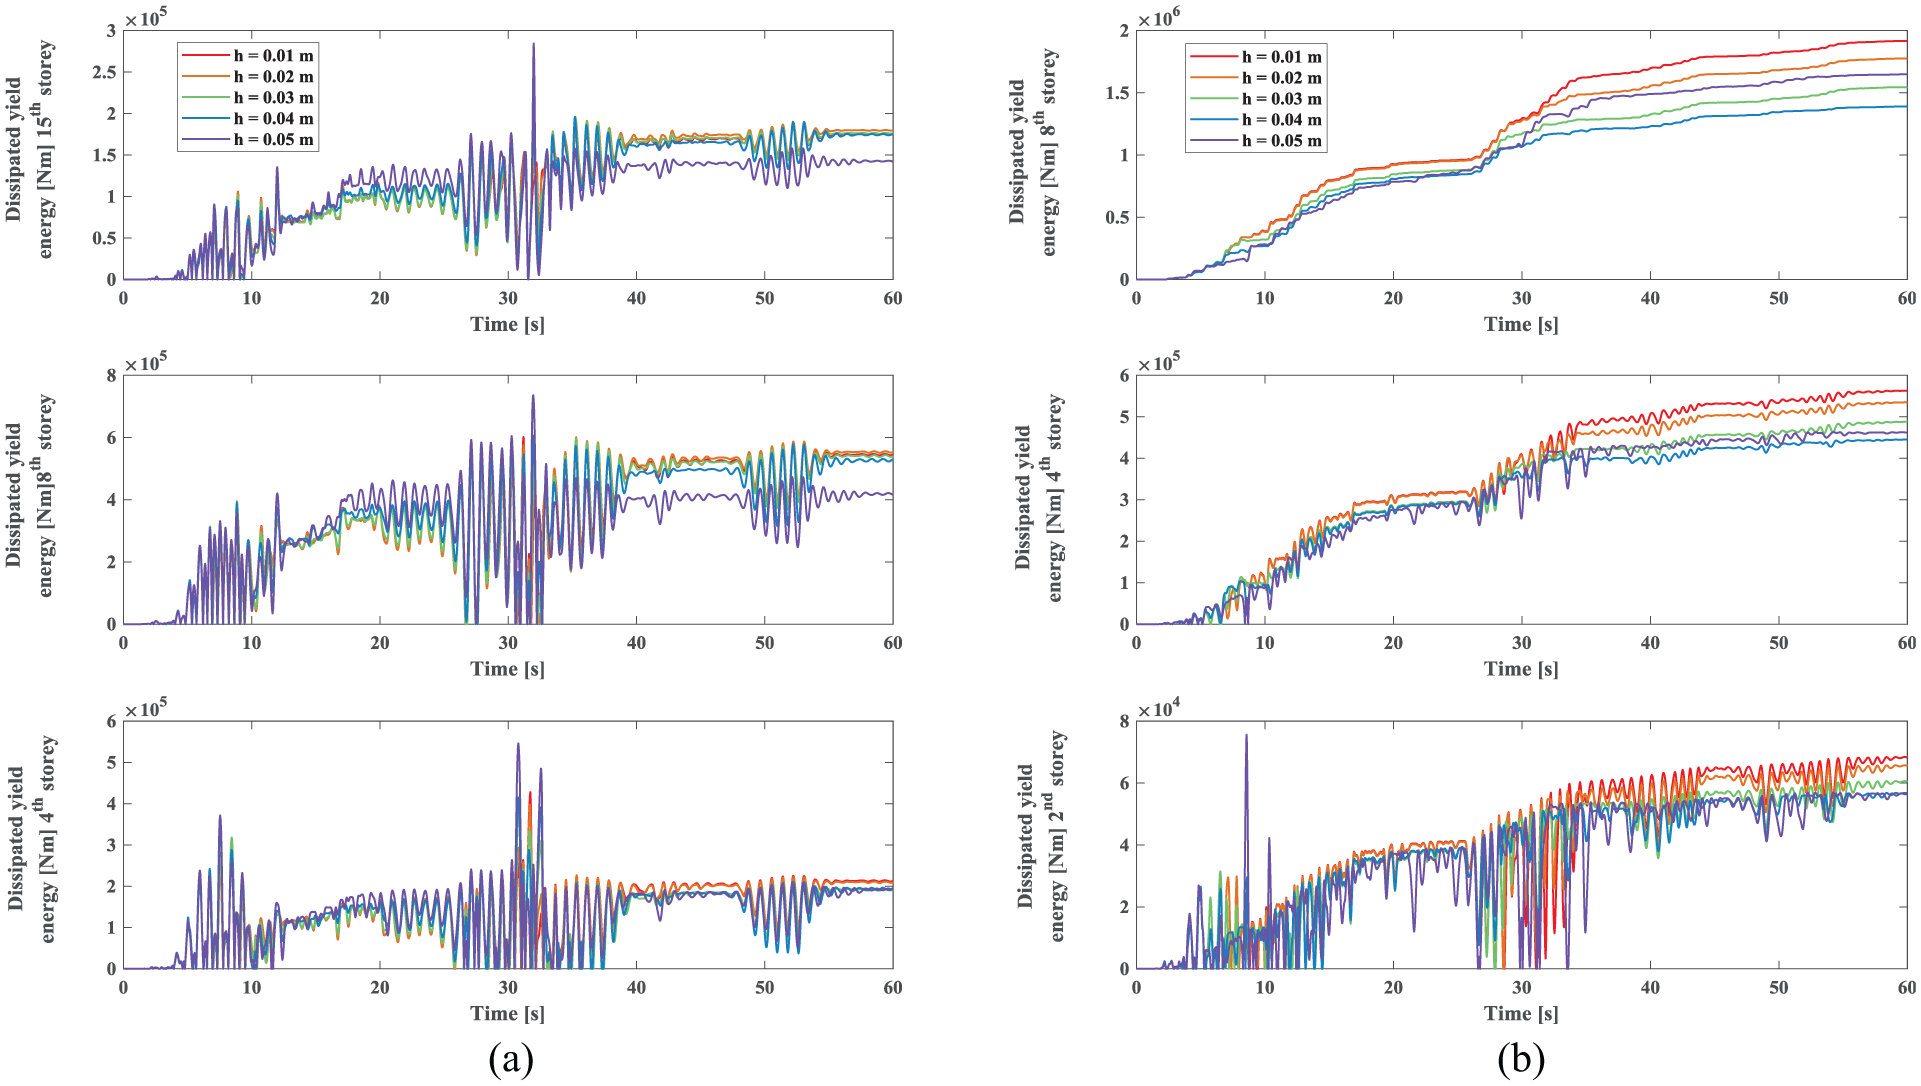
Dissipated yielding energy for two buildings with different thickness values of bumpers: (a) 4th, 8th, and 15th stories in the left building and (b) 2nd, 4th, and 8th stories in the right building.
Figure 20 shows the input energy for two buildings with different thickness values of bumpers. It shows same re-arrangement effects as yielding energy response. In the left building, larger thickness bumper lead to large input energy. And, in the right building, large thickness bumper resulted in smaller input energy.
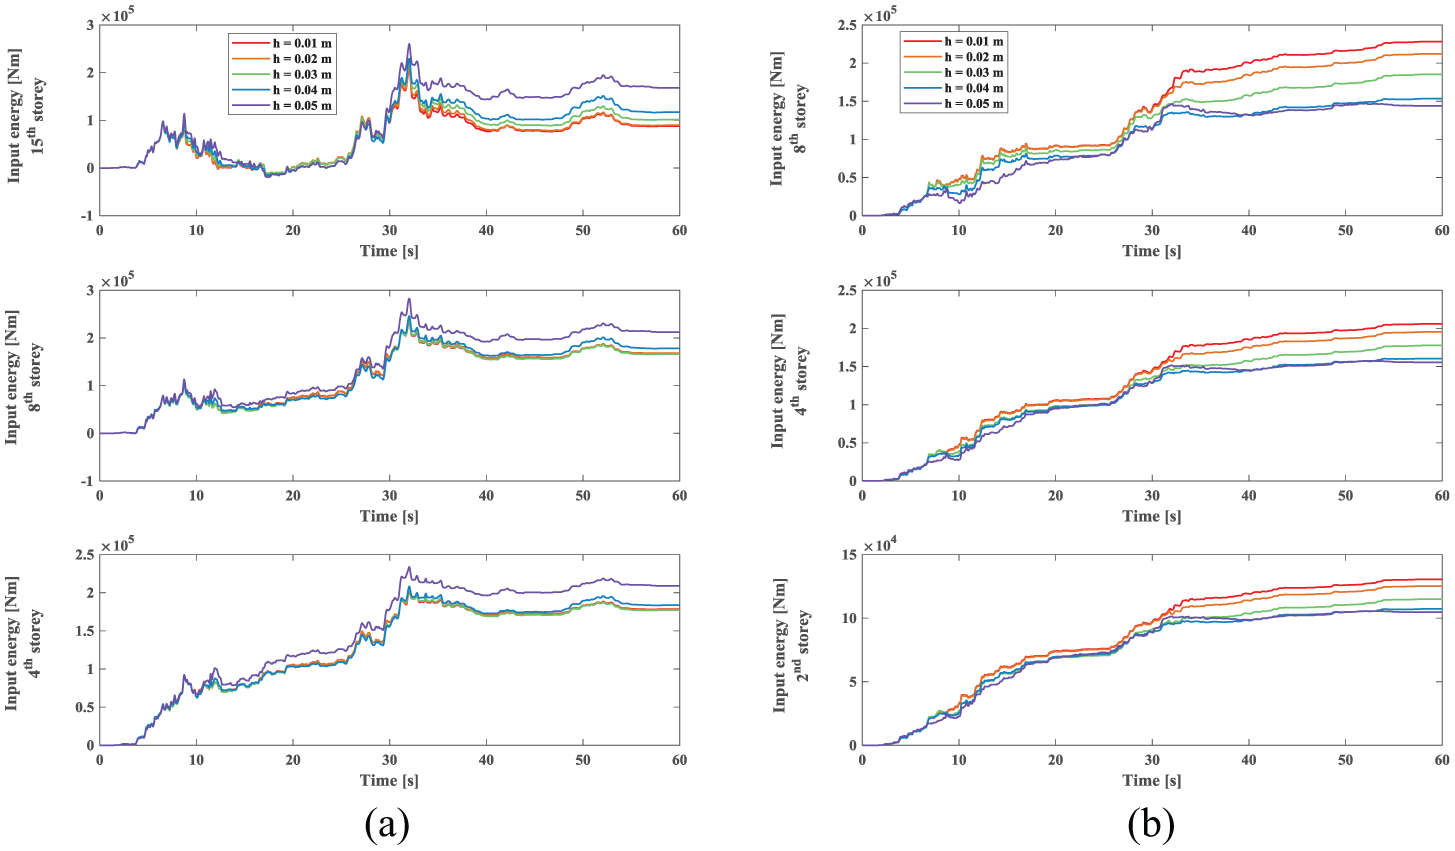
Input energy for two buildings with different thickness values of bumpers: (a) 4th, 8th, and 15th stories in the left building and (b) 2nd, 4th, and 8th stories in right building.
Figure 21 shows peak damping energy in different gaps in the case equipped with and not equipped with bumpers. Gaps change from 0.04 to 0.2 m, and viscoelasticity influences on bumper are considered by previous pounding force model. For both buildings, peak damping energy does not change for system without bumpers. In the case installed with bumpers, peak damping energy values first decrease and then increase rapidly in the left building. But in the right building, curves equipped with bumpers increase first and then decrease rapidly. When considering viscoelasticity of bumpers, variation magnitudes become larger than elastic pounding force models.
Peak damping energy in different gap value with and without bumpers: (a) 4th, 8th, and 15th stories in the left building and (b) 2nd, 4th, and 8th stories in the right building.
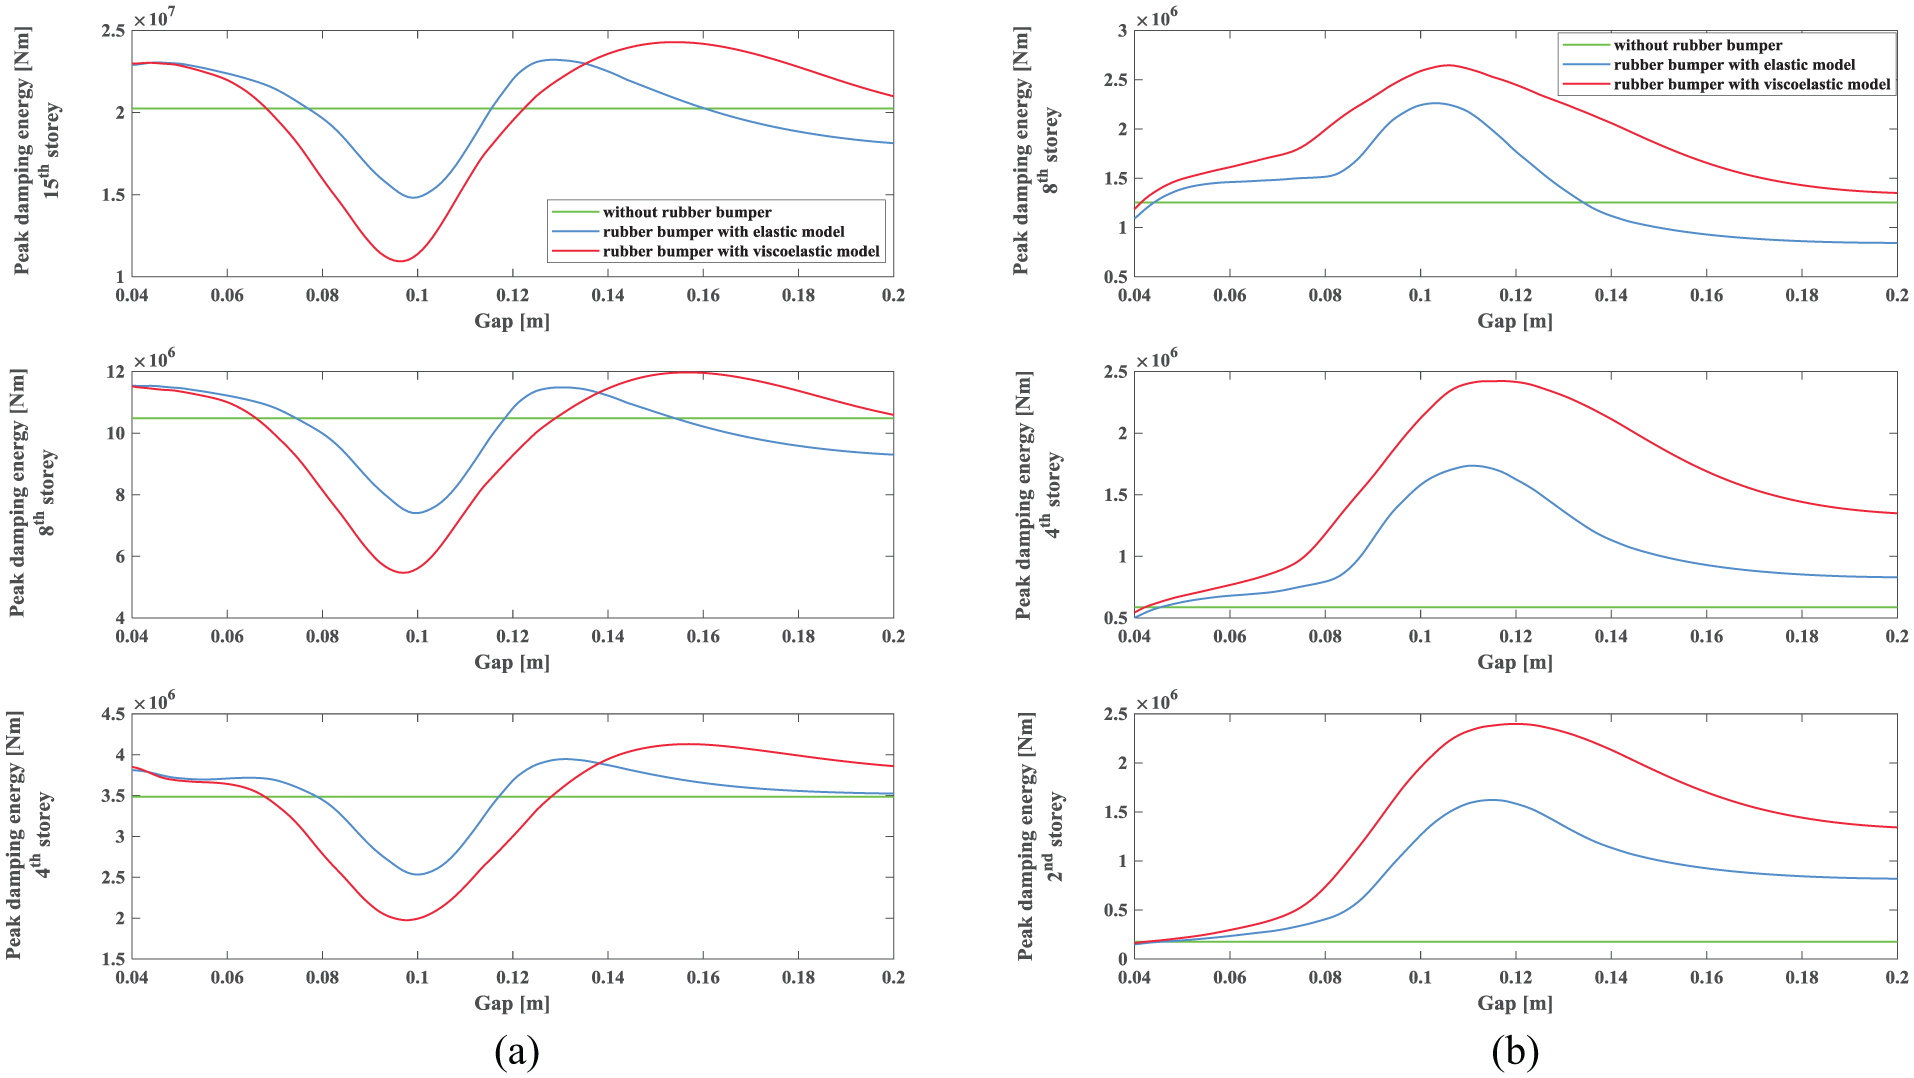
Figure 22 shows peak yielding energy in different gaps equipped and not equipped with bumpers. It can be found that curves are similar to peak damping energy results in Figure 21. For the left building, peak yielding energy curves varies up and down alternately as gaps increasing. For the right building, curves in 8th story have similar trends with the left building, and in lower stories, 2nd and 4th stories, curves keep increasing as gap value increases. Besides, curves considering viscoelasticity of bumpers lead to higher magnitude variation trend.

Peak yielding energy in different gaps values equipped and not equipped with bumpers: (a) 4th, 8th, and 15th stories in the left building and (b) 2nd, 4th, and 8th stories in the right building.
Parameter studies for bumper material’s viscoelasticity
In order to study the influences of viscoelasticity from polymer bumpers, energy responses in different constitutive parameter values are shown in following contents. According to previous analysis on elastic and viscoelastic pounding force models (Figure 2(b)), three-parameter viscoelastic constitutive model contains three parameters:
Figures 23 and 24 show input energy curves with different constitute parametric values and different pounding force models. Parameter C1 represents viscoelasticity component in polymer material. In Figure 23, Red, blue, and green curves are corresponding to elastic model, viscoelastic model with C1 = 4 × 10³ Pa/s−1, and viscoelastic model with C1 = 4 × 10⁴ Pa/s−1, respectively. It can be observed that there are no significant differences among these three curves. Figure 24 shows input energy responses to compare different C1 value influences. It can be seen that input energy responses of both the left and right buildings show certain differences in cases of C1 is equal to 4 × 10⁴, 4 × 10⁵, 4 × 10⁶, and 4 × 10⁷ Pa/s−1. This means viscoelasticity of bumpers affect input energy response in a certain range by C1 values. In this example, when C1 varies from 4 × 10⁴ to 4 × 10⁷ Pa/s−1, input energy values changes from 1.92 × 10⁵ to 2.41 × 10⁵ N m in 4th story of the left building at the end of calculation time. Comparing Figures 23 and 24, we can conclude that viscoelasticity of bumper material affects input energy responses only in a certain range. In this case, the range is from 4 × 10⁴ to 4 × 10⁷ Pa/s−1 for C1 values. Out of this range, viscoelasticity has almost no influence on energy performance. When C1 is small enough, energy response curve coincides with elastic model results (Figure 24). When C1 increases, energy response curves move upward until reach to the curve with C1 = 4 × 10⁷ Pa/s−1. This can be explained from constitutive model in Figure 2(b). When C1 is large or small enough, the whole three-parameter model can be approximated to elastic model. Upper and lower limits value of these two equivalent elastic parameters are
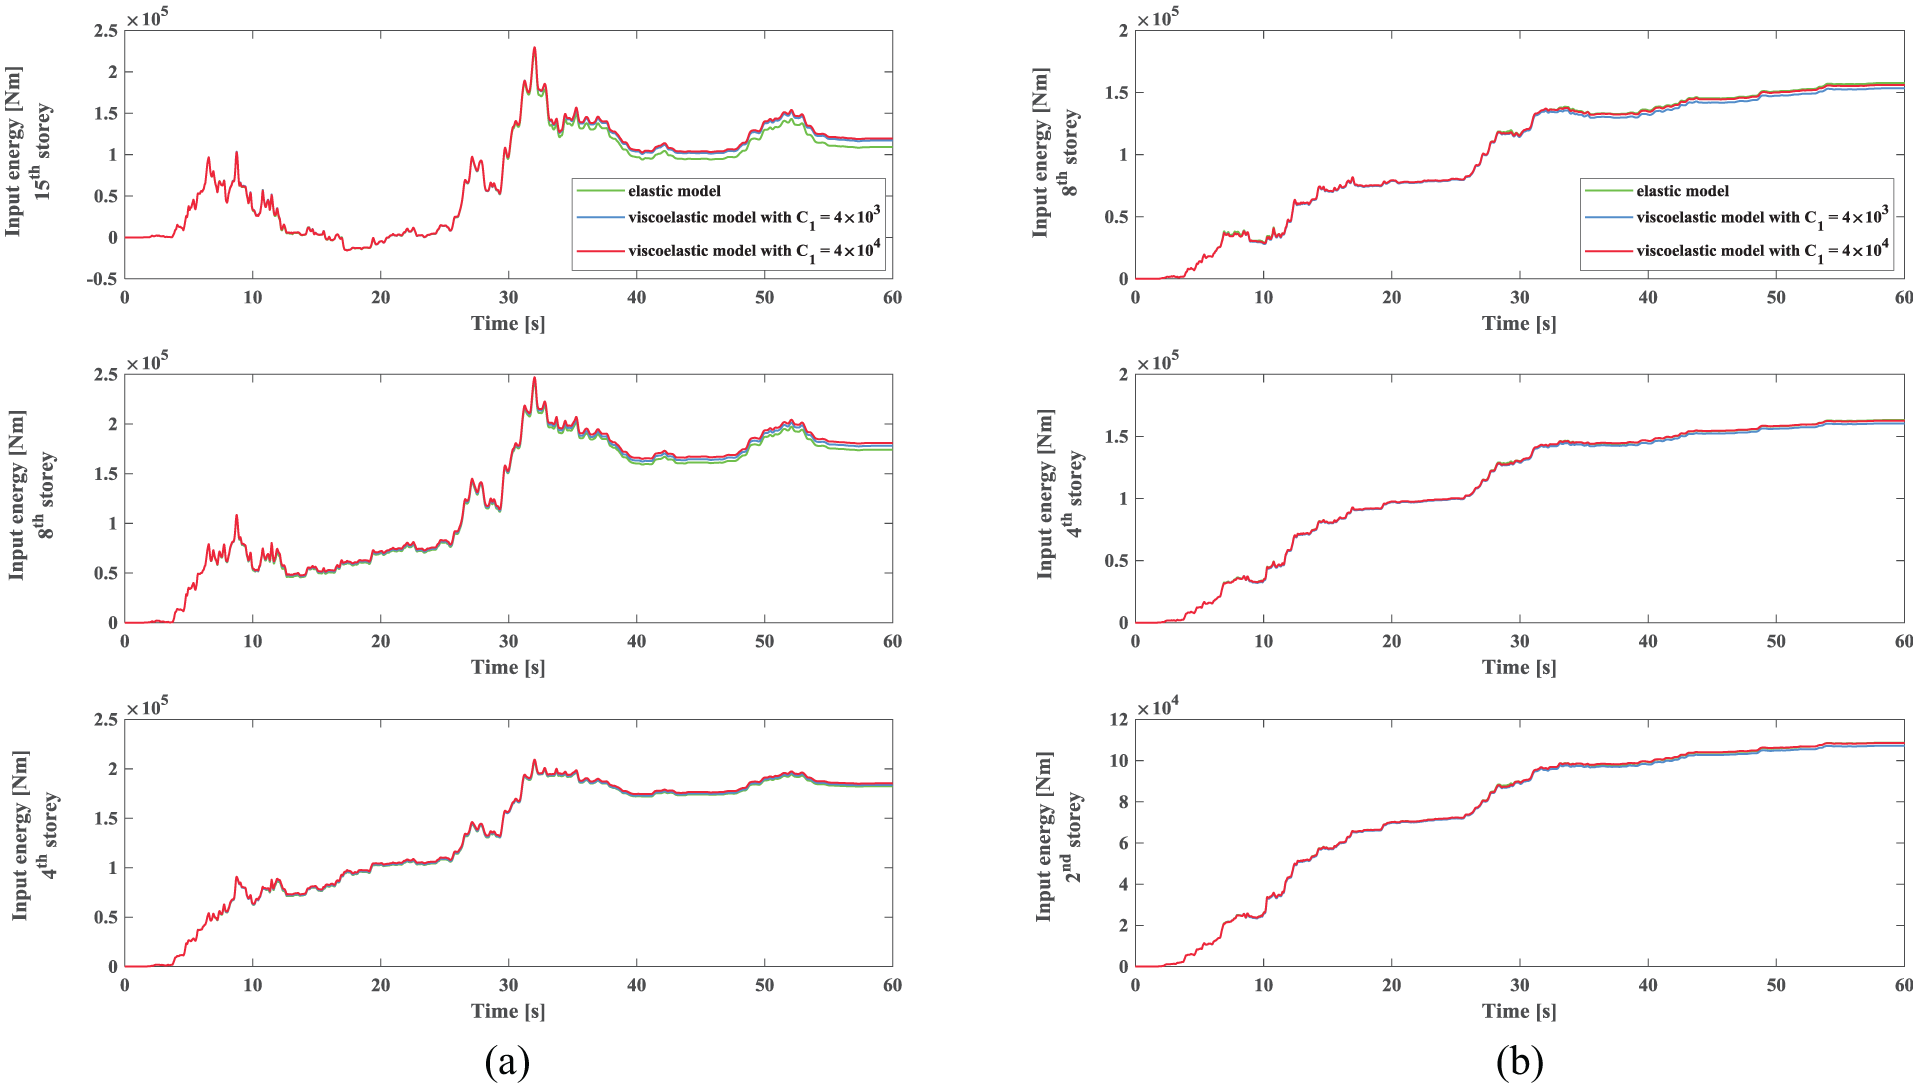
Input energy with different constitute parametric value of bumpers: (a) 4th, 8th and 15th stories in the left building and (b) 2nd, 4th, and 8th stories in the right building.

Input energy with different constitute parameter C1 values in different stories: (a) 4th, 8th, and 15th stories in the left building and (b) 2nd, 4th, and 8th stories in the right building.
Figures 25 and 26 are dissipated damping energy and dissipated yielding energy with different constitute parametric values and different pounding force models. For the left building of Figure 25, viscoelasticity parameter C1 has no significant difference except a delicate difference at 4th story. Obvious differences appear in the right building results: larger C1 values lead to higher dissipation damping energy values. And, similar conclusion can be drawn with results in Figures 25 and 26, which is there are upper and lower limits corresponding to two equivalent elastic parameters.

Dissipated damping energy with different constitute parametric value of bumpers in different stories: (a) 4th, 8th, and 15th stories in left building and (b) 2nd, 4th, and 8th stories in the right building.
Dissipated yielding energy with different constitute parametric value of bumpers in different stories: (a) 4th, 8th, and 15th stories in the left building and (b) 2nd, 4th, and 8th stories in the right building.
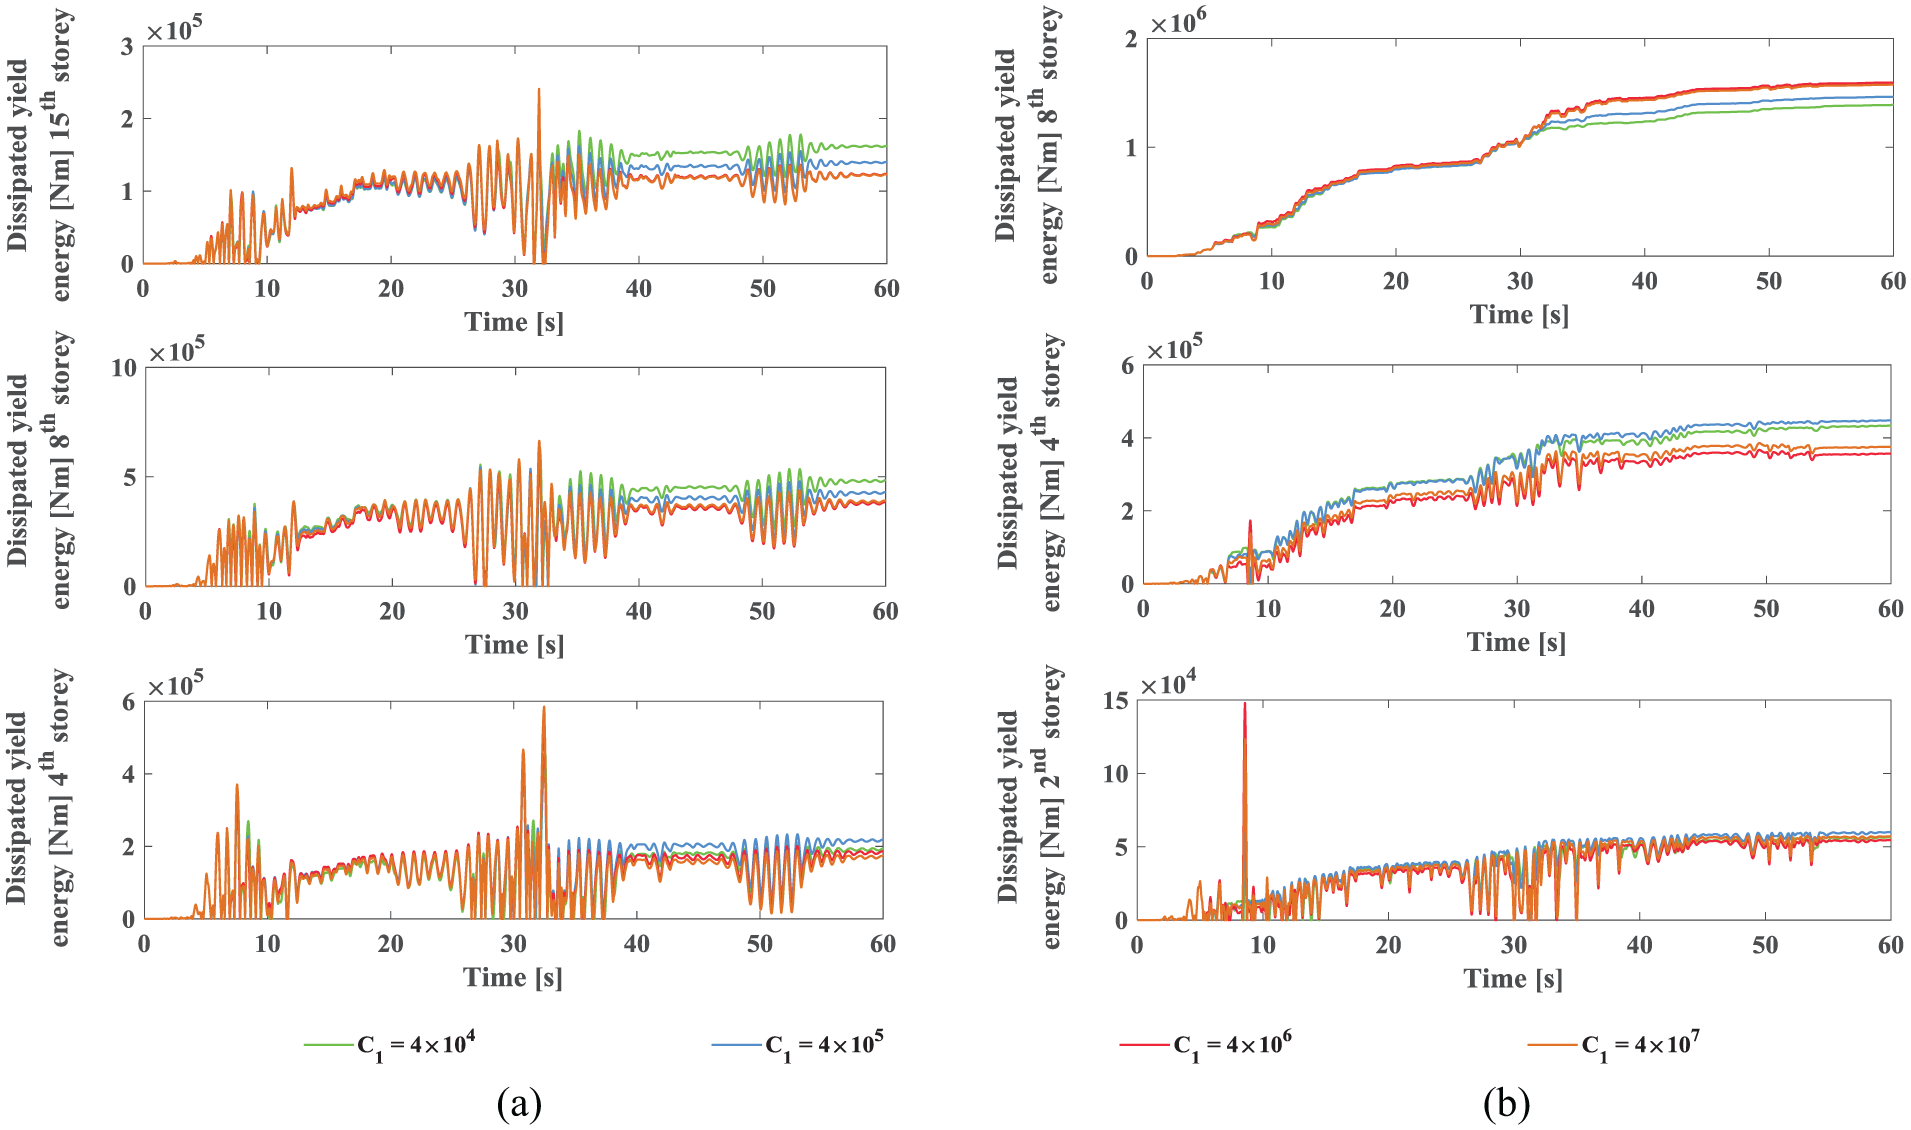
Figure 26 shows dissipated yielding energy with different viscoelasticity parameter (C1) values. In the left building, lower C1 values lead to higher dissipated yielding energy in 8th and 15th stories, but in the 4th story, the case of C1 is equal to 4 × 10⁵ Pa/s−1 obtains the largest dissipated yielding energy result. In the right building, larger C1 values lead to large energy dissipation in 8th story. But in the 4th story, the case C1 = 4 × 10⁵ Pa/s−1 gets the largest energy dissipation. And, in the 2nd story, all curves nearly coincide together and have a “pulse” at about 9th second. This is because a large plastic deformation happens here.
Conclusion
In this article, energy dissipation analysis is carried out on adjacent buildings equipped with polymer bumpers. Viscoelasticity of bumper materials are considered using a novel pounding force model. Comparisons and parametric studies are carried out and following results can be summarized:
A three-parameter viscoelastic constitutive model is utilized to illustrate polymer bumper’s mechanical properties. The novel viscoelastic pounding force model is proved effectively in simulating and calculating adjacent structural pounding with polymer bumpers. Although in many cases viscoelasticity has little effect on pounding forces and energy response time histories, it still has certain influence on maximum values, such as peak yielding energy, peak damping energy, peak values of shearing forces, and maximum story displacements.
Equipping with polymer bumpers on adjacent buildings can decrease maximum pounding forces under all types of seismic waves. In this example, maximum pounding force value decreases from 6.54 × 10⁶ to 4.89 × 10⁶ N after being equipped with polymer bumpers. At same time, times of shear forces reaching yielding limits under seismic loads are decreased too due to installing bumpers. However, pounding times and maximum displacements of stories increase after being equipped with bumpers. This is because installing bumper block between two adjacent buildings will reduce gap values, which is the decisive factor on preventing structural poundings.
Comparing pounding structure system equipped and not equipped with bumpers under different seismic waves, energy responses show sensitive characteristics to different earthquake waves. It can be observed that installing bumpers can re-arrange energy dissipation distribution between two adjacent buildings in El W-E direction wave. But for other three earthquake records, energy response curves show different trends.
Viscoelasticity of bumpers materials have a certain influence on structural energy dissipations. By conducting parametric study on C1, which is the key parameter related to energy dissipation in constitutive model, we can conclude that viscoelasticity of bumper material affects energy responses only in a certain range. In this example, the range is from 4 × 10⁴ to 4 × 10⁷ Pa/s−1 for C1 values. Out of this range, viscoelasticity has almost no influence on energy performance.
Gaps and sizes of bumpers also have significant influence on energy performance. Larger bumper sizes can enlarge the re-arranging effects under Kobe seismic waves. Gap values also affect peak yielding energy and peak damping energy significantly.
Footnotes
Handling Editor: Ali Kazemy
Declaration of conflicting interests
The author(s) declared no potential conflicts of interest with respect to the research, authorship, and/or publication of this article.
Funding
The author(s) disclosed receipt of the following financial support for the research, authorship, and/or publication of this article: The work was supported by the National Natural Science Foundation of China (51409056 and 51678322), the Natural Science Foundation of Heilongjiang Province (E2015047), the Fundamental Research Funds for the Central Universities (HEUCF180204), and the Taishan Scholar Priority Discipline Talent Group program funded by the Shan Dong Province.