
Abstract
One of the important successes of optical fiber sensor established for the security system is the detection and the recognition of any type of events. The performance parameters (event recognition, event detection position, and time of detection) are unavoidable and describe the validity of any perimeter detection system. An event recognition is any signal detected within the protected area, and it is related to a non-intrusion event and an intrusion event. To achieve the detection and the recognition events at the real time, an effective two-level vibration recognition method and a technique are proposed and presented in this article. The signal characteristics (short-term energy and short-time over-threshold) have been used and compared to the dynamic threshold to judge the type of event. Then the extraction of the power distribution features on the frequency domain through power spectral estimation on the suspected intrusion signal samples is carried out and finally combined with the time-domain characteristics as feature vector through Support Vector Machine to determine the efficiency and effectiveness of the proposed vibration recognition method. The experimental simulation results show that the proposed method is effective and reliable. With collected data, it can detect and recognize the type of event in real time.
Keywords
Introduction
With a broad social development and a scientific and technological progress, the distributed perimeter security system with fiber as sensor has been applied to oil and gas pipelines, prisons, military bases, and so on, because of its high sensitivity, good safety performance, timely response, wide monitoring range, and simple installation, where the field monitored by the current perimeter security system looks for hotspots.
The basic indicators of the perimeter fiber safety system are the system identification accuracy and the detection response time. The accuracy of system identification is related to the signal pattern recognition algorithm and the key is the selection of signal characteristics, while the detection response time depends on the complexity of the algorithm. In this article, wavelet decomposition is used as in Wu 1 and Yu et al.; 2 it is a packet decomposition method which spreads the signal on different scales to extract the energy distribution as a signal feature. For more specification, the classification method by using neural networks is involved in Wu 1 and Yu et al. 2 In Yousefi et al., 3 the multi-feature parameters (squared difference, short-time over-level ratio, short-time Fourier transform, and disturbance duration) are extracted, and the pattern recognition is carried out by using the weighted average comprehensive evaluation function. Two-level identification scheme4–7 is proposed, which in first placed through the time-domain features, after which the suspected perturbation position is extracted. Then the short-term Fourier transform is used to qualitatively analyze the spectral features that are in Liang et al. 5 and Li et al., 7 but in DiCarlo and Weber 4 and Zhu et al., 6 the energy distribution and vibration duration of different frequency bands are extracted in the complex wavelet domain as signal characteristics, and finally the Support Vector Machine (SVM) is used to classify them. The above literature describes the accuracy of the system identification of the implementation scheme but does not evaluate the real-time performance. Therefore, in view of the system’s need for effectiveness and real time, two-level vibration recognition method is proposed in this article and the steps are as follows: first, preliminary discrimination of event types is performed by time-domain features, and the non-suspected disturbance data are directly produced as a non-intrusion type. The frequency-domain feature extraction is performed on the suspected disturbance data, which is the prejudgment result of the first step. Finally, the frequency-domain feature extraction is combined to time-domain features that are input into the SVM to determine the event type. The article focuses on the characteristics of modern power spectrum of different event types, to verify and analyze the accuracy and real time of system identification. This reliable and effective method can recognize not only the different event types but also the real time of the intrusion event, thus the validity of this article.
Principle of distributed optical fiber vibration detection
In H Wu 8 and Z Pan et al., 9 phase-sensitive optical time-domain reflectometry (Φ-OTDR), which is a sensing controller device, was presented and described. Based on the principle of Φ-OTDR, it will inject a strong light of high-frequency stability into the optical fiber, using the photo detector to detect the coherent interference intensity of the scattered Rayleigh light backward in the pulse range. When the fiber perturbation is detected, the interference intensity at the perturbation position changes correspondingly due to the elastic effect.
Installation of the system
The system installation and the quality of the equipment are very important to get a very good system performance, but they are often underestimated. The sensing cable must be attached correctly on the fence, which needs to be built in a reasonable standard. Failure to achieve fence construction standards and/or proper sensing cable attachment will result in poor performance or accuracy of the system, especially in the long run. Poor installation of the fence generates an excessive nuisance signal and a hypersensitivity of the fence due to the environmental noise.
In the implementation of the fence-cable mounted perimeter systems in Katsifolis, 10 the sensing cable is attached to the perimeter fence from the sensing machine detector Φ-OTDR to the end of sensor located in pit, and the cable is applied to the fence in chain link and in palisade styles as shown in Figure 1.

Implementation of the whole system (optical cable on a fence and in the ground).
In fact, the quality of the system installation enables optimal performance of any nuisance mitigation algorithms employed, while its poor installation brings a non-accuracy of the system whatever the mitigation algorithm used.
System performance parameters
The three system performance parameters, the event recognition, the event detection location, and the time of detection, describe the validity of any perimeter detection system. Event recognition is any signal detected by the system, which is related to a non-intrusion event and an intrusion event. A non-intrusion event is typically generated by environmental conditions such as rain, wind, snow, industrial noises, and other ambient noise sources, while an intrusion event is actually generated by the sensitivity of the protected area such as climbing, tapping, digging, cutting, and so on. When recognition is carried out, the detection position and the time of detection become paramount to achieve the security of the protected area. Aside the three important performance parameters mentioned above, false alarm which is not related to the sensor or an event can be considered; it is generated by the system electronics as explained in S Mahmoud and J Katsifolis. 11 In fact when the equipment is of good quality, the false alarm is minimized in the system design and may not occur. The feature extraction is used to reduce the noise giving way for a better view of the signal. As presented in Figure 2, the intrusion signal will be detected before and after the subtraction of both moments; therefore, the location of the mutation is the invasion position.
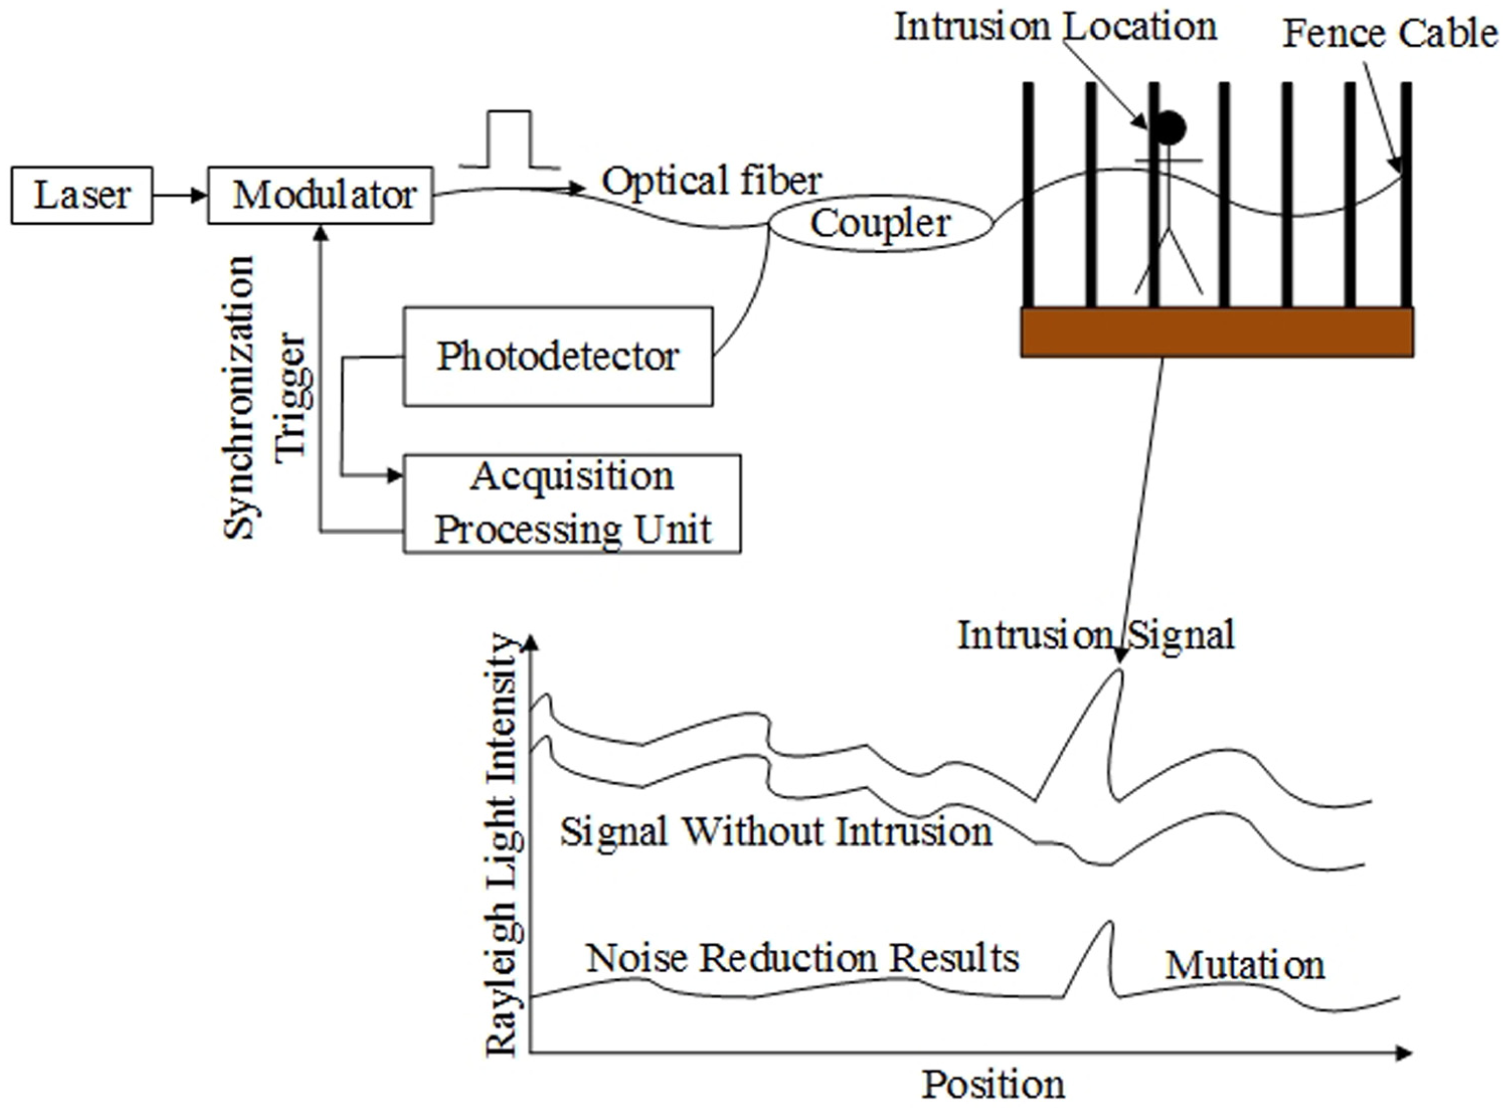
Distributed fiber vibration detection principle.
According to the curve of light intensity, the characteristics of optical fiber vibration signals are analyzed. There is a difference between the disturbance signal strength and the vibration frequency. Therefore, the identification of the type of event is obtained by identifying the main characteristic of the extracted signal.
System indicators and requirement analysis
With the objective to detect the real time of events happening on the fence cable, there are some indicators which have to be analyzed successfully and they are known for a good and reliable perimeter security system.
System indicators
Distributed Fiber Perimeter Security Systems are designed to promptly detect the offensive or the destruction behavior made on the perimeters, in order to take safety precautions, thus defining the event types as intrusion and non-intrusion events. The intrusion includes a variety of conditions: climbing, dragging, knocking, cutting fence or cable, and so on. The non-intrusion events include a variety of weather conditions such as winds, heavy rainfall on the fence, or cable vibration. The system identification accuracy refers to the probability that the system will accurately identify the type of event; the detection response time refers to the time it takes for the system to identify the type of event that occurred along the location on the optical fiber cable.
With the development of optical fiber sensing technology and photoelectric detection technology, the distributed fiber perimeter security system for effectiveness, real time, and positioning accuracy put forward higher demand. Based on the GA/T 1217-2015, which is the standard implementation issued by the Ministry of Public Security of the People’s Republic of China, the system has high index (the standard indicators and the system indicators) which is shown in Table 1.
Comparison of standard and system indicators.

Requirement analysis
1. Identify the accuracy requirements: In order to ensure the accuracy of system identification to meet the target requirements, the fiber vibration signal feature extraction plays a key role. By analyzing the same characteristics of signals of different event types, two significant notifications arise:
• There is the very high similarity between the signal features of the same event types.
• The signal characteristics of different event types have the highest degree of discrimination.
2. Detection response time requirements: Considering the system requirements for the detection response time and the need for signal signature analysis, the unit time window length is set to 0.4096 s for each data sample as well as the real-time data acquisition, where each data are allocated to 16 bits under the current system conditions. The quantity of data collected by the system per unit time window is reached to 108 (0.4096 × 10K × 10K/4 × 16) and the allocation of 100 megabytes of memory is needed to cache the data coupled with the calculation of the data analysis and processing; therefore, the system overhead increases significantly. In order to reduce the system overhead and time cost, the importance of algorithm selection is more prominent. The detection response time is equal to the sum of the three following elements: the data acquisition time, the data processing time (secondary vibration pattern recognition time), and the delay redundancy. To prevent data disasters caused by improper data processing, it is necessary to control the secondary vibration pattern recognition time within 0.4096 s of the unit time window of real-time data acquisition.
Vibration pattern recognition scheme
The vibration pattern recognition scheme design needs to consider three elements, namely, signal feature extraction, classification algorithm, and implementation efficiency. When the sensing fiber is not affected by the external noise, the amplitude and fluctuation of the vibration signals are very low, and when the external noise directly or indirectly cause the fencing cable vibration, the amplitude of the signal and vibration frequency will increase. Therefore, it is clearly significant to extract the time-domain features and the frequency-domain distribution features of the signals to distinguish the event types.
The system works in a normal state most of the time, and the disturbance is detected for only a short period of time. In the normal state, the system only needs to monitor the time-domain features. When the time-domain feature detection exceeds the set threshold, the frequency-domain features are combined for pattern recognition, in which case a two-level vibration pattern recognition scheme is proposed. This scheme can reduce a large number of complex calculations in the data transfer processing of the frequency domain. The algorithm implementation process is shown in Figure 3.

Flow diagram of the system vibration pattern recognition.
First stage: time-domain prejudgment
The collected optical fiber vibration signal contains the system noise, the ambient noise, and uncertain external disturbances; this is called a discrete non-stationary time-varying signal. In order to filter out the low-frequency drift of the system and reduce the impact of low-frequency noise, after a large number of data analyses, a sixth-order Butterworth high-pass filter with a cutoff frequency of 500 Hz is used to denoise the signal.
The time-domain feature selection of the optical fiber vibration signal is based on short-time energy and short-time over-threshold rate; by comparing the two characteristics of the sample within the unit time window with the dynamic threshold size, the samples of the suspected perturbations are initially screened. The specific steps are as follows.
In the first step, the noise reduction is performed on the data samples in the unit time window, and each data in the data samples after noise reduction are denoted as

where

And the threshold

The equation (a) means that there is disturbance, while equation (b) means that there is no disturbance. If a disturbance occurs along the fence cable, it has locality in time and space distribution, and most of the area is normal most of the time. According to the histogram statistics of short-time energy and short-time over-threshold rate of sensing points along the line, short-time energy
Second stage: vibration pattern recognition
Modern power spectrum estimation
In the study of signal vibration frequency, the Fourier transformation method is commonly used to determine the signal; for non-stationary time-varying signals, wavelet transform is generally used to obtain energy spectra on different scales, but wavelet transform is also based on Fourier transform theory. However, there are still limitations of the window function because the frequency of time conversion in Liang et al. 5 cannot accurately be described, and the frequency-domain resolution is low. After a large number of measured data analysis, the effective information of the optical fiber vibration signal collected by the system is mostly included in the mid-band frequency, so the method of modern power spectrum estimation with higher frequency-domain resolution is selected to extract the frequency-domain features.
The original signal of the real power spectrum is estimated by the power spectrum estimation based on the finite-length fiber vibration signal. The classical spectrum estimation assumes that the unknown data outside the data workspace are zero, resulting in a reduced frequency-domain resolution and an unstable spectrum estimation. The modern spectrum estimation estimates in first position the model parameters from the observed data of the signal; the power spectrum of the signal is estimated according to the output power of the model, which outperforms the classical spectrum estimation in Zhang et al. 12 This article uses the Auto Regressive (AR) model based on the method of modern power spectrum estimation as in Yao, 13 model Parameters (Model Order, Coefficient, and Variance of Excited White Noise Sequence). Burg algorithm is used for the extraction, because it has better frequency-domain resolution and a good quality of spectral estimation than other parameters of the extraction methods. The modern power spectrum estimation for data samples of different event types has its inherent characteristics from the power size and frequency-domain power distributions. As displayed in Figure 4, Figure 4(a) shows the data sample signal in normal condition, while Figure 4(b) represents the environmental interference data samples (strong wind, heavy rains), and Figure 4(c) stands for the intrusion data sample signal (tapping and climbing). The data samples under intrusion events have a power profile similar to that shown in Figure 4(c).

Results of the modern power spectrum estimation for three different types of data samples: (a) the data sample signal in normal condition, (b) the environmental interference data samples (strong wind, heavy rains), and (c) the intrusion data sample signal (tapping and climbing).
Extraction of power distribution characteristics in the frequency domain
According to the results of modern power spectrum estimation, the power distribution features in frequency domain are extracted. The power spectrum is estimated to have a total of K frequency points, and the total number of the frequency points is set according to the requirements. The optical pulse scanning frequency of the system is 10 kHz; according to the Nyquist sampling theorem, the frequency effective range of the spectrum estimation result is in the range of 0 to 5000 Hz. The time variation of the power spectra is divided into six frequency bands as displayed in Figure 5.

Intrusion signal frequency band with the time variation: (a) the band of the range 0–500 Hz, (b) the band of the range 501–1000 Hz, (c) the band of the range 1001–2000 Hz, (d) the band of the range 2001–3000 Hz, (e) the band of the range 3001–4000 Hz, and (f) the band of the range 4001–5000 Hz.
The power
In order to describe the power distribution characteristics of different frequency bands in different event types more clearly, the frequency-domain power distribution features of different disturbance types in the unit time window are plotted in a graph. It can be found that the frequency distribution characteristics of the same event type signals are relatively concentrated and frequency distribution characteristics of different event types are relatively scattered, as shown in Figure 6.
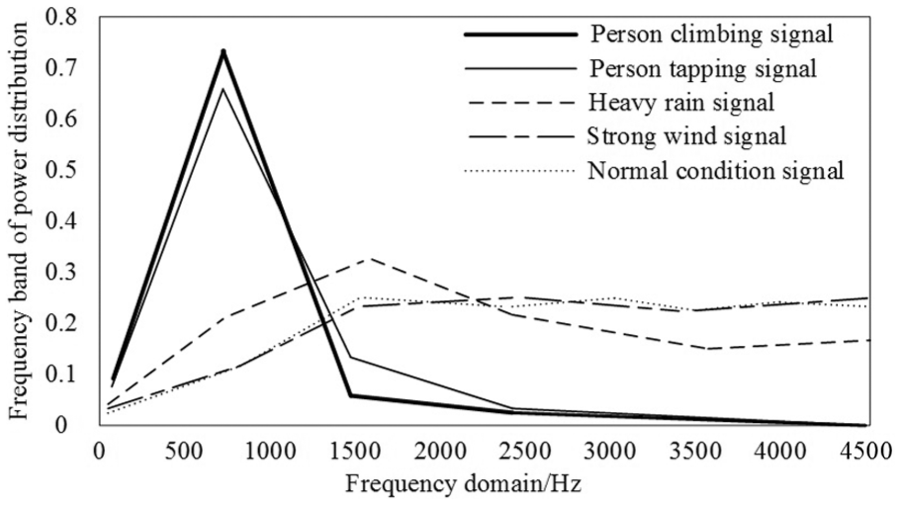
Power spectrum distribution characteristics of each band for different event types of data sample.
SVM classification implementation
SVM provides a classification algorithm that quickly discerns two or more types of problems. In this article, the suspected disturbance events along the fence cable are classified according to different types of intrusion and non-intrusion events by SVM.
By collecting large quantities of offline data of tapping, climbing, and non-action on the fence cable during strong wind, heavy rain, and normal weather conditions. The data samples that cut into the window of the unit time are used for the extraction of the time-domain features. The characterization of the modern power spectrum distribution increases the flag bit L to calibrate the event type (intrusion type L is 1 and non-intrusion type L is 0). At this time, each data sample corresponding to the vector
Experimental demonstration and time analysis
Experiments must always be done, demonstrated and verified in a very clear manner in order to validate the obvious success of the research. Several sets of sample features have been selected in different environmental conditions such as light and strong wind, light and strong rain, knocking and climbing on the fence cable in the normal conditions, and light and strong wind and rain.
Verification of program validity
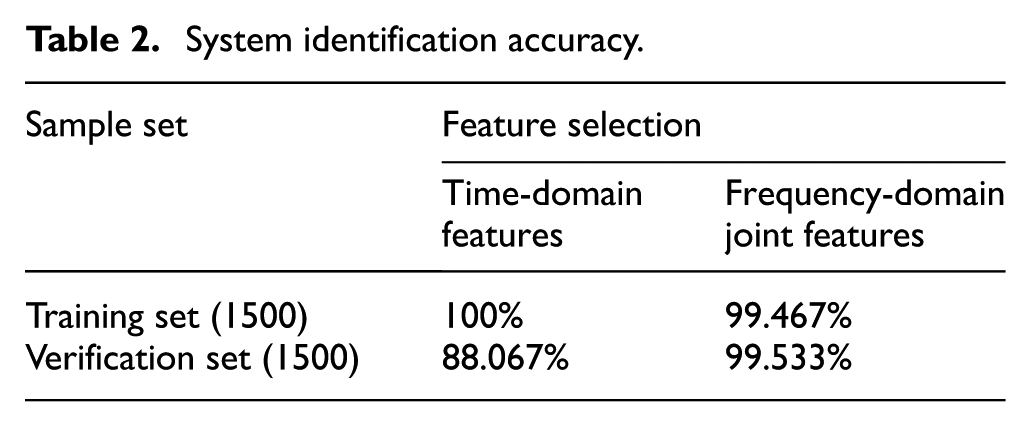
In total, 3000 sets of sample features are selected from the sample signature database. In that selected set, there are a group of 1000 sample features which includes the signal samples of percussion and climbing on the fence under normal conditions and during heavy rain, and a group of 2000 sample features which includes optical vibration signal samples for various environmental conditions. SVM is used to carry out the performance test of the classification model and to compare the accuracy of system identification before and after adding the power distribution feature of modern power spectrum. In comparison, the recognition accuracy rate increased by nearly 11 percentage points, reducing the false alarm rate of the system. The experimental results are shown in Table 2.
System identification accuracy.
System real-time analysis
The above-mentioned algorithm has been validated based on the standard C language version of the Reactive C (RC) embedded in the system for real-time analysis. Due to the large error in processing time of a set of sample data, when the number of suspected disturbances in 2500 samples is 250, the system data processing time is about 0.2839 s, which is less than the real-time data acquisition time of 0.4096 s. The probe response time is about 0.6953 s (ignoring the delay redundancy) which is far less than 2 s, so the fiber perimeter security system based on the vibration pattern recognition scheme in this article is achievable and has good real-time performance.
Conclusion and future work
Considering the problem of system implementation, two-level pattern recognition scheme has been used in this article to identify the types of events along the fenced fiber optic cable. First of all, the suspected perturbation signal was screened by comparing the short-term energy and short-term over-threshold rate with the dynamic threshold. Then, based on AR model, the modern power spectrum estimation of the model extracts the power distribution features of the high-frequency-domain resolution and establishes a feature sample database used as input in SVM for classification and prediction. The accuracy of the system identification can reach 99%, which ensures the system’s validity. When the detection range of the system is 10km with the disturbance range of 1 km, the data processing time is only 0.2839 s. This reserves sufficient margin for the possible delay of system data acquisition and processing, and fully guarantees the real-time performance of the system.
Even though the algorithm proposed in this article is reliable by offering a good flexibility and robustness, in the future work, an algorithm to detect and classify the underground fence disturbance, the fence cutting, dragging, and so on, will be carried out.
Footnotes
Handling Editor: Fei Yu
Declaration of conflicting interests
The author(s) declared no potential conflicts of interest with respect to the research, authorship, and/or publication of this article.
Funding
The author(s) disclosed receipt of the following financial support for the research, authorship, and/or publication of this article: This work has been supported by the National Natural Science Foundation of China (No. 61672338 and No. 61873160).