
Abstract
Dynamic and quasi-static tensile tests of 5083P-O aluminium alloy were carried out using RPL100 electronic creep/fatigue testing machine and the split Hopkinson tension bar, respectively. The dynamic constitutive relation of the material at high strain rates was studied, and the constitutive model in accordance with Cowper–Symonds form was established. At the same time, a method to describe the constitutive relation of material using the strain rate interpolation method which is included in LS-DYNA software was proposed. The advantages and accuracy of this method were verified by comparing the results of the finite element simulation with the fitting results of the Cowper-Symonds model. The influence of material strain rate effect on squeezing force, energy absorption and deformation mode of the squeezing energy-absorbing structure based on the constitutive models of 5083P-O were studied by means of finite element simulation. The results show that when the strain rate of the structure deformation is low, the material strain rate strengthening effect has little influence on the structure. However, with the increase of the strain rate, the strengthening effect of the material will improve the squeezing force and the energy absorption of the structure, and will also influence the deformation mode, that is, the decrease of the deformation with high strain rates while the increase of the deformation with low strain rates.
Keywords
Introduction
With the increase of train collision accidents, people pay more and more attention to the passive safety of train operation besides the active safety control. When collision of trains happens, the cab and the energy-absorbing structure at the front of the train are the main areas of deformation and energy absorption. Normally, these structures suffer different strain rates during the deforming process. 1 At present, the material model is usually simplified when the finite element simulation of train collision is performed, and the strain rate effect of the material is generally ignored.2–6 However, relevant studies on the collision behaviours of ship and automobile showed that the difference of strain rates had different influences on the structure, and the simulation results considering the strain rate effect are closer to the actual test results.7–9 Therefore, it is necessary to study the dynamic constitutive relations of materials and apply these relations in the finite element simulation of train collisions, so as to improve the accuracy of the simulation.
Aluminium alloy is widely used in the carbody structure of trains. Numerous studies on the dynamic constitutive relations of aluminium alloys have been carried out and it can be seen that the strain rate sensitivity is quite different for aluminium alloys with different chemical components and different heat treatment methods.
Most of the aluminium alloys have positive strain rate sensitivity, that is, the stress will increase with the increase of the strain rate at the same plastic strain level. The positive strain rate sensitivity of pure aluminium L2 is obvious at room temperature. 10 The flow stress of pure aluminium increases linearly with the logarithm of strain rate at room temperature, and the strain rate sensitivity increases at rates above 103 s−1. 11 Wang and Zha 12 found that 3004 aluminium also showed a remarkable strain rate effect and temperature effect. The stress of 3004 increases with strain rate increasing while decreases with temperature increasing.
However, with increasing alloy content or processing, such as heat treating or cold working, the strain rate sensitivity for aluminium alloys decreases. 13 The sensitivity of 2024 and 7050 aluminium alloys is relatively low, and the experimental results showed that both the alloys had no strain rate sensitivity at large-scale strain rate of 10−4 ∼ 104 s−1. 14
Besides, part of the aluminium alloys possess lower strain rate sensitivity in low strain rate range compared with the sensitivity in high strain rate range, such as 2A70 and 2A16-T4 aluminium alloys.15,16 The tensile tests of 2A70 were carried out by using smooth round bar over a wide range of strain rates from 0.1 to 4000 s−1, and the results indicated that 2A70 showed relatively evident strain rate sensitivity, especially for the strain rates above 1000 s−1. 15 The strain rate hardening effect of 2A16-T4 aluminium alloy is not obvious between 10−4 and 102 s−1, but it is obvious between 102 and 103 s−1. 16 Similarly, Masuda et al. 17 showed an increase in strain rate sensitivity at strain rates above 103 s−1 for 6061-T6. Similar trends have been observed by Oosterkamp et al. 18 for AA6082 and AA7108 and by El-Magd and Abouridouane 19 for AA7075.
What is more interesting is that the flow stress of 2219 aluminium alloy increases significantly from quasi-static to 1000 s−1, while remains constant in the strain rate range of 1000 ∼ 3000 s−1. 20 In addition, 5083H116 aluminium alloy shows negative strain rate sensitivity. 21 As for 5083H111 aluminium alloy, there is a strain rate softening effect at low strain rates, a re-strengthening property at medium strain rates and a significant strain rate strengthening effect at high strain rates. 22
5083P-O aluminium alloy is one of the commonly used materials in the manufacture of carbody. However, studies on its dynamic constitutive relation are still inadequate. In the present work, the dynamic behaviour of 5083P-O aluminium alloy was investigated by using split Hopkinson tension bar (SHTB) at high strain rates. And then the constitutive model of the material was established based on the test results. Finally, the influence of the strain rate effect of 5083P-O on the axial crash performance of squeezing energy-absorbing structure 23 was studied.
Materials and methods
The test material is 5083P-O aluminium alloy which was provided by a railway company in the form of original plate. The material is just the one described in Meng et al. 24 The specific properties of the material can be referred to the reference, where the density is about 2660 kg/m3, the average hardness is about 77 HV, the microstructure is mainly the α phase matrix (solid solution of Mg in Al) and the β precipitate phase (the intermetallic compound Mg5Al8 formed by Mg and Al), and the chemical components are listed in Table 1.
Chemical components of 5083P-O aluminium alloy (wt%). 24

By using the extensometer to measure the strain data, the quasi-static tensile tests were performed on the RPL100 electronic creep/fatigue testing machine under strain rate control. The dynamic tensile tests were carried out on the SHTB device. All the specimens were machined from the same alloy plate with the size of 500 mm × 500 mm × 6 mm. Due to the limit of the plate thickness, the section of the threaded end was not a perfect circle, but consisted of two arcs and two straight lines. Therefore, the thread was only processed on the arc segment. The geometry and dimensions of the specimen used for the quasi-static tensile tests and for the dynamic tensile tests are shown in Figures 1 and 2, respectively.

Specimen for quasi-static tensile tests.

Specimen for dynamic tensile tests.
As shown in Figure 3, the SHTB device consists of the striker, the incident bar, the transmission bar, the bumper, the high dynamic strain indicator and so on. The diameters of the incident bar and the transmission bar are both 19 mm, while the lengths of them are 2800 and 1200 mm, respectively. The length of the striker is 250 mm, and the inner and the outer diameters are 19 and 26 mm, respectively.

Schematic diagram of the SHTB system.
During the test process, the incident wave generated by the striker impacting the incident bar and the reflected wave reflected at the junction of the bar are measured by the strain gauge attached to the surface of the incident bar. The transmitted wave, which passes through the specimen, is measured by the strain gauge attached to the surface of the transmission bar. Hence, the incident wave, the reflected wave and the transmitted wave obtained by the strain gauge are collected by the high dynamic strain indicator and shown on the computer. The strain rate, the average strain and the average stress can be obtained according to the classical two-wave method as shown in equation (1)

where t,
Results and analysis
Test data
The strain rate in the quasi-static tensile tests was 0.0002 s−1, and the strain rates in the dynamic tensile tests were 320, 500, 640 and 820 s−1. During the tests, the engineering strain and the engineering stress of the material were obtained directly. Since during the plastic deformation process in quasi-static and dynamic conditions, the length–diameter ratio of the specimen changed uniformly without obvious necking before the final fracture, and the true strain and the true stress of the material can be transformed by equation (2). 25 The true stress versus the true strain curves of the material in dynamic and quasi-static tensile tests are shown in Figure 4.

where

True stress versus true strain curves of the dynamic and the quasi-static tensile tests.
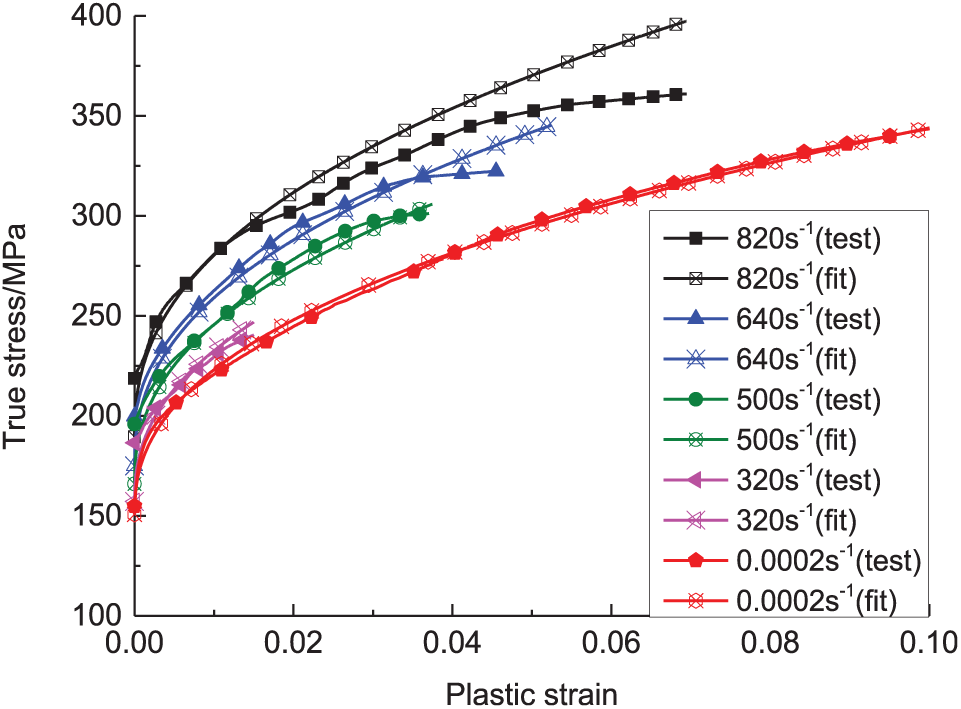
The stress–strain curves in the initial stage of the dynamic tests are unreliable because the stress waves are not stable at the very beginning. As a result, the stress in the initial stage is not completely uniform. 15 Moreover, the local necked material produces a complex non-uniform axial tensile stress state in the measuring section, so the test data corresponding to this section are invalid and need to be removed. 26 Therefore, only the plastic strain between yield strength and ultimate strength was selected to establish the constitutive model. The true stress versus the plastic strain curves of the material in dynamic and in quasi-static tensile tests are shown in Figure 5. It can be seen from the figure that 5083P-O has a strain rate strengthening effect from 320 to 820 s−1. In other words, the stress at the same plastic strain increases with the increase of the strain rate.

True stress versus plastic strain curves of the dynamic and the quasi-static tensile tests.
Constitutive model
The constitutive models of strain rate effect, which are commonly used in the software LS-DYNA, are generalized Cowper–Symonds (C-S) model 27 and Johnson-Cook (J-C) model.28,29 Classic C-S model is simple and can only describe the strain rate strengthening effect. The model is expressed as

where
The equation of the generalized C-S model which is widely used can be expressed as follows

where
The J-C model is an empirical model which can describe the strain hardening, the strain rate and the temperature effects of metallic materials. The equation of the J-C model is

where A, B and n are the yield stress, strain hardening coefficient and strain hardening exponent at referenced strain rate, respectively; C denotes the coefficient with respect to strain rate effect;
This model can be simplified without considering the temperature effect as

Based on the generalized C-S model and the simplified J-C model, the constitutive model of 5083P-O was established. 0.0002 s−1 was selected to be the referenced strain rate. By using the least square method to fit the plastic strain and corresponding true stress, the parameters A, B and n could be obtained, which were 150.740, 516.557 and 0.427, respectively. The parameters C, D and P were then determined by the stress at different strain rates with the same plastic strain. The plastic strain was chosen to be 1.5% so as to apply the test information as much as possible, because the tests under all the five strain rates can reach this plastic strain. The fitting results of parameters C, D and P are shown in Figure 6. Since the linear relationship between the true stress and the logarithmic strain rate is not good, the fitting error of the simplified J-C model is larger than that of the generalized C-S model. The final generalized C-S constitutive model for 5083P-O can be written as


The fitting results of parameters C, D and P.
The fitting data obtained by equation (7) are compared with the test data as shown in Figure 7. Except for the strain rate of 820 s−1, the model can reflect the real constitutive relation before the necking of the specimen quite well and the error between the fitting data and test data is relatively small. For the curve of the true stress versus the plastic strain at the strain rate of 820 s−1, the fitting data and the test data fit well when the plastic strain is less than 2%. However, when the plastic strain is larger than 2%, the true stress fitted is larger than the test value. The difference keeps increasing with the increase of the plastic strain.
Comparison between fitting data and test data.
From Figure 7, it can be seen that the magnification factor of the true stress, which is the ratio of the stress at high strain rate to the stress at low strain rate, is related not only to the strain rate but also to the plastic strain. For example, when the plastic strain increases from 0.01 to 0.06, the magnification factor between strain rate of 0.0002 and 820 s−1 keeps decreasing as shown in Figure 8. The curves in Figure 7 converge or even cross with one another. That is, the true stress–plastic strain curves at different strain rates are in a closed form. 30 The phenomenon shows that with the increase of the strain rate, the strain hardening effect gradually decreases. The result derives from the adiabatic-temperature-rise-softening effect under dynamic loading. Due to the high strain rate, the heat generated during the tensile process of the specimen cannot be dissipated timely. The temperature rising effect and the strain hardening effect in the adiabatic process are neutralized with each other, which reduces the strain rate strengthening characteristic.31,32 The phenomenon has also been found in the 2A16-T4 aluminium alloy, 16 TC11 titanium alloy 30 and stainless steel. 33

The magnification factor between 0.0002 and 820 s−1.
However, for both the J-C constitutive model and the C-S model, the stress increment of practical strain rate compared with the referenced strain rate can be expressed as


In both equations, when the plastic strain remains constant, the increment of stress rises with the increase of the strain rate. Meanwhile, for the material with significant strain hardening effect, when the strain rate remains constant, the stress increment will also increase as the plastic strain increases. Therefore, different stress–strain curves show a tendency of divergence. For the ideal elastic–plastic materials, the stress–strain curves at different strain rates are a set of parallel lines. According to the characteristics of above two equations, both models cannot reflect the constitutive relation of the material with closed-mouth phenomenon.
The determination of the strain rate effect coefficients in the two constitutive models is based on a given plastic strain, which means a large amount of test data are wasted. It is necessary to modify the model to improve its accuracy. However, due to the limited types of constitutive models currently involved in LS-DYNA, the secondary development of the software is required in order to apply the modified constitutive model.
For the material No. 24 in LS-DYNA, the constitutive relation at different strain rates can be considered using the interpolation method. The true stress–plastic strain curves at different strain rates are listed in a table, and then the curve at other strain rate can be acquired by smooth interpolation from adjacent curves. If the strain rate exceeds the upper bound or the lower bound of existing range, then the curve at either the highest or the lowest strain rate will be adopted. This method can reflect the constitutive relation of materials correctly in a certain strain rate range. Compared to the modified constitutive model and the secondary development of the software, this method is easier to be carried out and is named as TABLE model in the following description.
Model comparison by simulation
In order to compare the difference between generalized C-S model and the TABLE model, the finite element simulation of SHTB dynamic tensile tests was carried out, which was modelled and calculated based on LS-DYNA. In the finite element model, the incident bar, the specimen and the transmission bar were established, as shown in Figure 9. The model was treated especially as follows:
The threaded connection of the specimen to the bars was simplified by sharing the same nodes at the end of the specimen and the bars;
The lengths of the incident bar and the transmission bar were shortened to reduce the calculation time;
The surface nodes at the free end of the incident bar were directly imposed with an incident wave to replace the impact of the striker on the incident bar.

Finite element model of the simulation.
The elements in the model were eight-node hexahedron elements. The element size of the incident bar and the transmission bar was 1 mm, while that of the specimen was 0.25 mm. The materials of the incident bar, the transmission bar and the specimen were all simulated by material No. 24, and the properties were given according to the actual parameters. For the specimen, the C-S model and the TABLE model were, respectively, selected.
Finite element simulation can reflect the process of stress wave propagation. The axial stress history of the elements in the middle of the incident bar and the transmission bar was analysed, and the results are shown in Figure 10. The incident waves of the two models are exactly the same, but there is a slight difference for the reflected waves and the transmitted waves. Totally, five different elements were chosen along the circumferential or the axial directions on the surface of the specimen as shown in Figure 11. Figure 12 illustrates the effective stress histories for these elements. It is obvious that the curves for the five elements almost overlap with one another, which shows that the stress of the specimen is uniform in both the horizontal and the axial directions. Thus, it can be concluded that the stress is uniform in the whole specimen.

The stress histories of the simulation.
Five elements of specimen selected to be analyzed.

Effective stress histories for five elements with different models.
Effective stress and plastic strain of above five elements were averaged to obtain the true stress–plastic strain curve. The average strain rate obtained in the simulation is about 540 s−1, so the fitting curve at this strain rate was also obtained from the generalized C-S model (equation (7)). The comparison between the fitting result and the simulation results with C-S and TABLE model is shown in Figure 13. It can be seen that the simulation result with the C-S model is a little higher than that of the fitting result. The maximum stress difference between them is only 17 MPa with a relative error of 5%. Meanwhile, the simulation result with the TABLE model has a lower stress than that of the fitting result, which reflects the closed-mouth characteristics of the test data better. Due to the fact that the constant strain rate loading cannot be fully guaranteed during the test and the simulation, the errors are inevitable. It can be concluded that the trend of the TABLE model is closer to the test, which can be used as an effective method to consider the strain rate effect in the finite element simulation.

Comparison of true stress–plastic strain curves between simulation and fitting.
Analysis of energy-absorbing structure
As shown in Figure 14, the squeezing energy-absorbing structure consisted of the anti-climbing teeth, the squeezing tube and the flange seat. The axial height and the wall thickness of the squeezing tube were 470 and 3 mm, respectively; the outer diameters of the small end and the large end were 135 and 145 mm, respectively. Both the flange seat and the anti-climbing teeth were set as the rigid material, while the squeezing tube was set as the material 5083P-O. The constitutive models of 5083P-O were setting to be STATIC model (without considering the strain rate effect), C-S model and TABLE model, respectively. During the collision, the flange seat was fixed, and the anti-climbing teeth impacted the squeezing tube at a constant velocity, which were 10, 30 and 50 m/s, respectively.

Finite element model of squeezing energy-absorbing structure.
Collision force and energy absorption
The force–displacement curve of squeezing energy-absorbing structure is relatively stable with only slight fluctuation. Different material models and different velocities show no obvious influence on the collision force histories as shown in Figure 15.
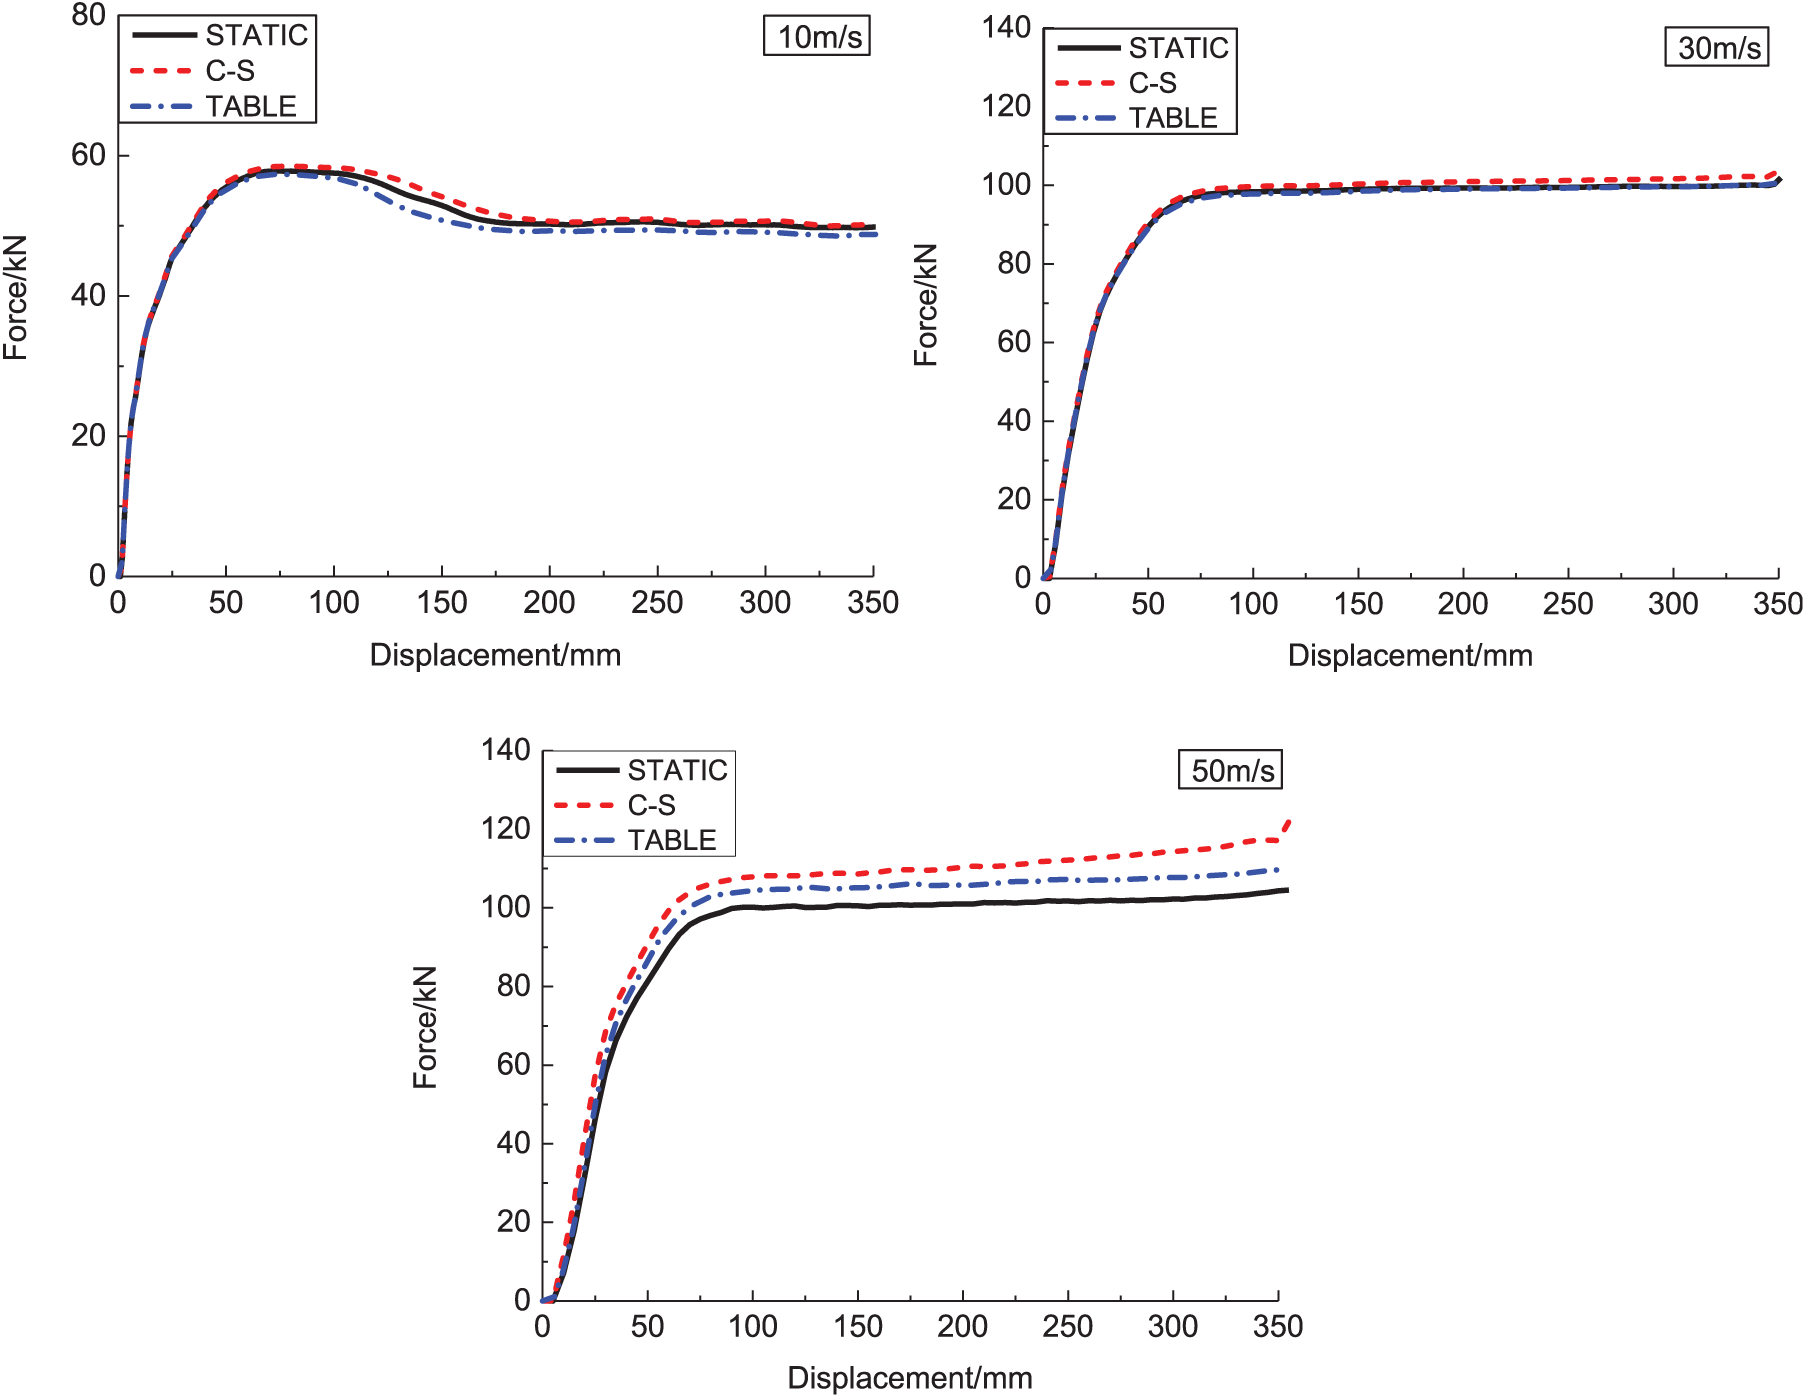
The collision force with different constitutive models and at different velocities.
It can be seen from Figure 15 that the squeezing force with different material models presents different trends at velocities of 10 to 50 m/s. The squeezing force with the C-S model is always the largest at all the three velocities; comparing to the squeezing force with the STATIC model, the force of the TABLE model is smaller, the same or greater at 10, 30 and 50 m/s, respectively. The total energy absorption of the structure in the displacement of 350 mm is shown in Figure 16. It can be seen that the energy absorption and the squeezing force have the same relationship. The relations of squeezing force among the three models can be summarized as follows: at 10 m/s, C-S>STATIC>TABLE; at 30 m/s, C-S>TABLE=STATIC; at 50 m/s, C-S>TABLE>STATIC.
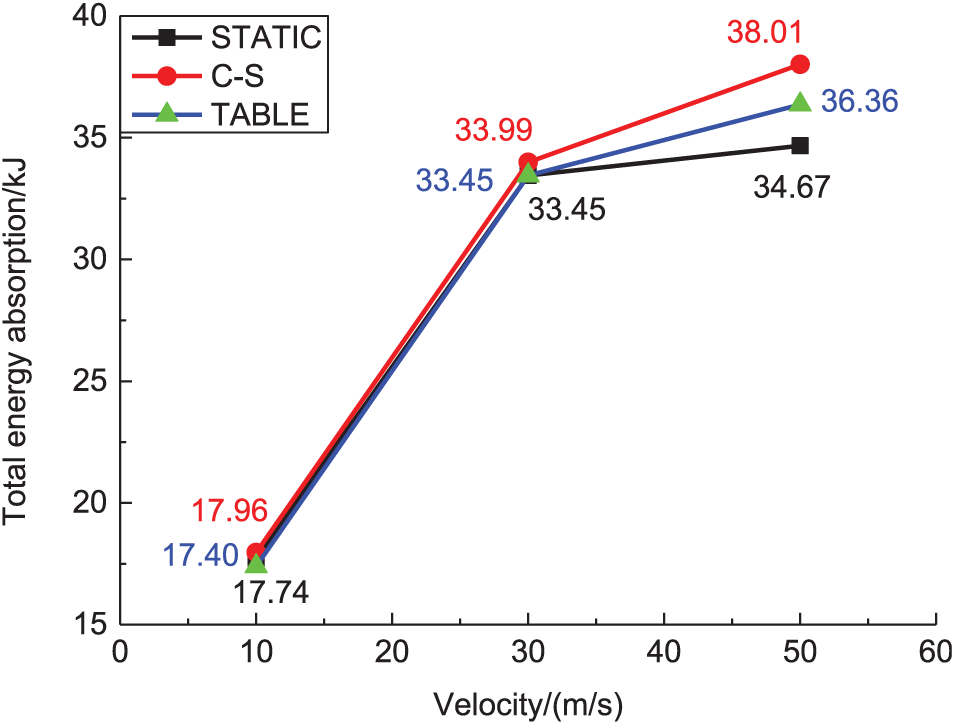
Total energy absorption with different constitutive models.
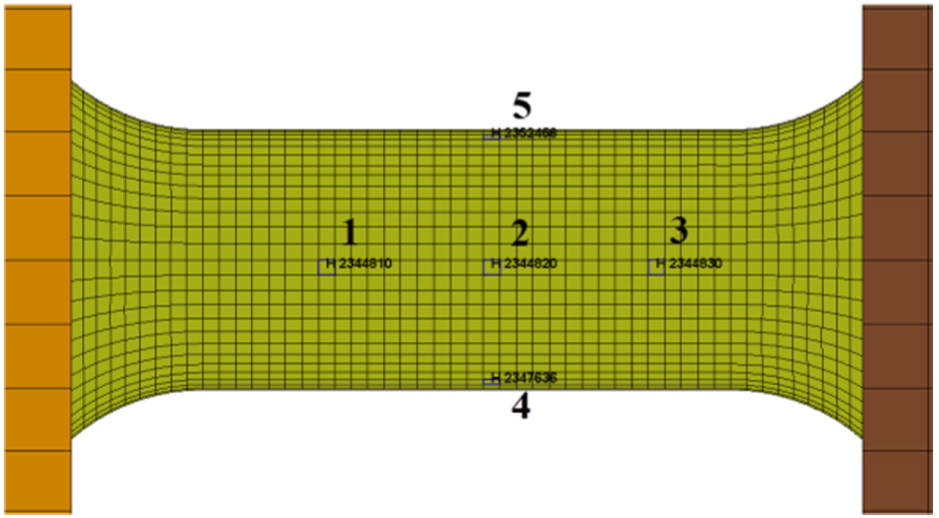
The reason for this phenomenon is related to the strain rate of the structure deformation. At the velocity of 30 m/s, the deformation of the structure with the STATIC model was studied by analysing the strain of the selected elements with the element numbers of 6505970, 6511442, 6518389, 6525752 and 6534147, as shown in Figure 17, and the strain rate histories of the five elements are shown in Figure 18. As the deformations of the elements at different locations are basically the same, the changes of the strain rates are also the same. In order to compare the strain rates of structure deformation at different velocities, a more detailed comparative analysis of element 6505970 was carried out. It can represent the basic characteristics of the structure deformation with different velocities and material models. The strain rate comparison results are shown in Figure 19.

Five elements of squeezing tube selected to be analyzed.

Strain rate histories of different elements.
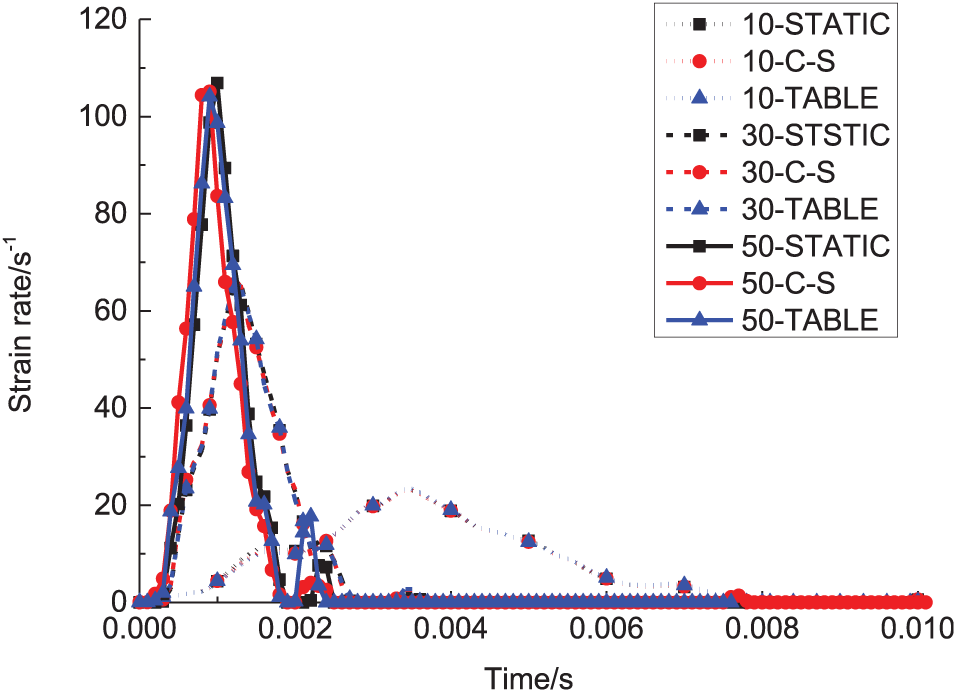
Strain rate histories at different velocities of element 6505970.
The results show that the strain rates are different at different impact velocities. The strain rates are within 20 and 70 s−1 at the velocity of 10 and 30 m/s, and the strain rate exceeds 100 s−1 at the velocity of 50 m/s.
The TABLE model can describe the closed-mouth phenomenon of strain rate effect, as shown in Figure 20, where 0, 1, 2 and b represent the quasi-static curve, the lower strain rate curve, the higher strain rate curve and the maximum plastic strain in the deformation of energy-absorbing structure, respectively. When the strain rate is low, the stress–strain curve 1 with the TABLE model intersects with the quasi-static stress–strain curve 0 at the intersection point a. The stress of strain rate 1 is less than that of quasi-static 0 after the plastic strain a. Before reaching the maximum plastic strain b, S2 is larger than the area of S1; as a result, the force and energy absorption of the TABLE model are less than that of the STATIC model. When the strain rate is high, the stress–strain curve 2 with the TABLE model intersects with the quasi-static stress–strain curve 0 at the intersection point c. Before the maximum plastic strain b, the stress of the strain rate 2 is always greater than the quasi-static 0, so the force and energy absorption of the TABLE model are larger than the STATIC model, which leads to the result that C-S > TABLE > STATIC, at 50 m/s. However, for the C-S model, it has the highest stress, so the force and the energy absorption with the C-S model are always the largest at all the three velocities.

The schematic diagram of TABLE model.
Deformation mode
The overall deformation mode of the squeezing energy-absorbing structure is relatively stable, but with the increase of the impact velocity, the crushing bulge deformation will occur at the end of the squeezing tube away from the flange seat. As shown in Figure 21, the greater the velocity is, the more obviously the crushing bulge deformation will be. With the impact velocity increasing, the deformation of per unit time increases, and the squeezing force near the flange seat is greater than the crushing force near the anti-climbing teeth. So the end of the squeezing tube near the flange seat acts as an instantaneous fixed end, and the instantaneous crushing bulge deformation of the tube happens. For the buckling bulge deformation around the plastic hinges, before the wrinkle is completely formed, the crushing force increases rapidly with the increase of the deformation. When the crushing force is greater than the squeezing force, the squeezing deformation begins to occur till the end of the collision.

The crushing bulge deformation at different velocities.
Besides the influence of impact velocity, the strain rate strengthening effect of the material also has a significant influence on the deformation mode. In order to highlight the material strain rate strengthening effect, the following analysis was conducted at an impact velocity of 50 m/s. Figure 22 shows the initial deformation mode of the squeezing tube end near the anti-climbing teeth when being impacted at a velocity of 50 m/s using different material models.

Initial deformation mode using different material models.
It can be seen from Figure 22 that when the strain rate strengthening effect is considered, the value of the plastic strain due to the bulge deformation near the anti-climbing teeth is lower than that in STATIC condition, but the number of elements which have produced plastic strain increases. As shown in Figure 23, compared with the squeezing deformation, the strain rate of crushing bulge deformation is larger. The strain rate strengthening effect leads to significant increase of the stress to enhance the resistance at the end of the squeezing tube, which results in the decrease of the crushing bulge deformation. Since the strain rate of the compression deformation is low, the compression force is limited, which leads to the increase of the axial compression deformation. So the value of the plastic strain decreases but the number of elements producing plastic strain increases in the initial stage of the collision.
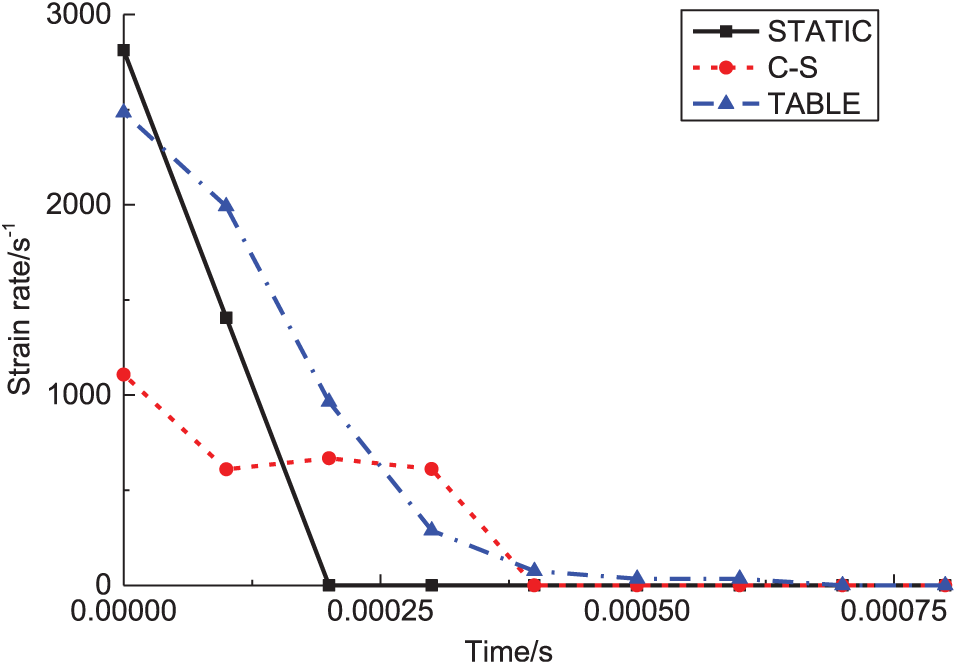
The strain rate histories of crushing bulge deformation.
To sum up, due to the relatively small strain rate during the deformation of the squeezing energy-absorbing structure at low velocity impact, the strain rate strengthening effect of 5083P-O has a relatively small influence on the energy absorption and deformation mode of the structure. When the strain rate is high, the strain rate strengthening effect will enhance the squeezing force and improve the energy absorption. In the collision process of the squeezing energy-absorbing structure, the deformation modes are varied, including bending and axial compression, accompanied with different strain rates. The stress will increase due to the strain rate strengthening effect, which will lead to the decrease of the deformation with high strain rates and the advancement of deformation with low strain rates. The rule can also be applied to other types of energy-absorbing structure, which should be considered in the design process. It is possible to suppress the influence of strain rate effect on the deformation modes of energy-absorbing structure by using structure-induced method.
Conclusion
In the present work, the dynamic constitutive relation of 5083P-O aluminium alloy at high strain rates was studied. Based on the constitutive models of 5083P-O, the influence of material strain rate effect on the collision force, the energy absorption and the deformation mode of the squeezing energy-absorbing structure were studied by finite element simulation:
The static and dynamic tensile tests of 5083P-O showed that it possessed a strain rate strengthening effect from 320 to 820 s−1. The generalized C-S constitutive model of the material was established, and the difference between the fitting results and test results was small except at the strain rate of 820 s−1.
Based on the difference between the fitting results and the test results, the limits of the traditional constitutive models were analysed. In order to avoid modifying the traditional constitutive models, a method using the TABLE model to express the material constitutive relation in LS-DYNA was proposed. The simulation result of the SHTB dynamic tensile tests showed that the TABLE model can reflect the closed-mouth characteristics of the test data and can be more accurate than the C-S model and the J-C model during the simulation.
Based on the 5083P-O constitutive models, the influence of material strain rate effect on the collision force, the energy absorption and the deformation mode of the squeezing energy-absorbing structure were investigated.
The kind of energy-absorbing structure possesses a low strain rate at low velocity impact, and the strain rate strengthening effect has little influence. With the increase of impact velocity, the strain rate increases and the strain rate strengthening effect will improve the squeezing force and the energy absorption of the structure. Owing to the closed-mouth characteristics of 5083P-O, the collision force and the energy absorption considering strain rate strengthening effect could be less than the results based on the STATIC model at low strain rate.
At the same time, the strain rate strengthening effect will lead to the decrease of the deformation with high strain rates and the advancement of deformation with low strain rates. So the influence of material strain rate effect on impact performance of energy-absorbing structure should be taken into consideration during the process of structure design.
It is worth noting that, due to the limit of the test equipment, the dynamic tensile tests at the middle and the higher strain rates are not carried out yet, and the strain rate effect at this strain rate range needs further study. Only till then, the completed constitutive relation of 5083P-O aluminium alloy which is suitable for wide strain rate range can be established and applied to perform relevant simulation.
Footnotes
Handling Editor: Jianjun Zhang
Declaration of conflicting interests
The author(s) declared no potential conflicts of interest with respect to the research, authorship, and/or publication of this article.
Funding
The author(s) disclosed receipt of the following financial support for the research, authorship, and/or publication of this article: The support of the National Key Research and Development Program of China (2016YFB1200403), the National Natural Science Foundation of China (51675446) and the Independent Subject of State Key Laboratory of Traction Power (2017TPL_Z01).