
Abstract
Aiming at the problem that the difference of the equipment between before and after implementation of reliability growth technology is not considered in calculating reliability growth rate of computer numerical control machine tools, this article takes the hydrostatic spindle of the heavy-duty machine tool as an example and introduces the concept of “net growth rate” to propose a new method to calculate reliability growth rate. First, based on the value of mean time between failures of the whole machine before implementation of reliability growth technology, a model of the “net growth rate” of the whole machine is established. Second, the reliability relationship between the whole machine and the subsystems is established through the reliability block diagram, so the problem is transformed into solving the value of mean time between failures of the subsystems. Then, a superposition model of “net growth rate” of subsystems is established by making full use of experimental data and product information. When dealing with product information, multiple factors including composition structure, design requirement, manufacture and assembly, and use environment which influence equipment reliability are considered comprehensively and analytic network process is employed to obtain the weights of the influencing factors. Based on the weights, the reliability comprehensive scores which can reflect the reliability level in the corresponding design, manufacturing, and use environment are calculated and the reliability growth rate caused by the differences of the equipment is solved. In order to add ambiguity of human judgment, interval numbers are applied to network analysis process models. Finally, this article verifies the feasibility of the proposed method with an example.
Keywords
Introduction
As the working machine of equipment manufacturing industry, the technology level of computer numerical control (CNC) machine tools represents the development level of the manufacturing industry. 1 As an important index for the quality of CNC machine tools, 2 the reliability can be improved through the reliability growth technology. However, as complex repairable systems with mechanical electrical hydraulic, 3 there are no relatively mature theories and technologies of reliability for machine tools as electronic products and aerospace products, the researches for the reliability growth of CNC machine tools are still in the exploratory phase. The researchers only carried lots of research from several aspects such as reliability modeling, failure analysis, reliability design, obtainment process of fault data, and reliability testing.4–12
However, no matter which kinds of technology are used to achieve the reliability growth of CNC machine tools, the actual effect of reliability growth technology needs to be studied. At present, the effect of reliability growth technology is generally to evaluate the reliability of the machine tools before and after implementation of the reliability growth technology using the indicator mean time between failures (MTBF) and then obtain the absolute growth value of MTBF by equation (1) or the relative growth rate by equation (2)

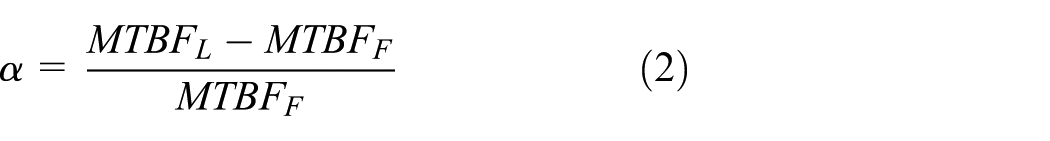
where
With the development of technology, the update of machine tools is extremely fast, but the cycle of reliability test is so long, especially the reliability field test.
13
So, machine tools would have changed greatly during reliability tests. Therefore, the machine tools before and after implementation of reliability growth technology are often not the same type, what is ignored in the calculation method above. The disregard of the differences would cause the error of real growth value of reliability. So, the relative increase rate
Compared to “gross growth rate,” concept of “net growth rate” of reliability is proposed to calculate the actual effect of reliability growth technology on the reliability improvement of equipment. Objective factors such as experimental data which are certain information and subjective factors such as product information which is uncertain information are used to make the result more accurate. Because of the similarity between machine tools before and after the implementation of reliability growth technology, the idea of similar devices is used to deal with the uncertain information.14,15 However, it is a knotty problem to accurately assess the degree of difference between similar products in reliability from the perspective of whole machine. 16 Fortunately, with the development of mechanical products toward the direction of modularization, the degree of difference in reliability between certain parts of the similar products which are defined as subsystems of products is not difficult to distinguish. Therefore, on the basis of a clear reliability relationship between the whole machine and the subsystems of the product, the similarity of the whole machine can be obtained through calculating the similarity of all the subsystems. So, this article takes the subsystems as the research object, comprehensively considers the various influencing factors that affect the reliability of subsystems, uses the analytic network process (ANP) 17 to analyze the degree of difference of the product in reliability, and finally, gets the reliability “net growth rate” of the whole machine. Different from the traditional ANP, the interval numbers 18 instead of the real numbers are adopted in the new method to express uncertain information, for that the interval numbers are more suitable for dealing with the problems of uncertainty. 19
This article takes the hydrostatic spindle of one type of heavy-duty machine tools as an example. As a kind of rotating machinery, the structure and the failures of hydrostatic spindle are complex and typical.20–22 So, it is a representative example.
The remainder of this article is organized as follows: in section “Hydrostatic spindle of heavy-duty machine tool,” the composition and characteristics of the hydrostatic spindle are presented. In section “Model of growth rate of reliability,” the model of growth rate of reliability is put forward. Section “Example” demonstrates the model with an example, and section “Conclusion” concludes this article.
Hydrostatic spindle of heavy-dutymachine tool
Heavy-duty machine tool is a type of machine tool used for machining large components. As a part of heavy-duty machine tools, the hydrostatic spindle is used to hold components and drive the components to rotate. Unlike the spindle of the normal machine tools, 23 the hydrostatic spindle consists of headstock, drive motor, transmission mechanism, spindle, chuck, lubrication system, hydraulic system, and other components. 24 Figure 1 illustrates a typical hydrostatic spindle.

A typical hydrostatic spindle.
Model of growth rate of reliability
Modeling process
Based on the value of MTBF of the hydrostatic spindle before the implementation of reliability growth technology, this article is devoted to solving the relative growth rate by equation (3)
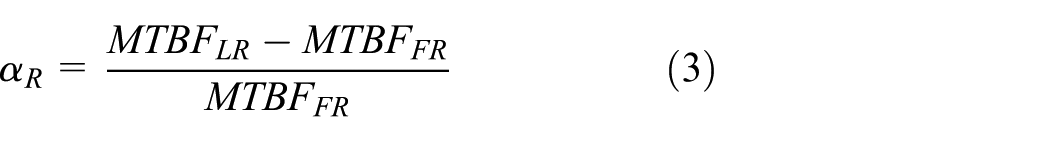
where
Therefore, “net growth rate” can be obtained through the calculation of the “Real MTBF”
In summary, the modeling process of the calculation of reliability growth rate can be divided into three steps. First, drawing the reliability block diagram; second, establishing the MTBF mapping relationship between the whole machine and subsystems; third, establishing model of “Real MTBF” of subsystems. Correspondingly, the calculation process of reliability growth rate can also be divided into three steps. First, calculating the “Real MTBF” of all the subsystems; second, calculating the corresponding “Real MTBF” of the whole machine; third, calculating the “net growth rate” of the whole machine by equation (3). The processes are shown in Figure 2.
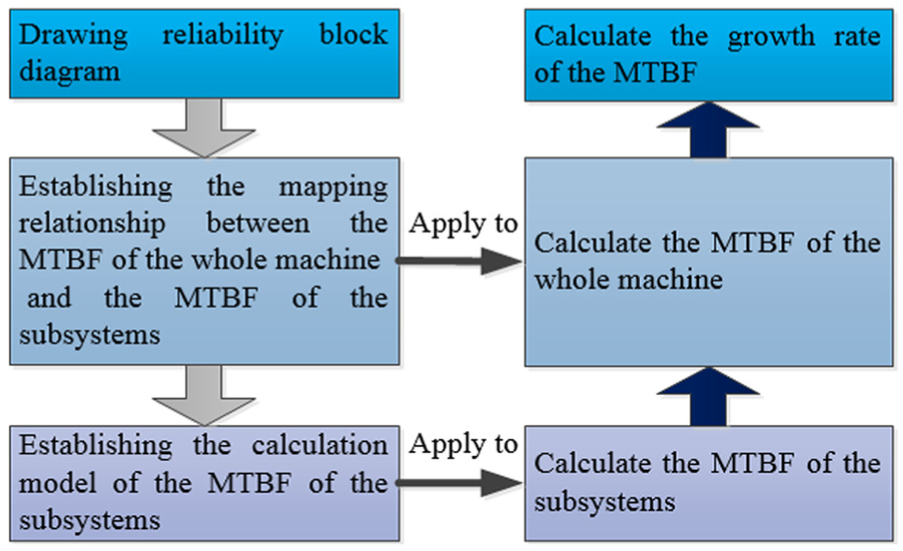
Modeling process and corresponding calculation process.
Drawing of the reliability block diagram
Based on the principles of structure independence, function independence, and convention, the hydrostatic spindle can be divided into eight subsystems according to the logic relationship among the components. Because any failure of any subsystem can lead to the failure of the whole machine, the subsystems, which are headstock, drive motor, transmission mechanism, spindle, chuck, lubrication system, hydraulic system, and other components, are connected in series in the reliability block diagram
25
which is shown in Figure 3. In this article, the subsystems are represented by
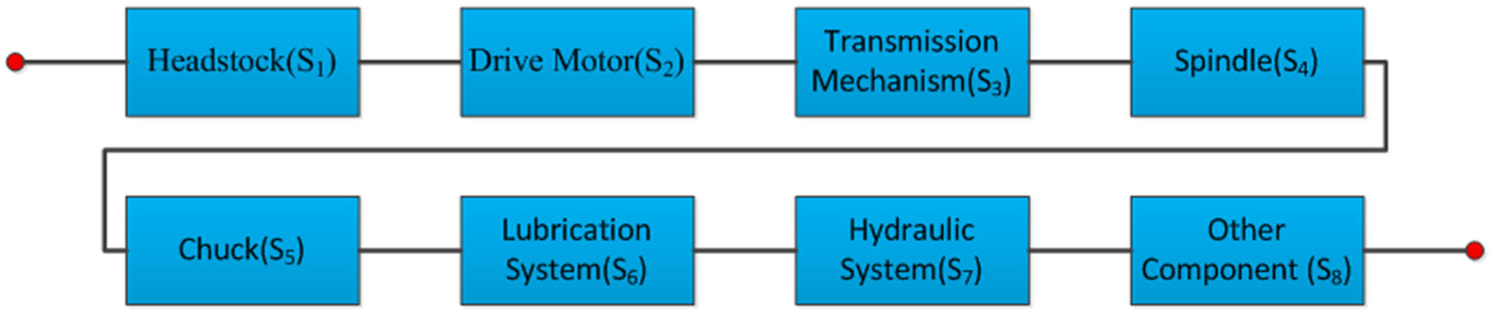
Reliability block diagram of hydrostatic spindle.
Reliability relationship between whole machine and subsystems
The whole machine consists of eight subsystems in series, so the mapping relationship of MTBF between the whole machine and subsystems can be expressed by equation (4) 26

where
Calculation of the “Real MTBF” of subsystems
Model of MTBF growth rate of subsystems
As with the whole machine, “gross growth rate” of subsystems can be calculated by equation (5)

where
Both reliability growth technology and the difference of the equipment between before and after implementation of reliability growth technology have contributions on the “gross growth rate.” The contribution of reliability growth technology is called “artificial growth rate,” and the contribution of difference of the equipment is defined as “natural growth rate.”“Artificial growth rate” is the “net growth rate,” which can represent the actual effect of reliability growth technology to the improvement of reliability. Therefore, a superposition model of the growth rate of subsystems can be established

where

where
Therefore, as long as the “artificial growth rate” is obtained, the “Real MTBF” of the corresponding subsystem can be developed. When the “Real MTBF” of all the subsystems is obtained, the problems proposed in this article can be solved. In summary, solving “natural growth rate” is needed.
Calculation of “natural growth rate.”
Model of “natural growth rate.”
It is assumed that reliability field tests are conducted successively on two batches of hydrostatic spindles of heavy-duty machine tools, and reliability growth technique is not applied to them. Since the comprehensive conditions of two batches of equipment, which includes design, manufacturing and assembly, and use environments, are not completely the same, the reliability of two batches is also different. Taking the effect on equipment reliability as the reference, reliability comprehensive scores of different comprehensive conditions are performed for the two batches of equipment. The scores can reflect the reliability level in the corresponding design, manufacturing, and use environment. So, the “natural growth rate” can be expressed by equation (8)

where
Model of composite score
In the comprehensive condition, there are many factors which affect the reliability when designing, manufacturing, and using the equipment. The reliability comprehensive scores can be obtained by linearly weighting the fuzzy scores of the factors

where
Because the comprehensive scores are highly sensitive to the influencing factors, the weights of the factors are very important.
Model of weights of factors
Multi-factor weights are usually solved by the analytic hierarchy process (AHP), but each factor is independent of each other in AHP. In fact, factors are interrelated and each factor is often influenced and constrained each other. Hence, ANP is suitable for solving the multi-factor weight problem, whose factors are related to each other.
AHP needs to establish a hierarchical structure, in which there is no feedback between layers, and the elements in each layer are independent of each other. Unlike AHP, ANP needs to establish a network structure, in which the criterion level and the program level are all considered as element groups, each sub-criterion and each program is regarded as an element and each element group, respectively, and each element influences and restricts each other.
Through the review of related manuals and analysis of a large number of failure data, composition structure, design requirement, manufacturing and assembly, use environment are chosen to determine the reliability comprehensive scores in this article. In order to score easily, the four element groups above are broken into more detailed elements. Through consulting experts, the relationships between element groups and elements are established. Therefore, an ANP model of weights of factors is developed as shown in Figure 4.

ANP model for weights of factors.
The model consists of four element groups of composition structure, design, manufacturing and assembly, and use environment, which are denoted by
Solution of ANP model
The process of solving the ANP model includes three steps, which are developing an unweighted hypermatrix, constructing a weighted hypermatrix, and solving the limit hypermatrix. 27
Using any element

where
where n is the number of the element groups. In this article,

With any element group

So, the weighted hypermatrix in this article is as following

Then, the weighted hypermatrix is squared in order, until
Application and calculation of interval numbers
In the traditional ANP, when the judgment matrix of pairwise comparison is constructed, the ratio of importance degree is usually assigned to a certain value without considering the ambiguity of human judgment. 28 In order to overcome this problem, interval numbers 29 are applied to express uncertain information in this article. The relative importance of each factor is assigned by an interval number in the form of equation (15)

The interval number in equation (15), whose value can choose any number in the range of 1–9 or their countdowns,
30
represents the ratio of importance degree between the elements
In the element group
where
It is important to analyze whether the interval number reciprocal judgment matrix meets consistency, which would affect the result of sorting for weights. 31 So, the method proposed in Yue and Fan 32 was adopted to solve the problem of the consistency of the judgment matrix. The calculation process will not be repeated here. The calculation process can be described as shown in Figure 5, where α and β need to be given according to Yue and Fan 32 and Lan et al. 33

The calculation process of the weight of elements by the interval number reciprocal judgment matrix.
Example
The hydrostatic spindle of the heavy-duty machine tool produced by a certain manufacturer is taken as an example to illustrate the application of the proposed method in this article. In order to ensure the credibility of the data, the reliability data are collected in the field test. The relevant information such as running time, failure occurrence time, and failure reason are all recorded in real time during the field test. 15 machine tools which have not implemented reliability growth technology were tested from 2 January 2014 to 30 July 2014, and then, 9 machine tools which have implemented reliability growth technology were tested from 7 July 2016 to 23 March 2017. Taking MTBF as an indicator, reliability assessment was carried on based on the test data, and the results are listed in Table 1.
MTBF of equipment and subsystems with and without the reliability growth techniques.

MTBF: mean time between failures.
“Real MTBF” of subsystems
The subsystem of hydraulic system
Interval number reciprocal judgment matrix
According to the method proposed in section “Model of growth rate of reliability,” each element needs to be the comparison criterion to generate some interval number reciprocal judgment matrixes for elements which are affected by the comparison criterion in each element group. For example, for the element weight and size
Using the element design level

where
Rating scale for the importance ratio of an element to other elements.
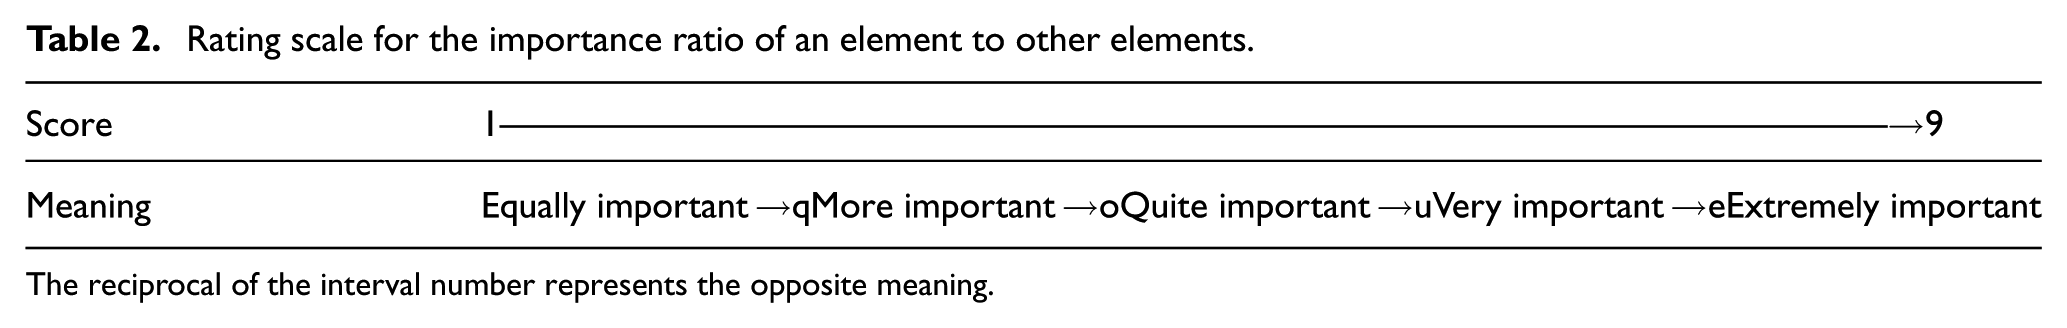
The reciprocal of the interval number represents the opposite meaning.
The importance ratio of one element to another in

Every interval number represents the importance ratio of row element to column element.
Then, a weight column vector can be derived from
Likewise, comparing the affected elements of element group

Constructing unweighted hypermatrix
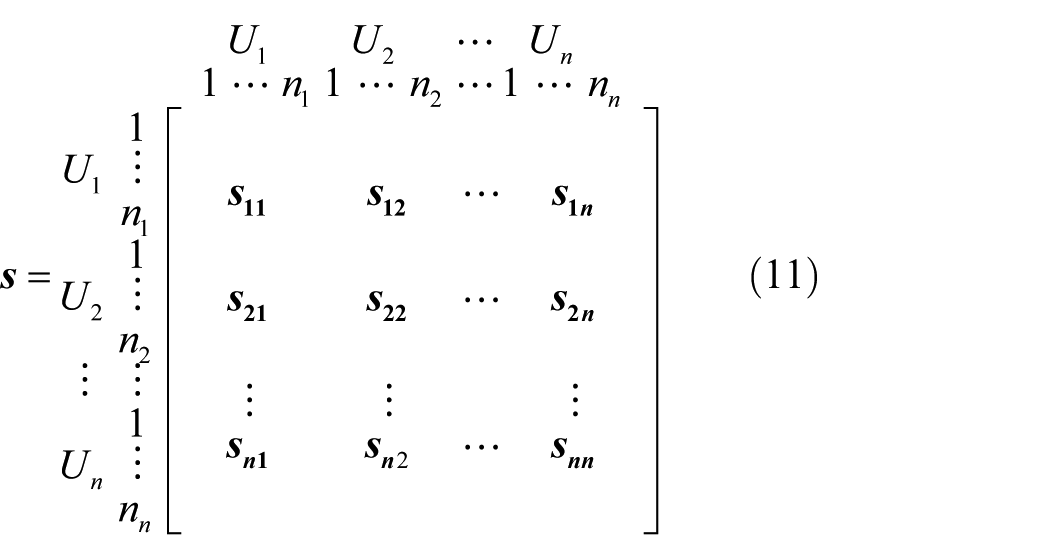
Solving each matrix block using the above method, an unweighted hypermatrix of the subsystem of hydraulic system can be composed in the form of equation (11). The calculation process will not be narrated (Table 4).
The unweighted hypermatrix of the subsystem of hydraulic system.

Constructing weighted hypermatrix
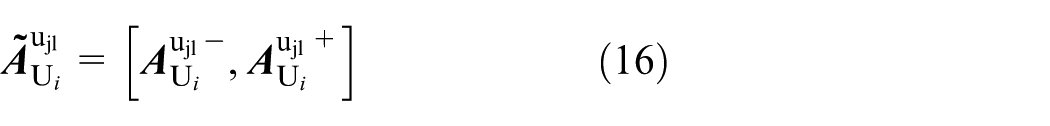
Using each element group as a comparison criterion, all the element groups which are affected or restricted by the criterion are compared with each other to construct an interval number reciprocal judgment matrix in the form of equation (16). Then, the corresponding weight column vectors can be derived. All the weight column vectors can compose a weight matrix as shown in Table 5.
The weight matrix of the subsystem of hydraulic system.

Then, the weight matrix and unweighted hypermatrix are processed according to equation (14) to obtain a weighted hypermatrix

Calculating weights of elements
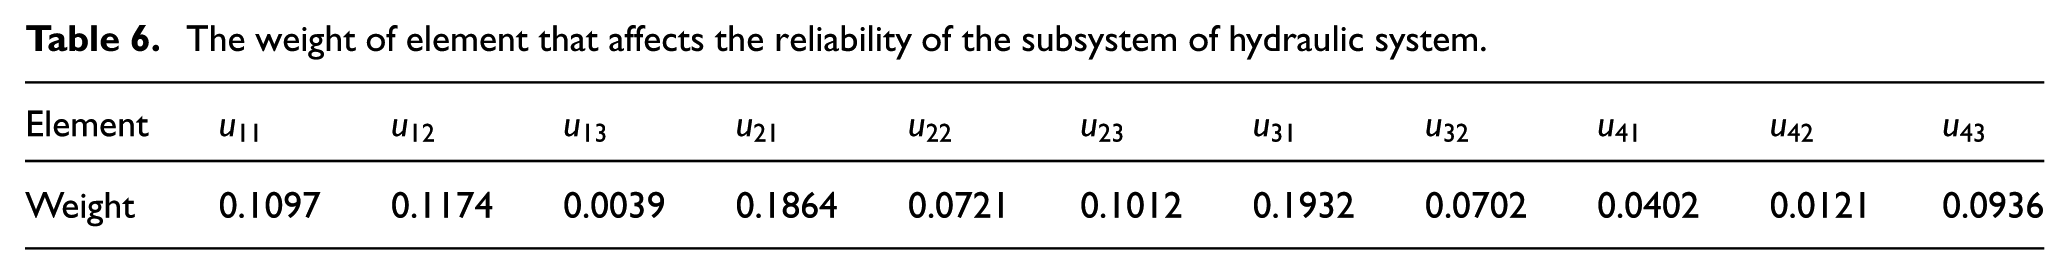
The weighted hypermatrix is squared in order by four times to get the limit hypermatrix, of which each column is the weights of the elements (Table 6).
The weight of element that affects the reliability of the subsystem of hydraulic system.
Comprehensive score of subsystems
In order to assess the fuzzy scores of the elements that affect the reliability of the subsystem of hydraulic system, the rating scale is presented in Table 7. According to Table 7, designers and producers of machine tools are invited to provide the fuzzy scores of the hydraulic system before and after implementation of reliability growth technology, respectively. The scores are shown in Table 8.
Rating scale of elements that affect the reliability of the subsystem of hydraulic system.

Fuzzy score of elements that affect the reliability of the subsystem of hydraulic system.

The comprehensive score of the hydraulic system in the “original condition” and “current condition” can be calculated by equation (9), respectively

Solution of the “Real MTBF” of subsystem
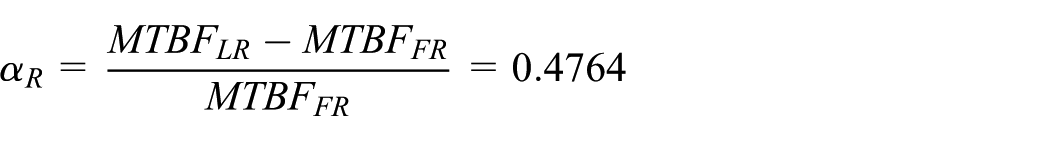
The “natural growth rate” of MTBF of the hydraulic system can be calculated by equation (8)

The “gross growth rate” of MTBF of the hydraulic system can be calculated by equation (5)

The “artificial growth rate” of MTBF of the hydraulic system can be calculated by equation (6)

The “Real MTBF” of the hydraulic system can be calculated by equation (7)

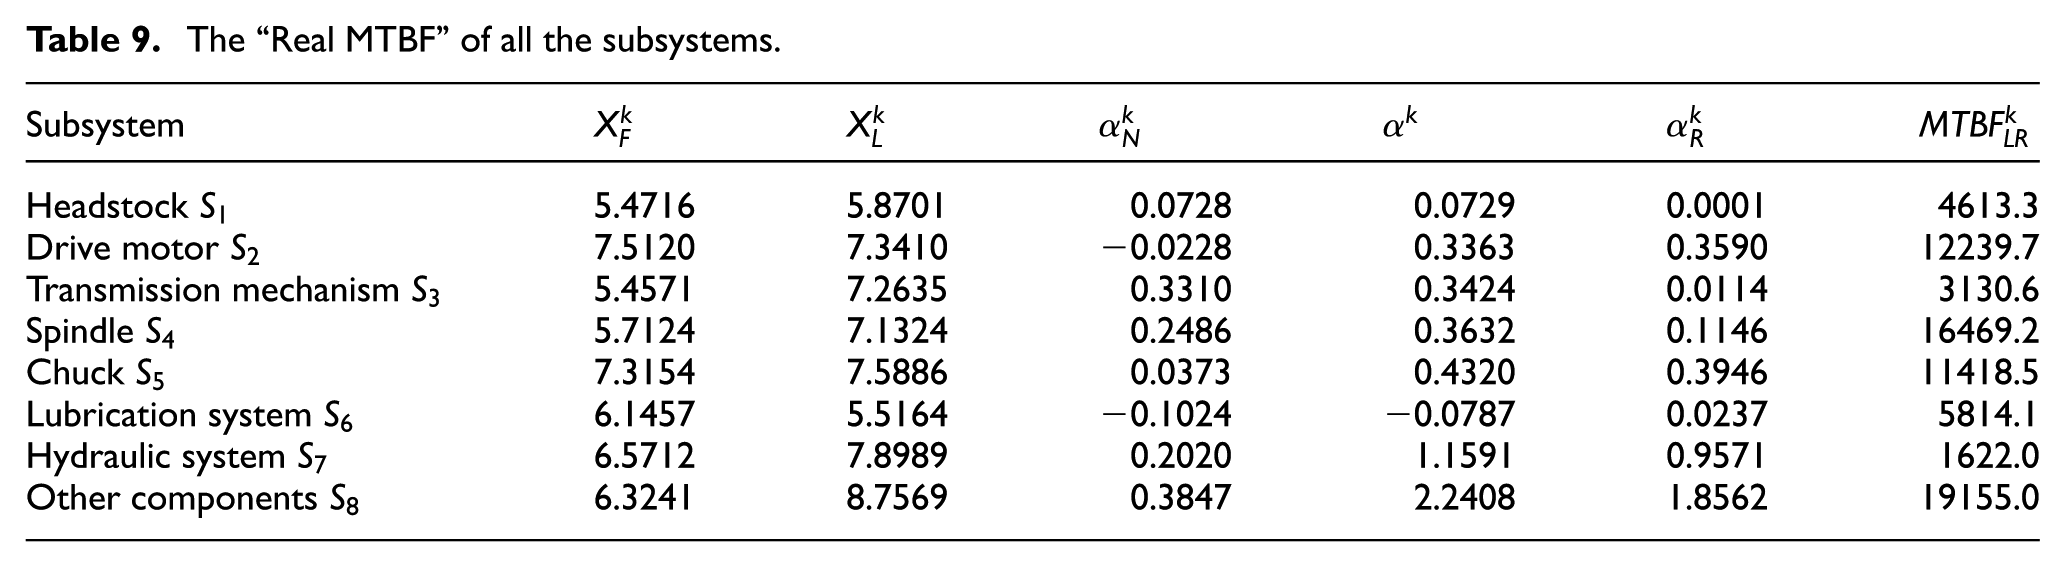
According to the steps above, the “Real MTBF” of all the subsystems can be calculated, and the results are shown in Table 9.
The “Real MTBF” of all the subsystems.
Calculation of the “Real MTBF” of whole machine
Taking the “Real MTBF” of all the subsystems into equation (4), the “Real MTBF” of the whole machine can be obtained

Calculation of “net growth rate”
Taking the “Real MTBF” of the whole machine into equation (3), the “net growth rate” of MTBF of the whole machine, which is caused by reliability growth technology, can be obtained
Comparison
The “gross growth rate” (
Comparison between “net growth rate” and “gross growth rate.”

From the perspective of the whole machine, the result of the calculation method in this article is less than that of the traditional method, but the difference is not much, what means that the difference of the hydrostatic spindles between before and after the implementation of the reliability growth technology is not obvious.
From the perspective of subsystems, the result of the calculation method in this article is different from that of the traditional method and some values become larger, when others become smaller. For example, the “net growth rate” of the subsystem hydraulic system is less than its “gross growth rate.” First, it is related to the certain randomness of reliability test data. Second, it means that the there are differences in hydraulic system itself between before and after the implementation of the reliability growth technology. Another example, “net growth rate” of the subsystem drive motor is higher than its “gross growth rate.” It means that the reliability growth technology makes up for the reduction caused by the differences in drive motor itself.
From the calculation results of “net growth rate” of the subsystems, the reliability growth technology is mainly implemented in hydraulic systems and other components, but has no effect on the headstock. In summary, it can be seen that there is an obvious difference between the results calculated by the proposed method in this article and the traditional ones. What’s more, the difference of the equipment between before and after implementation of reliability growth technology is considered in the proposed method, so the results are more reasonable and effective.
Conclusion
This article proposed a new method to evaluate the actual effect of reliability growth technology to reliability improvement. In addition, the application example proved that the evaluation result of the proposed method was different from the traditional ones to some extent:
Taking full account of the differences in equipment between before and after implementation of reliability growth technology, the concept of “net growth rate” was introduced and the model of “net growth rate” of the whole machine was established based on MTBF of whole machine before implementation of reliability growth technology. The “net growth rate” of the whole machine was different from the “gross growth rate” obviously.
It was better to convert the problem of solving MTBF of the whole machine into the problem of solving that of the subsystem based on the reliability mapping relationship between the whole machine and the subsystems for that the similarity of the subsystems was better than the similarity of the whole machine.
When the mathematical model of the reliability “net growth rate” of subsystems was established, both the deterministic and fuzzy information should be taken into account for that there were experimental data and product information.
When dealing with product information, influence factors of reliability, which contained composition structure, design requirement, manufacturing and assembly, and use environment, should be used to establish a network analysis model to grade the overall environment for equipment production.
The ambiguity of human judgment should be taken into consideration for making the decision result more reliable. So, when solving the ANP, the interval numbers can be introduced into the judgment matrix.
Footnotes
Acknowledgements
Our deepest gratitude goes first to the editors and reviewers for their constructive suggestions on this paper. In addition, we thank the authors of this paper’s references whose works have contributed greatly to the completion of this paper.
Handling Editor: Zengtao Chen
Declaration of conflicting interests
The author(s) declared no potential conflicts of interest with respect to the research, authorship, and/or publication of this article.
Funding
The author(s) disclosed receipt of the following financial support for the research, authorship, and/or publication of this article: This work was supported by the National Natural Science Foundation of China (grant no. 51675227), the National Natural Science Foundation-Youth Foundation (grant no. 51505186), the China Postdoctoral Science Foundation (grant no. 2015M580245), the Jilin Province Excellent Researcher Foundation (grant no. 20170520103JH), the Scientific Project of the Education Department of Jilin Province (JJKH20180133KJ), and finally, the program for JLU Science and Technology Innovative Research Team (JLUSTIRT).