
Abstract
Simulation and experimental testing were conducted on an external gas-assisted mold-temperature control combined with a pulsed cooling system used for thin-wall injection molding to determine its effect on the heating rate and temperature distribution of a mold surface. For mold heating via external gas-assisted mold-temperature control, a hot gas was directly discharged on the cavity surface. Based on the heat convection between the hot gas and the cavity surface, the cavity temperature rose to the target value. Practically, the gap between the heating surface and the gas gate is an important parameter as it strongly influences the heating process. Therefore, this parameter was analyzed under different values of plate-insert thickness herein. Heating was elucidated by the temperature distribution and heating-rate data detected by the infrared camera and sensors. Then, external gas-assisted mold-temperature control was applied for the thin-wall injection-molding part of 0.5 mm thickness with the local-gate-temperature control. The results show that with 300°C gas temperature, the heating rate could reach 9°C/s with a 0.5-mm stamp thickness and a 4-mm gas gap. The results show that with local heating at the melt-entrance area of the mold plate, the cavity was filled with a 20-s heating cycle.
Keywords
Introduction
Thin-wall and micro-injection molding is used to manufacture a variety of polymer components because of its low cost and high-volume production. Many of the components are used in micro-optic and micro-fluidic applications, such as optical gratings, optical switches, waveguides, pumps, capillary analysis systems, and lab-on-a-chip applications.1–5 To improve the quality of an injection molded plastic part requires both high mold temperature and reduced injection pressure. Mold-temperature control is thus a key parameter in the injection molding process. It is known that a high mold surface temperature results in a better quality plastic part but leads to longer cooling time and cycle time. By the same token, a lower mold surface temperature reduces cooling time but lowers the surface quality of the part.6–9 A challenge for current researchers is to figure out how to increase the mold surface temperature while maintaining a reasonable cycle time, specifically, how to maintain high mold temperature as the mold is being filled with molten plastic while lowering the mold temperature to below the deflection temperature after filling without significantly increasing cycle time or energy consumption. To solve this problem, researchers have recently explored a variety of dynamic mold-temperature controls (DMTCs) whose function is to eliminate the frozen layer that forms when molten plastic contacts a cool surface, such as a molding part, by providing a hot mold plate during the filling stage and is cooled quickly in the cooling stage of injection molding process. 8 For the heating step in injection molding, two types of solutions exist, including the volume-heating and the surface-heating methods. For volume heating, the entire mold plate is heated. By contrast, the surface-heating method impacts only the cavity surface. With the volume-heating method, the most inexpensive way to achieve a high mold temperature is to use water heated at temperatures as high as 90°–100°C.9–11 In the case where mold temperature must be >100°C, steam heating could be applied to the mold plate.12–14 Although these methods are efficient in molding and improve the quality of the molded part, the channel and connector may be damaged when operating at high pressure, and energy costs are also an issue. Other heating methods include the use of an electric heater for local heating of the mold.15,16 These methods could raise the mold temperature to 150°C and help increase the length of the melt flow, especially with respect to micro-injection molding. 17 However, the electrical method often requires additional design and tool costs, and it also requires an auxiliary form of heating. In general, with volume-heating methods, the mold temperature could be increased to improve the quality of the molded part. However, the heating rate, energy costs, and system safety still require further consideration and optimization. To reduce these disadvantages, a thin heater has been adopted to control the temperature of cavity surfaces during the injection molding process. This method supports fast cooling even when kept active for very long period of time. Experimentally, the heater was set at 150°C for a long heating time, which resulted in a significant effect on the samples frozen in orientation that were observed via optical microscopy and confirmed through X-ray analysis. This method could be applied for micro-injection molding with a proper-sized sheet heater. 18
In recent years, many researchers proposed heating just the mold surface rather than the entire mold plate volume by increasing the mold surface temperature through methods such as induction heating,19–22 high-frequency proximity heating,23,24 and gas-assisted mold-temperature control (GMTC).25–27 With the induction-heating method, a high-frequency current is created in an external coil, and the induced current appears on the mold surface; this induced current heats the mold surface. This method can support a high heating rate, and it also enables the calculation of temperature distribution. In high-frequency proximity heating, when two metallic mold plates face each other with a small gap and carry high-frequency electric current flowing in opposite directions, the current tends to flow along the two inner surfaces facing each other, resulting in a stronger magnetic field forming between the gaps of the two plates. The two mold plates are heated by the proximity-heating effect. However, these two heating methods are applied only to steel molds with high permeability and can easily overheat the mold plate with their rapid heating time; this can cause forming problems, especially along the edges of the molded part.
Compared to the induction-heating and proximity-heating methods, the heating rate for gas heating is not as high, although gas heating can be used for most mold materials, and it will not overheat the mold due to the heat convection that characterizes the heat transfer between the hot gas and mold surface. In our previous research, an internal gas heating system was installed in the mold structure to make it more heat efficient by regulating heating rate and temperature distribution.25,27 Although testing of the system showed positive results, there were a couple of issues: (1) adding a gas heating system to the mold design proved to be very difficult to achieve; (2) loss of thermal energy from the heat transfer was still too high.
Consequently, in this study, we tested the feasibility of an external gas-assisted mold-temperature control (Ex-GMTC) combined with a pulsed cooling system in heating the mold surface by varying the thickness of the mold plate insert and by varying the gas gap between the gas gate and heating surface to determine its effect at different heating temperatures on the heating rate and temperature distribution of the mold surface for thin-wall injection molding. In addition, we looked at how the Ex-GMTC may improve melt flow length in the injection molding of a front cover plate article.
Simulation and experimental method
Ex-GMTC is a new technique in the field of mold-temperature control, which can heat and cool the mold surface rapidly during injection molding. In general, the goal of mold-temperature control is to increase the temperature of the mold surface to the target temperature before filling the mold with plastic melt and then cooling the melt to the ejection temperature. In this research, the Ex-GMTC system consisted of a pulsed cooling system, hot-gas generator system (including an air compressor, air drier, digital volumetric flow controller, and high-efficiency gas heater), and water mold-temperature controller as shown in Figure 1.

Ex-GMTC system.
The high-power, hot-gas generator system functioned to support the heat source, which provided a flow of hot air up to 300°C with an inlet gas pressure of up to 7 MPa. The hot air was thus the heating source for increasing the mold surface temperature. 28 For the coolant system, a mold-temperature controller was used to control the water temperature for cooling the mold after the filling process and for warming the mold to the initial temperature before the beginning of the next cycle. The pulsed cooling system was used to control the water flowing in cooling channels and to control air for the heating stage. When the water flows inside the cooling channel, it cools the mold plate; therefore, for improving the heating efficiency, in the heating step, the water was stopped for reducing the external loss of energy. To both regulate and track the temperature at the cavity surface, five temperature sensors from Extech Instruments—TP875—were used to obtain real-time mold-temperature data and to provide feedback to the Ex-GMTC controller.
This mold surface-heating method for injection molding is as follows (Figure 2). Step 1: two mold plates are moved to the opening position. Step 2: the hot-gas drier is moved to the heating position and air is heated as it flows through the gas drier and is directed to the cavity surface. Upon contact with the hot gas, the cavity surface is heated to the target temperature. Step 3: once the cavity surface reaches the target temperature, the mold is completely closed in preparation for filling.

Mold position during the heating stage of injection molding process.
Figure 3 shows the position of the Ex-GMTC and the mold plate on the injection molding. The gas drier with the dimensions of 240 mm × 100 mm × 40 mm is shown in Figure 4. A gas channel, 5 mm in width and 10 mm in depth, was cut inside the gas drier. The heating area of the mold cavity was inserted with a stamp with dimensions of 100 mm × 50 mm. The location of the mold, stamp inserts, and sensors are shown in Figure 5. In both simulation and experimental testing, the position of all components of the injection molding system during the heating stage was the same as shown in Figure 6. To measure the heating effect of the Ex-GMTC on stamp temperature, five temperature sensors were used, one located at the center of the injection molding system near the outlet of gas drier and the other sensors located at the top and bottom side of the cavity plate.
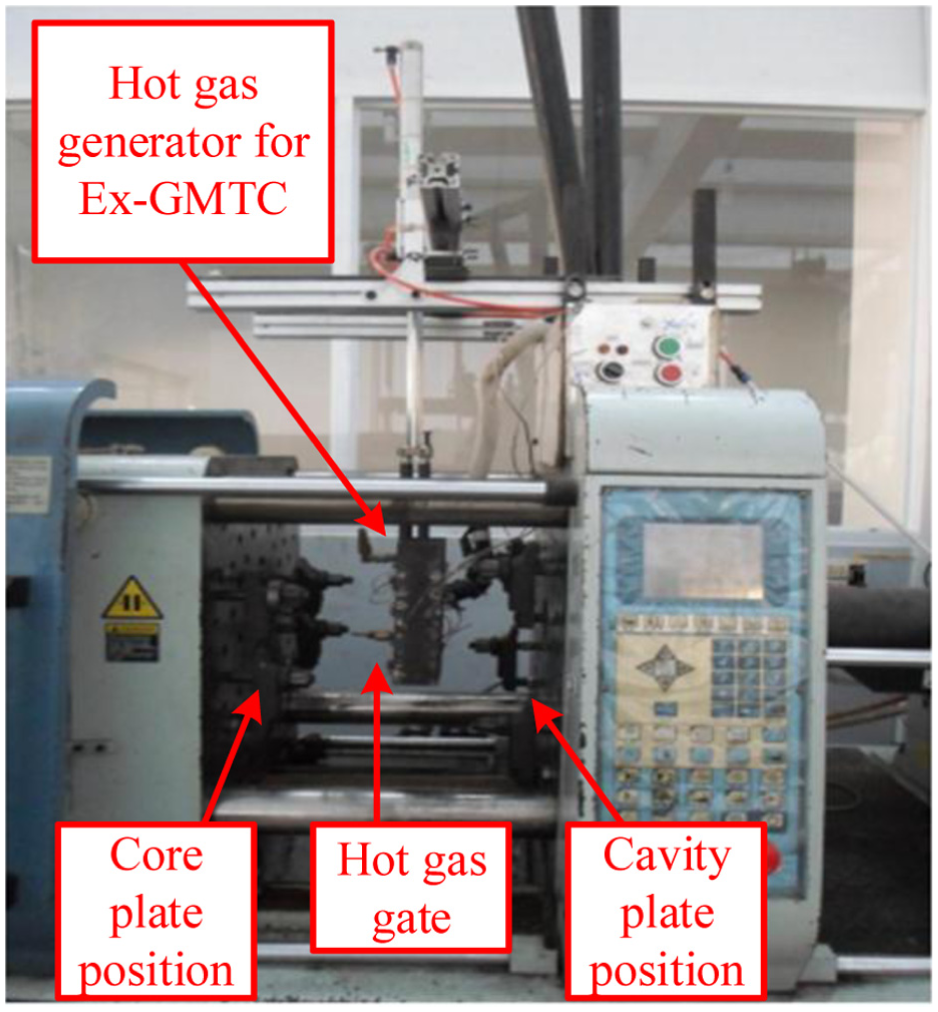
Experimental model for Ex-GMTC.

Hot-gas generator component parts.
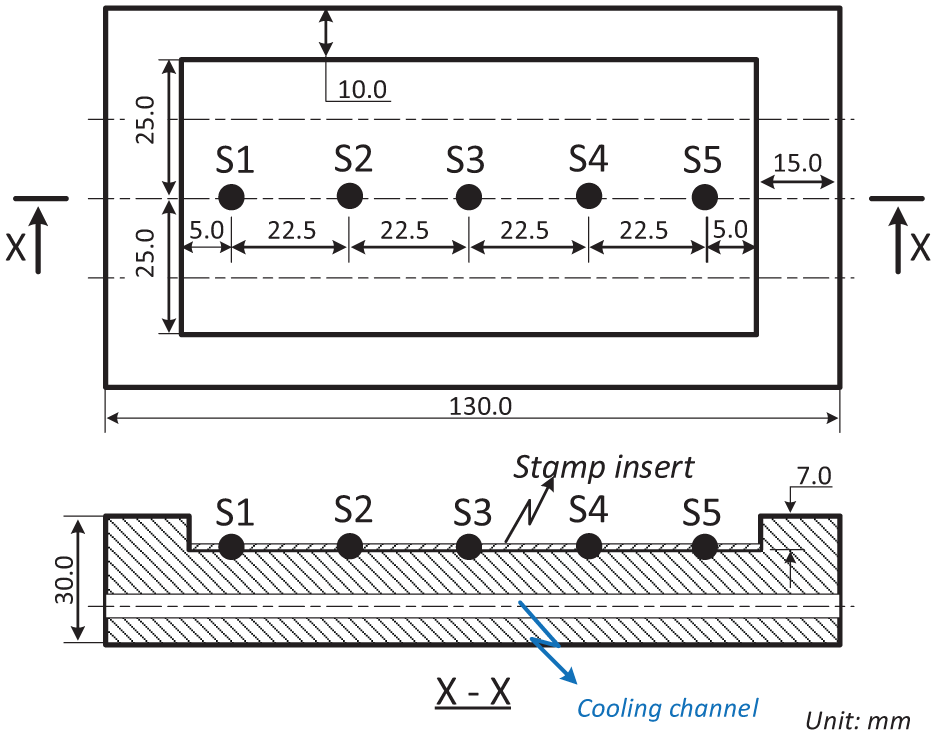
Cavity dimensions with sensor locations S1 to S5.

Heating position of Ex-GMTC.
A simulation model of the stamp was built to study the temperature distribution of the heating area. In accordance with other research,26,27 the simulation model included a stamp volume and air volume. The air volume accounted for the small air gap between the stamp insert and the mold, which acted as an insulation layer. A meshing model of the stamp is shown in Figure 7, boundary conditions are shown in Figure 8, and the properties of air and stamp are listed in Table 1. The simulated stamp was a hex-dominant mesh with seven layers of thickness, and the air volume was a tetrahedral mesh with the smaller element size which will be set up at the hot-gas inlet location. Simulation of the heating process using ANSYS involved the same experimental parameters.

Meshing model.
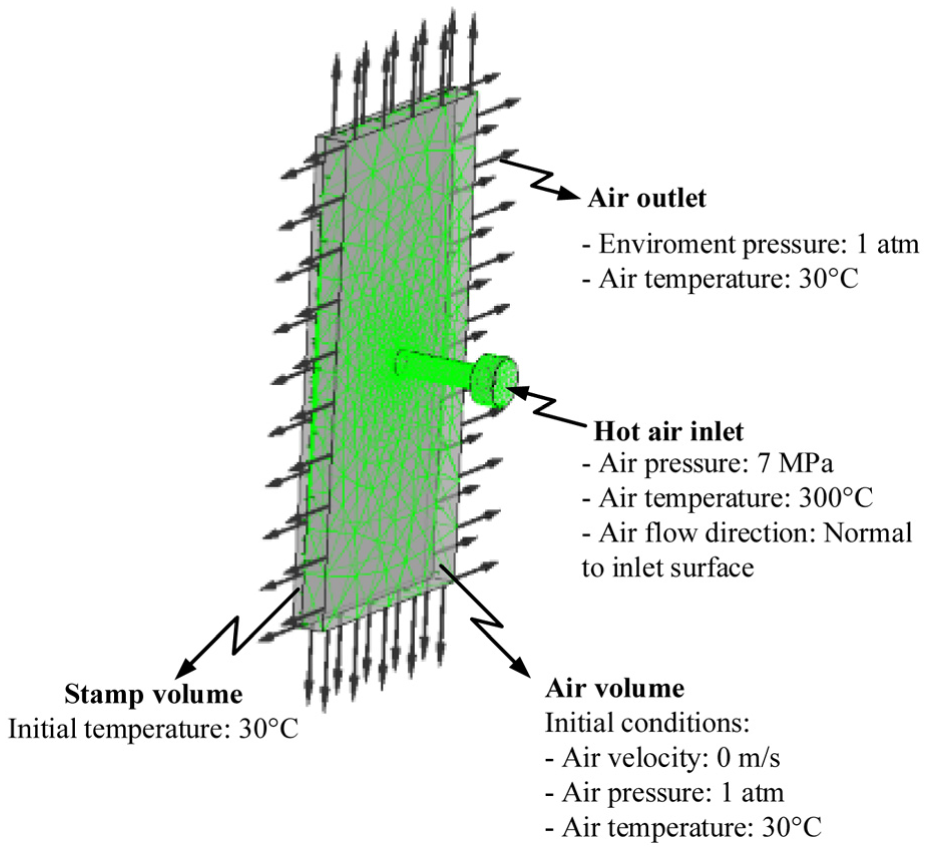
Boundary condition of the simulated model.
Material properties (for simulation).

The experiment involved thin-wall injection molding (SW-120B molding machine from Shine Well Machinery Co., Ltd) of a polypropylence (PP) Moplen EP3OOL (from LyondellBasell) material into a front cover plate article as shown in Figure 9. During the common injection molding process, this product is vulnerable to short shot trouble when the injection pressure is low; however, with very high injection pressure, the flash trouble is frequently encountered. 7 Therefore, with the ability of mold-temperature control, the Ex-GMTC will be applied for such molding processes to achieve improvements in product quality when the injection molding process will be operated with the middle injection pressure. Molding parameters were maintained for all testing cases (Table 2). With each case of gas temperature, the molding cycle was operated with 20 cycle products to achieve the stability of all systems; subsequently, products of the next 10 cycles were collected for comparing the melt flow length.

Front cover part dimension.
Molding parameters for an injection molded front cover plate article.

Ex-GMTC: external gas-assisted mold-temperature control.
Results and discussions
Effect of stamp thickness on the heating process
In other studies,25–28 with the mold surface-heating method, the structure of the stamp insert is often controlled for increasing the heating efficiency. Based on the results of these studies, the stamp thickness proved to be one of the most important parameters in mold design. Therefore, in this article, for estimating the heating ability of Ex-GMTC, a stamp with the size of 100 × 50 mm2 was inserted into the cavity, and the heating process was achieved with a hot-gas temperature of 300°C and the gap between the gas gate and the heating surface was 7 mm. The variation in the mold temperature (at sensor S3 –Figure 5) versus time for a heating time of 20 s is depicted in Figure 10. At the initial mold temperature of 30°C, the Ex-GMTC was shown to heat the plate to above 190°C, higher than the glass transition temperature of common plastics, and could reach a maximum heating rate of 8.3°C/s. Hence, for raising the mold surface temperature, the Ex-GMTC showed high heating efficiency.

Mold temperature (taken at S3) as a function of time for varying plate thicknesses.
Stamp thicknesses of 0.5, 1.0, 1.5, and 2.0 mm showed a heating rate of 8.3, 8.0, 7.1, and 6.4°C/s, respectively. A decrease in heating rate corresponded with an increase in stamp thickness, that is to say, an increase in stamp volume. Therefore, the thicker the stamp, the more thermal energy is needed to raise the stamp temperature. In this research, to evaluate the uniformity of the heating process under various stamp thicknesses, the temperatures at the five sensors, as shown in Figure 5, were collected and compared through simulation and experiment. Figure 11 shows the simulation result about temperature distribution. The temperature at the end of heating step collected and compared as in Figure 12. The results show that the highest temperature is located at the center of the stamp, which is closest to the hot-gas gate, while the lowest temperatures are located on either ends of the stamp. This distribution profile is more desirable than the temperature distribution obtained by the internal GMTC, which shows non-uniform temperatures of cavity area.25,27 With the temperature distribution discussed in this paper, the product will be cooled from the far to the closer of melt entrance; therefore, the hot melt will be flowed easily to the cavity, particularly in the case of thin-wall injection molding. The Ex-GMTC also eliminates the problem of low temperature at the center with the induction-heating method.19–22 The results additionally show that when the stamp increased in thickness from 0.5 to 2.0 mm, the maximum temperature decreased from 196°C to 158°C. The difference temperature between the sensor locations are 70°C, 72°C, 52°C, and 45°C with the stamp thickness of 0.5, 1.0, 1,5, and 2.0 mm, respectively. This difference is attributed to the difference in heat transfer of the plates. With a thinner plate, thermal energy is concentrated in the center region; however, with a thicker stamp, heat transfers to the lower temperature region. Moreover, it requires more thermal energy to raise the temperature of a thicker stamp at the center region than a thinner stamp. These results also prove that with the heating time of 20 s, for all type of stamp thickness, the temperature of stamp varies from over 110°C to about 200°C. Given that the minimum and maximum temperature obtained within a heating time of 20 s were 110°C and 200°C, respectively, Ex-GMTC is ideal for injection molding because it is within the glass transition temperature for most plastics and does not reach a temperature that would degrade the plastic.
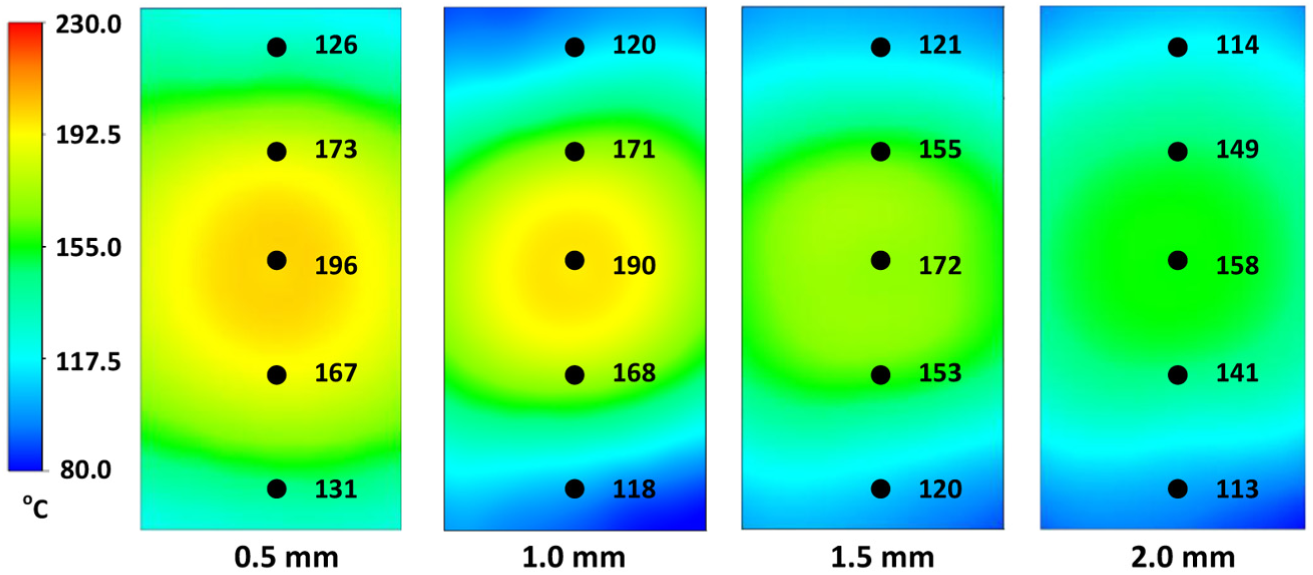
Temperature distribution of the stamp area with an initial temperature of 30°C, gas temperature of 300°C, inlet gas pressure of 7 MPa, and heating time of 20 s.

Temperature on the center line determined via experiment.
For verifying the accuracy of the simulation result, the experiment was performed with the same boundary conditions as those in the simulation. The experiment had been performed 10 times for each case, and the average value of the data will be subsequently represented for this case. Temperature data from the sensors were collected and compared with the simulation results as shown in Figure 13. The difference between simulation and experimental results was less than 10°C. This difference is due to the delay in measurement of the sensor, especially with this state, the thermal energy transfers quickly from the high-temperature area to the lower temperature area. Nonetheless, the overall results of the simulation and experimental studies show good agreement.

Comparison of temperature on the center line with different stamp thickness by simulation and experiment.
Effect of gas gap between air gate and surface heating on the heating process
In injection mold, for heating the core plate, the heating area is often convex; thus, the gas gate may often be in proximity to this area. However, with the cavity plate, the heating area is often concave and the depth depends on the height of the plastic product; thus, in many cases, the gas gate cannot approach the heating area with a tall product. Therefore, in this case, the gap between the heating surface and the gas gate is an important parameter, which has a strong influence on the heating process. Therefore, in this article, this parameter will be analyzed with the model as shown in Figures 5 and 6 with a gas temperature of 300°C, a stamp thickness of 0.5 mm, and a heating time of 20 s. In the injection molding product, the common height is often limited to 10 mm; therefore, the gas gap will be varied with the values of 4, 7, and 10 mm.
Figure 14 shows heat diagrams of the temperature distribution of the stamp at different gas gaps. Results show that with a smaller gap, heat concentrates at the center of the plate, resulting in a higher temperature at the center region as well as larger temperature differences along the plate. In detail, based on the simulation result, the temperature difference on the center line of stamp is 81°C, 70°C, and 54°C. For a 0.5-mm stamp thickness with a gap of 10 mm and at 20 s of heating, the temperature distribution is somewhat more uniform than the other two gap conditions. Figure 14 also shows that with the larger heating area, the larger gas gap can support the better temperature distribution. However, with the narrower heating area, the smaller gas gap could support the faster heating speed due to the concentration of the thermal energy. The comparison was achieved between three types of gas gaps as shown in Figure 15(a). For verifying the accuracy of simulation result, the experiment had been done with the same gas gap. Results of the simulation and experimental testing show good agreement as shown in Figure 15(b)–(d). With the gas gap of 10 mm, the difference is quite larger than the other two cases due to the influence of environment in experiment. In the simulation, the boundary condition does not include the air generated from other sources in the workshop. However, in the practical experiment, air generated from other sources affected the flow of the hot gas, which reduced the concentration of the gas at the heating surface, resulting in decreased heating efficiency. Therefore, the actual temperature was lower than that obtained in the simulation. In real molding processes, the gas gap should be minimized as much as possible because the air produced from other sources is difficult to predict, and the operator should reduce the air flow from other sources to the heating area. Figure 16 shows a comparison of the temperature distribution between the simulation and experiment for the 10-mm gas gap case. This result indicates that the high-temperature area also appeared at the center of the stamp. However, in the experiment, the high temperature tended to appear on the left side of the stamp, which could be attributed to the asymmetry of the gas gate on the gas dryer (Figure 4). Thus, in the heating step, the thermal radiation of the gas dryer potentially resulted in a higher heating temperature on the left side of the stamp as compared to that on the right side (about 8°C higher). In the future, this imbalanced distribution could be solved by properly configuring and optimizing the gas dryer.
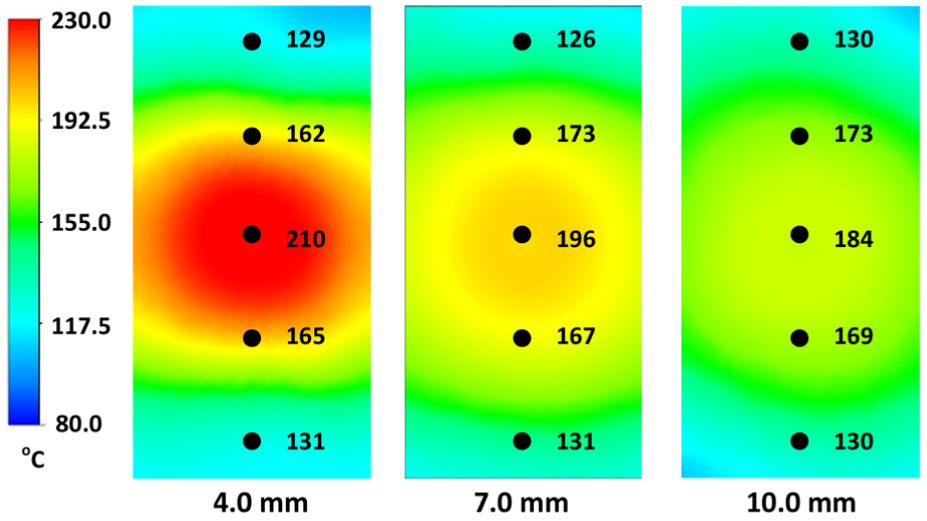
Temperature distribution of the stamp at gas gap sizes of 4.0, 7.0, and 10.0 mm, heating time of 20 s, and stamp thickness of 0.5 mm.

Plots of temperature taken at five sensor positions, with heating time of 20 s, and stamp thickness of 0.5 mm in (a) simulation testing of three air gaps, (b) experimental and simulation testing with 4.0 mm air gap, (c) experimental and simulation testing with 7.0 air gap, and (d) experimental and simulation testing with 10.0 air gap.
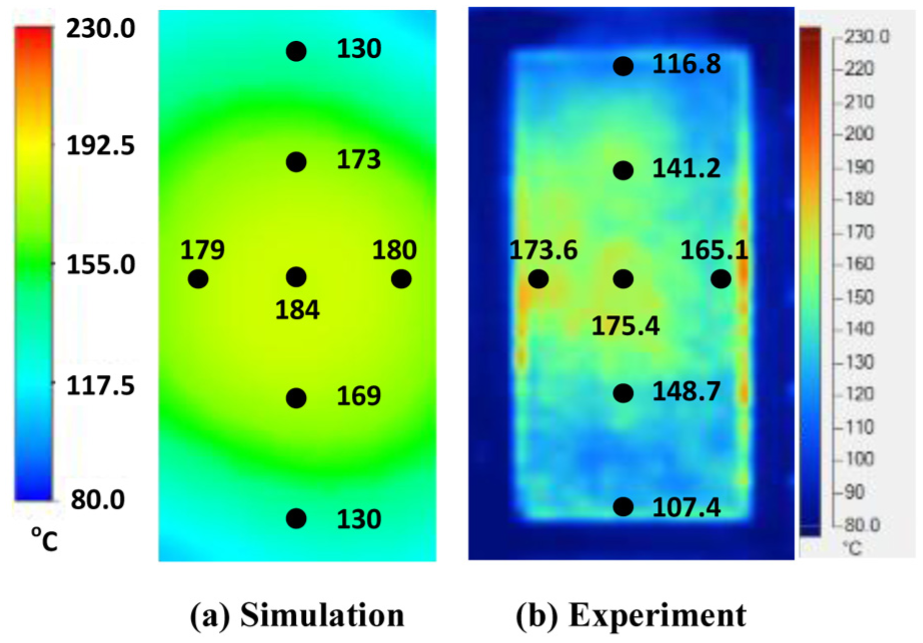
Temperature distribution of the stamp at gas gap sizes of 10.0 mm, heating time of 20 s, and stamp thickness of 0.5 mm in (a) simulation and (b) experiment.
Improving the melt flow length of front cover part by external gas heating for the gate-temperature control
For verifying the effectivity of Ex-GMTC on the injection molding cycle, the mold for the product of front cover plate was used. The dimension of this product is shown in Figure 9 with a thickness of 0.5 mm. The melt material was polypropylence (PP) Moplen EP3OOL from LyondellBasell. For the common injection molding cycle, the mold temperature should be set in the range of 20°C–80°C. However, with thin-wall products, as in this case, for full filling cavity, the mold temperature must be set as high as the system can manage. This setup provides the hot melt flows easily due to the reduction in the freeze layer of melt flow.5,21 However, when the mold temperature is high, wastage of energy will occur as well as other troubles such as the warpage and flashing. For alleviating these troubles, local mold-temperature controlling was performed in this article. Instead of maintaining all mold plates at high temperatures, local mold-temperature controlling was applied for the gate area by the local air pre-heating at the beginning of the molding cycle. High temperature at the gate area will reduce the pressure drop of the melt flow when it passes the area. Figure 17 shows the cavity plate, which includes the cavity area and the gate area. The same with above structure, the gate area was redesigned with a steel insert for improving the heating efficiency. This insert had the following dimensions: 20 × 15 × 10 mm3. For observing the influence of gas temperature on the heating process, in this case, gases with the temperatures of 150°C, 200°C, 250°C, and 300°C were used with a heating time of 20 s. For verifying the heating efficiency as well as the ability of local heating, an infrared camera was used for detecting the temperature distribution after the heating step. Thereafter, the real molding cycle was achieved with parameters as given in Table 2. Figure 18 shows the temperature distribution of the cavity plate at different gas temperatures. Figure 19 shows the melt flow length of the molded part at different gas temperatures. Results of the gate temperature and melt flow length are shown in Table 3. The result of temperature distribution shows that the high temperature occurs only on the gate area, which was heated by the hot gas in 20 s. It means that the mold plate was maintained a low temperature in all molding cycles that will help alleviating the part’s warpage and flashing as well as the wastage of energy. In the without heating condition, the melt length is 109.5 mm and the gate temperature is about 40°C. With the Ex-GMTC, when the gas temperature increases from 150°C to 300°C, the gate temperature varies between 95°C and 140°C at a heating time of 20 s. Prior research reports that when mold temperature is higher than the glass transition temperature, the melt flows easily. 21 Hence, in this study, when the gate temperature was higher than 125°C, the cavity was completely filled as shown in Figures 19 and 20. When the gas temperature reached higher than 250°C, the mold for the front cover part was filled. In addition, these results demonstrated that the Ex-GMTC improved the melt flow length from 85.8% to 100% filled for injection molding of a thin-wall article when the mold plate was held at the room temperature.

Mold for front cover part with a gate heating area.

Temperature distribution of cavity plate after 20 s of heating at different hot-gas temperatures.

Melt flow length of front cover part after molding with Ex-GMTC at different hot-gas temperature.
Experimental result of Ex-GMTC for local melt entrance.

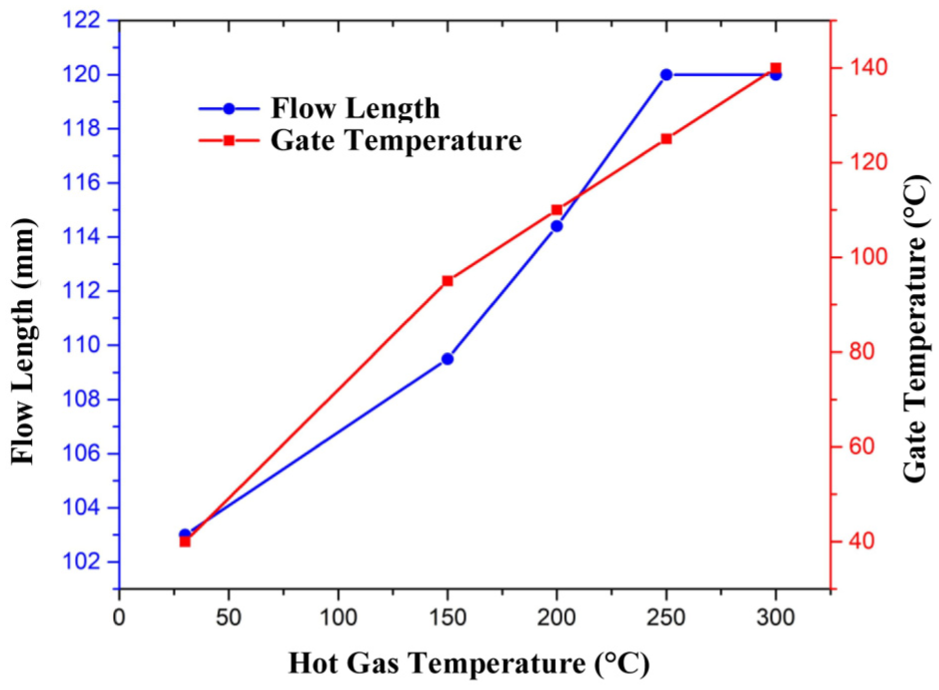
Melt flow length and gate temperature under different gas temperature for Ex-GMTC.
Conclusion
In this study, an Ex-GMTC combined with pulsed cooling system was tested at different plate thicknesses and gas gaps and at different temperatures to determine its effect on heat rate and temperature distribution of the mold surface. Key findings were as follows.
Stamp thickness clearly influenced heating rate and temperature distribution: a thinner stamp had a faster heating rate, while a thicker stamp had more uniform temperature distribution.
Gas gap distance also influenced heating rate and temperature distribution: with a smaller gap, heat was concentrated in a focal area and at a faster heating rate, while with a larger gap, heat was more spread out and more uniform.
The use of the Ex-GMTC improved melt flow length of thin-wall product. By using the infrared camera, the temperature distribution at the cavity plate shows that only the gate area was heated, and the other area was maintained at the common temperature. A fully filled cavity was obtained when the gas temperature was set at 250°C at a heating time of 20 s.
Footnotes
Acknowledgements
The authors are grateful to Mr Tran Hong Phuc, Mr Nguyen Phuoc Thien, and Mr Nguyen Hoai Phi for helping in the experiment.
Handling Editor: Shun-Peng Zhu
Declaration of conflicting interests
The author(s) declared no potential conflicts of interest with respect to the research, authorship, and/or publication of this article.
Funding
The author(s) disclosed receipt of the following financial support for the research, authorship, and/or publication of this article: This research was funded by the Ministry of Education and Training, Vietnam and HCMC University of Technology and Education, Ho Chi Minh City, Vietnam.