
Abstract
In order to evaluate roadside crash severity and help making decision on roadside safety improvement alternatives, this article proposes a roadside crash severity evaluation method based on vehicle kinematics metric during the crash: Acceleration Severity Index. Based on the field investigation on 1917 km of representative roads, roadside crash test standards and parameters were determined. A total of 59 crash scenarios, involving 5 typical roadside obstacles, 2 types of guardrails, 15 embankment slopes, and 3 types of vehicles (car, bus, and truck), were designed for simulated crash testing with VPG3.2 and LS-DYNA971 software. The x-, y-, and z-direction acceleration (or deceleration) curves of a test vehicle’s center of mass during each crash test were collected for the calculation of the Acceleration Severity Index values. The Fisher optimal partition algorithm was used to cluster the Acceleration Severity Index values to identify an appropriate number of roadside crash severity levels and the corresponding threshold values that demarcate these levels. The results showed that the roadside crash severity classification produced by Acceleration Severity Index–based method is consistent with handbook Guideline for Implementation of Highway Safety Enhancement Project. Therefore, when crash data are missing, crash test could be a feasible surrogate method for roadside crash severity evaluation.
Introduction
Background
In China, run-off-roadway crashes cause significant traffic injuries and fatalities, accounting for 70% of all traffic crash. Among these run-off-roadway crashes, crashes with fixed objects lead to 30% of injuries and 50% of fatalities. 1 To address this issue, China’s Ministry of Transport initiated a “Highway Safety Enhancement Project” in 2004 to reduce the occurrence and injury severity of run-off-roadway crashes. To make feasible and effective roadside safety improvements, the first task is to evaluate the frequency and severity of run-off-roadway crashes objectively and quantitatively. Several studies reported the frequency of vehicular crashes in China.2–4 However, the number of studies regarding run-off-roadway crash severity has been limited. A few evaluation methods for assessing run-off-road crash severity in China have been proposed,5,6 but they are primarily qualitative or empirical in nature. Therefore, it is necessary and significant to select reasonable evaluation indexes and theories to analyze and predict the severity of run-off-roadway crashes in China, which is also important in roadside countermeasure development and roadside safety improvement.
Run-off-roadway crash severity is defined in this article as the resulting injury level of the most severely injured occupants or driver in a run-off-roadway crash. Researchers have proposed many models to evaluate crash severity, one of which is based on injury-severity data of reported crashes. According to the national Fatality Analysis Reporting System (FARS) definitions in the United States, injury severity is classified into five categories: property damage only, possible injury, non-disabling injury, disabling injury, and fatality. In China, accident severity is divided into four levels: extra serious accident, major accident, ordinary accident, and minor accident. 7
Literature review
Numerous statistical and non-parametric methods have been applied to analyze crash severity based on selected crash data, which can be classified into four categories:7,8
Binary outcome models, including Bayesian hierarchical binary logit, simultaneous binary logit, and bivariate/multivariate binary probit models.9,10
Ordered discrete outcome models, including copula-based multivariate approach, bivariate ordered probit, heterogeneous choice model, generalized ordered logit, Bayesian ordered probit, and mixed generalized ordered logit. 11
Unordered multinomial discrete outcome models, including multinomial logit models, sequential logit and probit models, Markov switching multinomial logit, nested logit model, and mixed logit models. 12
Other models, such as artificial neural networks and classification and regression tree. 8
These utilized methods above are able to capture crash severity patterns from reported historical crash data. However, there are several concerns including, first, that the accuracy of these models depends heavily on the completeness of the analyzed crash data. Ordinary traffic crash data suffer from underreporting issue, especially for less severe cases, resulting in an overrepresentation of severe and fatal crashes. 13 Another concern is that injury-severity categories are ordinal by nature, and there may be effects between similar injury categories without distinctive definitions (e.g. no injury and possible injury), leading to incorrect inference.13,14 The third concern is certain relevant information may be missing from the crash reports and may thereby cause appreciable adverse effects on the resultant presumed crash severity level. 15 Last but not the least, explanatory variables of statistical models are potentially influenced by injury-severity outcomes. They are only present for injuries, disabling injuries, and fatalities, but not for the outcome of property damage only. This is a violation of the assumptions made in most statistical models. 8
Empirical crash testing is another traditional method used to evaluate occupant injury severity in a road crash. Other than a vehicle crashworthiness test, crash tests in this field typically do not use a crash test dummy to assess occupant risk. Instead, occupant injury severity is based on metrics derived from vehicle kinematics measured during the crash test, such as the Flair Space Model (FSM) in US procedures 16 and the Acceleration Severity Index (ASI) in European procedures. 17 Some researchers have correlated crash test measures with injury severity and found that ASI values have a strong correlation to Head Injury Criterion (HIC) and chest deflection. In addition, the Abbreviated Injury Scale (AIS) correlates considerably with ASI and HIC for some impact tests as described in EN 1317.18,19 Sturt and Fell 20 conducted 3 physical crash tests and 50 computer simulations on barriers and found that ASI did show a correlation with injury risk, but did not provide a significant difference between class B and C barriers in EN1317. Furthermore, Gabauer and Gabler 18 used Event Data Recorders (EDR) technology to investigate the correlation between the ASI threshold limits and the potential for occupant injury in crash events and found that longitudinal ASI is a good predictor of overall injury, but a lack of injuries on the AIS in excess of AIS 3. Other studies also came to similar conclusions.21,22
In addition to statistical and crash test–based methods, comprehensive analysis is a worthy method for evaluating roadside crash severity as well. The frequency and severity of a crash are integrated into a comprehensive roadside hazard level, which is based on geometric features, clear zone distances, guardrail settings and slopes along the roadside. Zegeer et al. 23 classified roadside hazard into seven levels based on clear zone width, side slopes, guardrail specifications, roadside obstacles, and geometric features, all of which have been adopted by the American Association of State Highway and Transportation Officials’ (AASHTO) Roadside Design Guide. Similarly, using subjective judgment, Sun et al. 24 classified roadside hazards into five grades in the UK’s Guardrail Location Rating System. Pardillo-Mayora et al. 25 defined the Roadside Hazardousness Index (RHI) in Spain, and divided RHI into five grades based on four indicators including roadside slope, non-traversable obstacles, distance from roadway’s edge, and safety barrier installation and alignment. Turner et al. 26 proposed a 4 × 4 matrix-based model for evaluating roadside crash severity, and defined four severity levels: negligible severity, light injury, moderate severity, and high severity. In addition, the Chinese Guideline for Implementation of Highway Safety Enhancement Project 27 proposed a comprehensive method for the secondary rural highway in China, where it divides roadside hazards into 4 grades considering 12 predictors, such as highway alignment, the number of roadside crashes, average daily traffic (ADT), and roadside features.
To sum up, each of the three major types of methods for crash severity analysis listed above has its advantages and disadvantages. The accuracy of a statistical model depends on the quality of the roadside crash database. Unfortunately, underreporting issue and missing information in China’s roadside crash database are non-negligible defects that restrict the potential efficiency of crash statistical models in China. Despite the fact that the comprehensive analysis method has the benefit of synthesizing various correlative factors influencing roadside crash severity, it is primarily based on the experience of domain experts and is thus susceptible to subjectivity. Crash tests are a commonly accepted means for empirically accessing the safety performance of roadside safety facilities; its vehicle kinematics index results should be correlated with injury severity before applied in roadside crash severity evaluation.
Contributions
Considering the imperfect state the Chinese roadside crash database is in and the inherent subjectivity of the comprehensive analysis in roadside crash severity evaluations, this article opted to evaluate the severity of run-off-roadway crash with fixed objects by crash testing. In order to reduce the cost of the crash tests, crash simulation is employed in which the vehicle collides with all typical roadside hardware. The ASI is chosen as an indicator for evaluating severity of run-off-roadway crash. A total of 59 crash scenarios were simulated using finite element analysis software VPG3.2 and LS-DYNA971. These scenarios include the following:
Three types of vehicles (car, bus, and truck) colliding with five typical roadside obstacles (pole, tree, rock, guardrail end treatment, and ditch);
Three types of vehicles colliding with two types of roadside barriers (F-concrete and W-beam steel guardrail);
Three types of vehicles crash into 15 steep embankment slopes of different heights and gradients.
Curves of the longitudinal (x), lateral (y), and vertical (z) acceleration (or deceleration) of the vehicle’s center of mass during the crashes were generated based on the results of the 59 simulated crash tests. The average vehicle acceleration rates (
Considering the limitation of crash data quality in China, this article proposes a roadside crash severity evaluation method based on vehicle kinematics metric during the crash: the ASI. This simulation-based crash testing would be used to evaluate run-off-roadway crash severity, and its effectiveness was then verified based on the simulation results. The method can be used to evaluate roadside crash severity and help make decision on roadside safety improvement alternatives.
Simulated crash testing
Crash test location and parameters
Because the aim of this research is to evaluate run-off-roadway crash severity on secondary highways in China, the basic parameters of the crash tests were collected from the field investigations on representative secondary highways as a part of China’s National Science and Technology Support Projects in the Nation’s “Eleventh Five-Year Plan.” In order for this research to be representative, comprehensive investigations were conducted covering 1917 km of secondary roads in four Chinese provinces including Sichuan, Chongqing, Guizhou, and Yunnan. The values of the main parameters of crash testing, including vehicle type, size, mass, impact angle, and impacting velocity, are tabulated in Table 1.
Parameters of vehicle crash tests.
Crash simulation models
Crash simulation models were pre-treated by the Virtual Proving Ground (VPG) technique, 29 and post-processed by LS-DYNA, 30 which was developed at Lawrence Livermore National Laboratory (LLNL) and is considered to be the most comprehensive and successful code for explicit three-dimensional nonlinear finite element modeling. 31 As mentioned, run-off-roadway crash risk is originated mainly from vehicle colliding with a roadside fixed object and/or crashing into a steep embankment. Therefore, the 59 aforementioned crash simulation scenarios were designed with LS-DYNA:
Vehicle colliding with 5 roadside obstacles (guardrail end treatment, ditch, pole, rock, and tree);
Vehicle colliding with 2 types of roadside barriers (F-concrete and W-beam steel guardrail);
Vehicle crashing into 15 embankment slopes.
The principal task for building crash simulation models by LS-DYNA is to select the appropriate finite element models for those structures involved in the crash, including vehicle and roadside hardware. Because of its computational efficiency, the three-point-quadrature Belytschko–Lin–Tsay shell element was selected to constitute all body thin-walled structures. 30 In order to reduce the complexity of the model, some criteria were set: the minimal size of every shell element is 10 mm, the warping angle of the element is less than 15°, the interior angle is larger than 25°, and the size of the vehicle body element is between 25 and 50 mm. 32
The next step is to select the appropriate material models and material parameters for the artificial structures from the available finite element models in LS-DYNA. Based on mechanical performance of structures in this study, “MAT_PIECEWISE_ LINEAR_PLASTICITY,”“MAT_JOHNSON_HO LMQUIST_CONCRETE,” and “MAT_WOOD” are selected to model vehicle bodies and roadside hardware. Details of these material models and material parameters are presented in Table 2.
Material models and parameters of crash simulation.

Definitions of profile parameters of concrete and W-beam steel guardrail can refer to the Chinese Specification for design of highway safety facilities. 27
RO is abbreviated from mass density, E is Young’s modulus, PR is Poisson’s ratio, SIGY is yield stress. More details of mechanics parameters for tree can refer to Green et al. 33
EL: elastic modulus parallel to grain; ET: horizontal chord elastic modulus; GLT: the shear elastic modulus of the chord surface parallel to grain; GTR: horizontal shear elastic modulus. 33
Another key step is to define the contact type along the interface between two identified surfaces. The main “contacts” types in this study are presented as follows (Lei and Yang 32 ):
CONTACT_AUTOMATIC_SINGLE_SURFACE is for the contact between the vehicle tire and road surface;
RIGIDWALL_PLANAR is for the contact between roadside hardware (such as guardrail, sign pole, tree, and ditch) and road surface;
CONTACT_AUTOMATIC_NODES_TO_SURFACE is for the contact between the vehicle and roadside hardware.
Using the aforementioned modeling methodology, 59 crash simulation three-dimensional (3D) models were built with VPG3.2 and LS-DYNA971, which are illustrated in Figure 1–8.

Model of vehicle colliding with concrete guardrail end treatment.

Model of vehicle colliding with roadside rectangle ditch.

Model of vehicle colliding with traffic sign pole.

Model of vehicle colliding with roadside rock (cubic).

Model of vehicle colliding with roadside tree.

Model of vehicle colliding with concrete barrier.

Model of vehicle colliding with W-beam steel guardrail.

Model of vehicle crashing into side slope.
Validation of simulation models
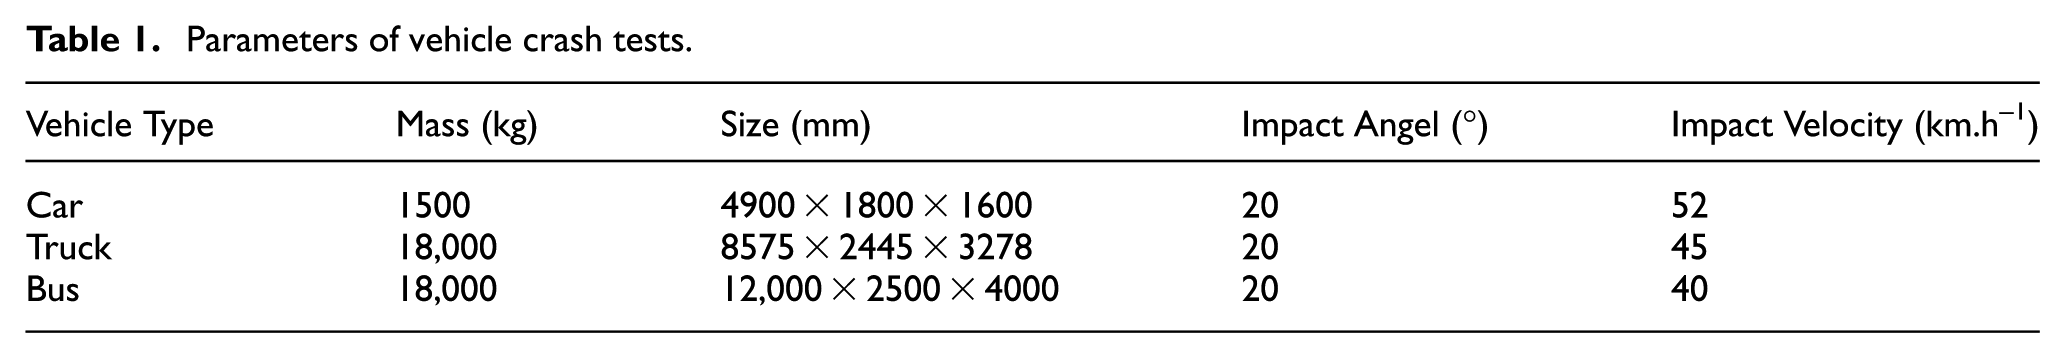
In order to ensure that the simulated results are reasonably accurate, three full scale real crash tests were performed to compare with their simulated counterparts for the purpose of validation and calibration. To this end, this research selected a passenger car colliding with a traffic sign post of Ф140 mm (diameter) × 4.5 mm (thickness) × 3800 mm (height), a rectangular ditch of 600 mm (length) × 600 mm (width) × 600 mm (depth), and a 50 m long steel guardrail separately, to perform real crashes and simulated crashes under the same testing conditions. In the real crash tests, an Accord IV of the Honda Corporation was selected as the test vehicle installed with a Moving Data Recorder (MDR). An acceleration sensor on-board and a high speed photography system with six HG-100 K/LE cameras were installed according to China-New Car Assessment Program (C-NCAP) specifications to monitor and record the entire crash sequence. 8
The simulated crashes were calibrated by comparing with the full scale real crash tests in terms of crash duration and crash force. The testing vehicles’ resultant longitudinal deceleration rates for the full scale and the simulated crashes are shown in Figure 9 as solid and dashed lines, respectively. Figure 9(a)–(c) are results of longitudinal deceleration under cars colliding with traffic sign post, ditch, and W-beam steel guardrail.
Longitudinal decelerations during colliding with (a) traffic sign post, (b) ditch, and (c) W-beam steel guardrail.
As are shown in Figure 9, the maximum deceleration rate is 14.31 g (g = 9.8 ms−2) for the simulated crash and 14.34 g for the real crash. The data collected from the instrumented crash vehicle in the real crash test clearly exhibited more details in terms variability of crash force over time. Nevertheless, the general shape, duration, and magnitude of the simulated crash appear to be reliable for the purpose of this study.
Test results
The crash simulation generated numerous metrics (such as acceleration curve, Theoretical Head Impact Velocity (THIV), and Post-Impact Head Deceleration (PHD)). Upon the completion of the simulation of the aforementioned 59 crash scenarios, a total of 177 acceleration values (longitudinal, lateral, and vertical) were generated and ready for the calculation of ASI values, which will be presented in the next section.
Run-off-roadway crash severity evaluation method
Evaluation standard and metrics
Run-off-roadway crash severity has been evaluated with the aforementioned comprehensive method, and is divided into four levels (I, II, III, and IV) based on “Chinese Guideline for Implementation of Highway Safety Enhancement Project” 27 as opposed to seven levels in the United States, 34 five levels in United Kingdom, 24 or five levels in Spain. 25 A higher level designation denotes a more dangerous roadside hazard. For example, the higher slope will generate a higher level of crash severity, colliding with concrete will generate a higher level of crash severity than W-beam steel guardrail. As mentioned above regarding the performance metrics, due to the actual quality of China’s crash database, occupant risk evaluation metrics were appropriate options for assessing roadside crash severity, roadside barriers performance, and other restraint systems including the following:
Occupant Impact Velocity (OIV)—also known as the Occupant Ride-down Acceleration (ORA) as detailed by Ross et al. 16 in NCHRP R350;
Theoretical Head Impact Velocity (THIV)—the PHD and the ASI adopted by the CEN 17 in EN1317-2 “Road Restraint Systems–Part 2”;
The average acceleration rate by the interval of 10 ms as adopted in Japanese standards 35 and in China’s “Specification for design of highway safety facilities” JTG D81-2006. 36
The ASI is used to evaluate the potential for occupant risk in crash tests, which is used widespread across Europe. To be consistent with the existing standards and guidelines in China, the ASI was used in this research for crash severity evaluation. ASI is defined as a function of time by following equation (1) 17

where
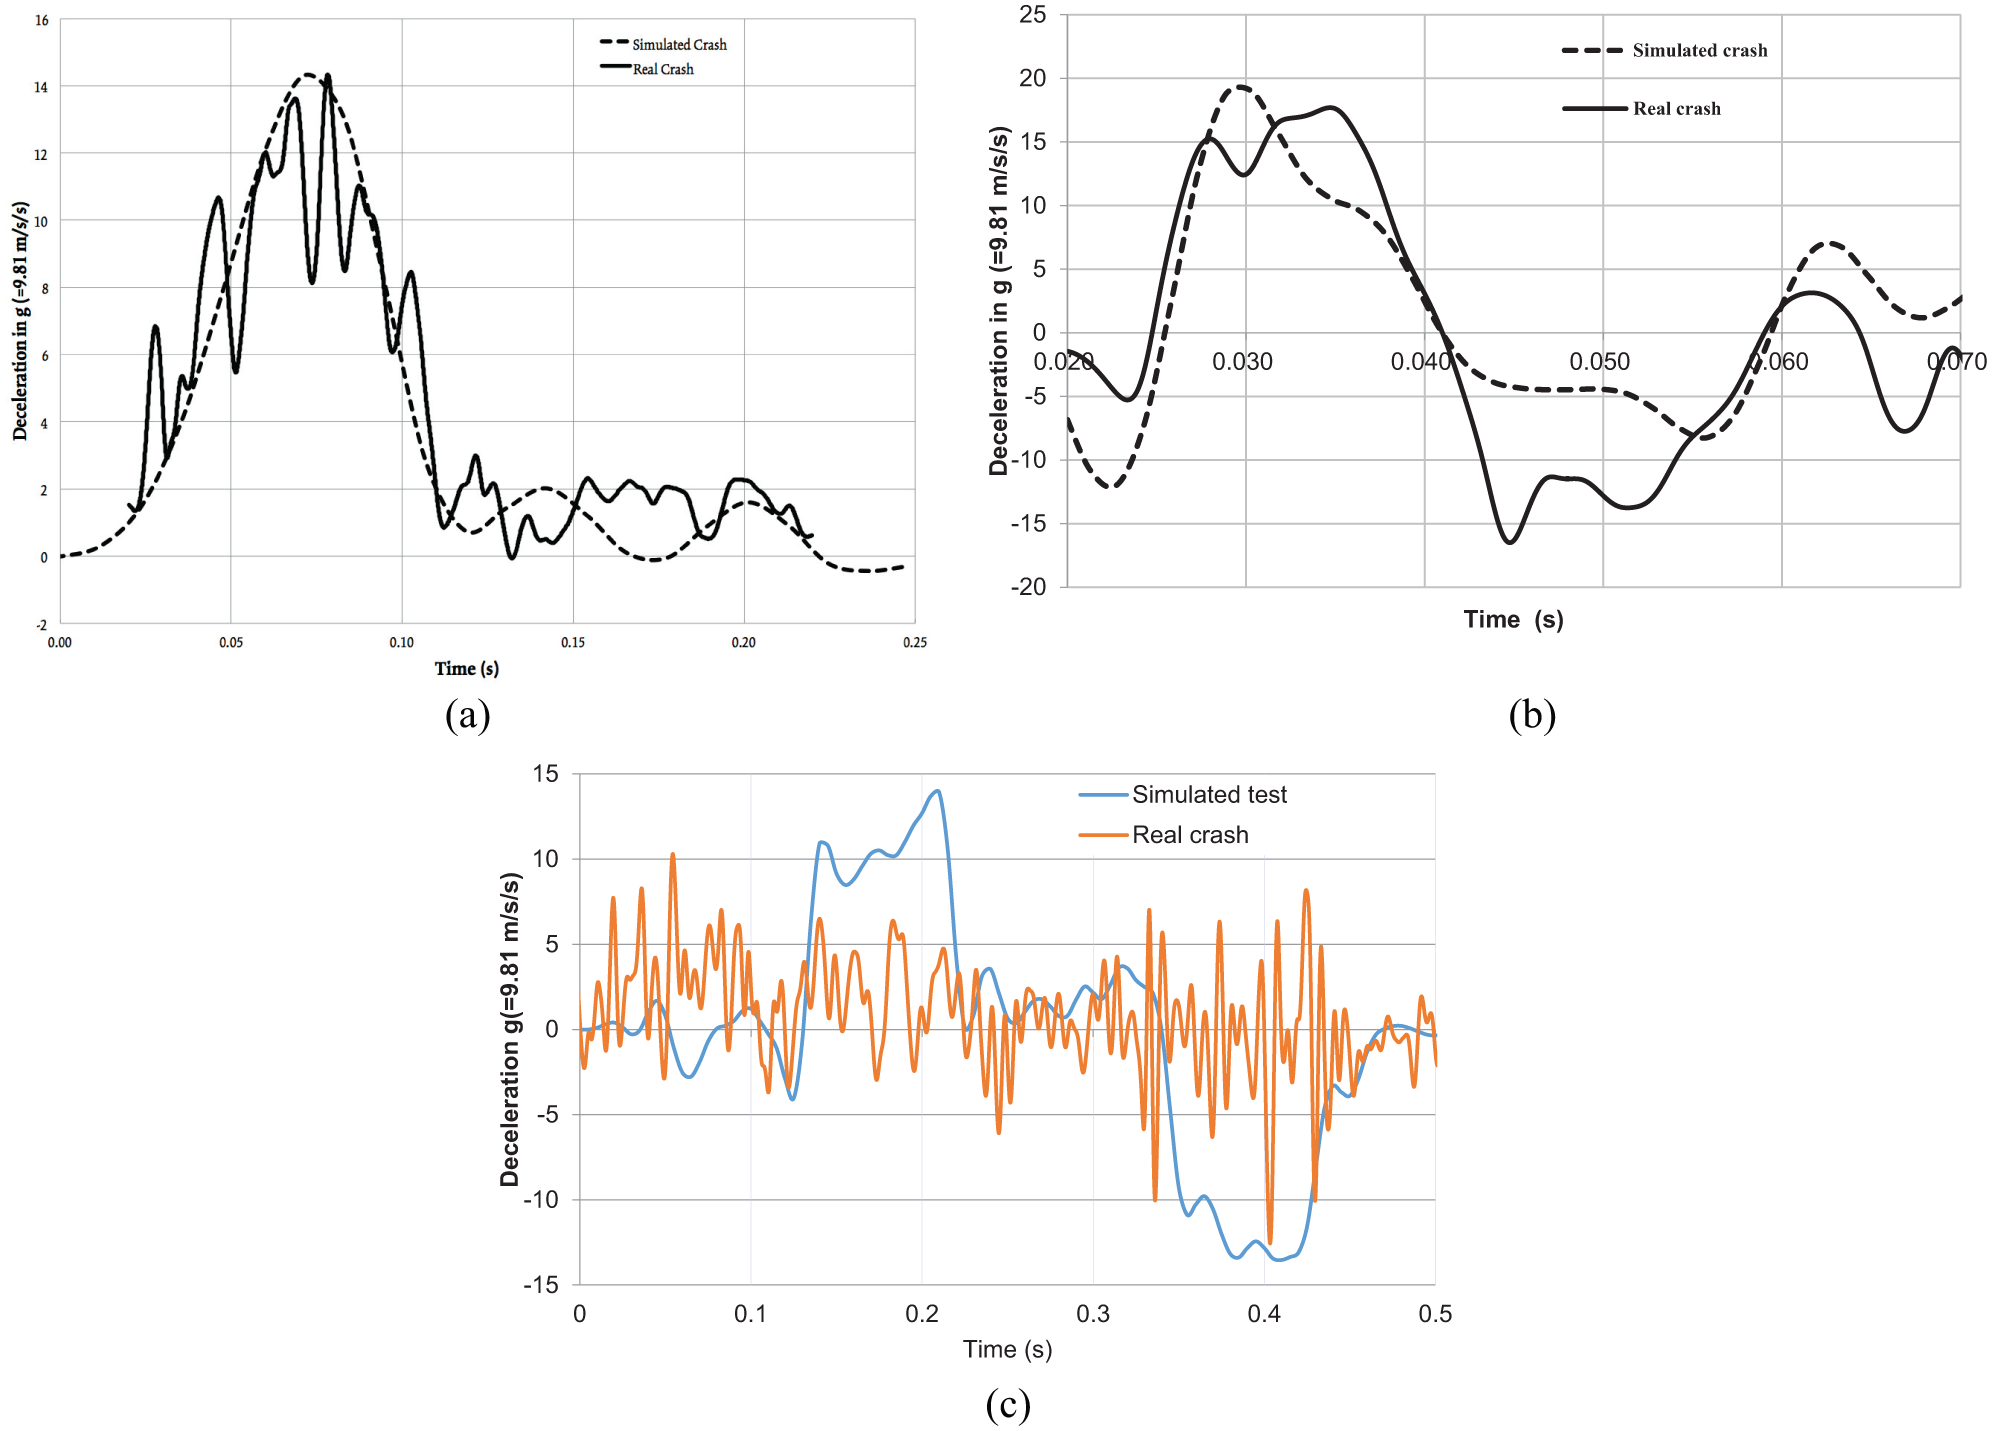
Based on the 59 crash simulation scenarios, the ASI values for various crash tests were calculated and shown in Tables 3 and 4.
ASI value of vehicle impacting with roadside objects.
ASI = Acceleration Severity Index.
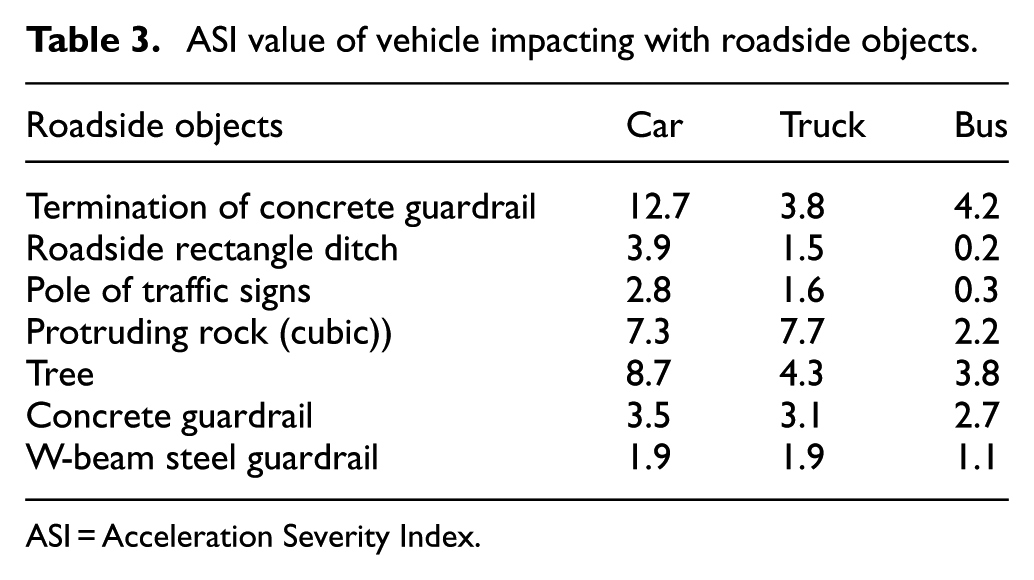
ASI value of vehicle crashing into side slope.
Some simulation tests are not included in this article, including bus crash into slope with gradient 1:2, and car and truck crash into slope with height 2 m and gradient 1:2. ASI = Acceleration Severity Index.
From Tables 3 and 4, we can find that car colliding with concrete guardrail terminal will generate more severe occupants risk than car colliding with W-beam steel guardrail, in which ASI is 12.7 for concrete guardrail terminal and 1.9 for W-beam steel guardrail. Also, colliding with the same roadside object, car will generate a larger ASI value than truck and bus do. In addition, side steep slope is a roadside hazard. If the slope height is over 2 m, vehicle crashing into slope will produce a higher severity of occupant risk than vehicle colliding with W-beam steel guardrail.
Roadside crash severity evaluation based on Fisher optimal partition
The purpose of crash severity level classification is to decide the appropriate number of levels and set the optimal threshold value for each level, where the distances among indexes within each level remain close while the indexes between different levels are notably different. This can be accomplished by applying the Fisher optimal partition method to the ASI values tabulated in Tables 3 and 4 to determine the optimal threshold values.
The Fisher optimal partition 37 is a popular method for clustering one-dimensional dataset, which minimizes the sum of the squared deviation within each group while maximizing the squared deviation among different groups. Because the total sum of the squared deviation for the entire dataset is equal to the total of the two sums mentioned above and a constant, the partition is optimal when the sum of squared deviation within each group is minimized. The key steps for implementing the Fisher optimal partition method to this study are as follows.
Sort of ASI samples
According to the EN 1317-2, 17 when ASI is less than 1.0, the acceleration value produced during the crash is small enough for occupant body to bear; the occupant injury risk is very low. In Tables 3 and 4, two ASI values are lower than 1.0, which were selected from the 59 samples of ASI, and assigned to level 1. Level 1 is the lowest level of occupant risk in roadside crash. Besides, the remaining 57 ASI values were sorted from small to large, xi (i = 1, 2, …, n) and n = 57.
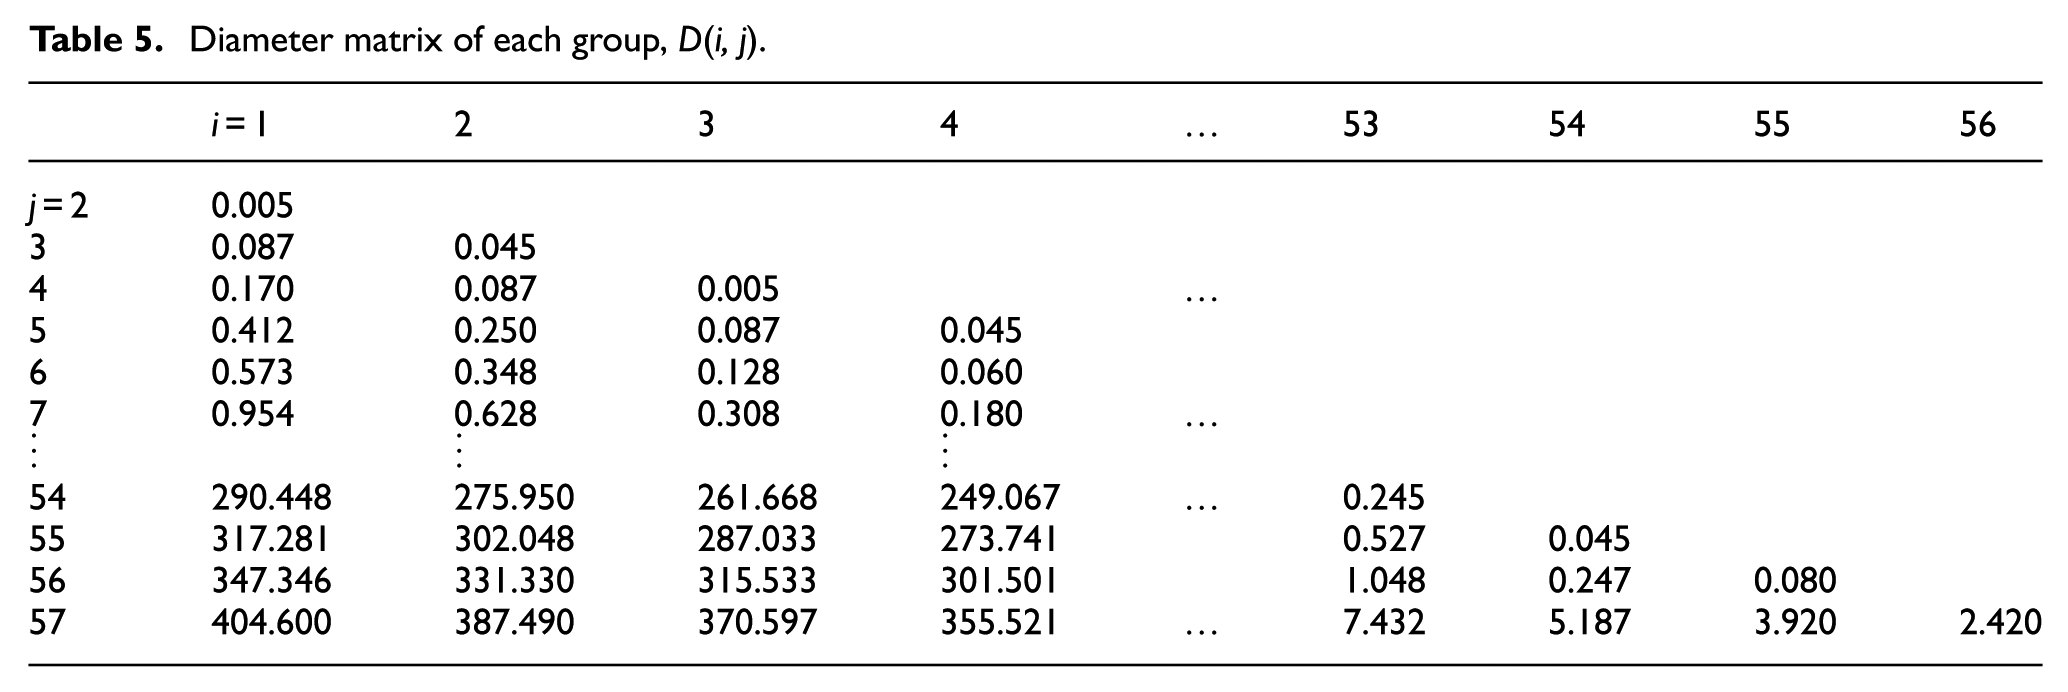
Calculation of the diameter of each group
Assuming for a certain group, Gij = {xi, xi + 1, …, xj}, j > i ⩾ 1, the diameter D(i, j) is the sum of squared deviation of all samples in the group as follows

where xl is the value of ASI for the lth sample in group Gij, and
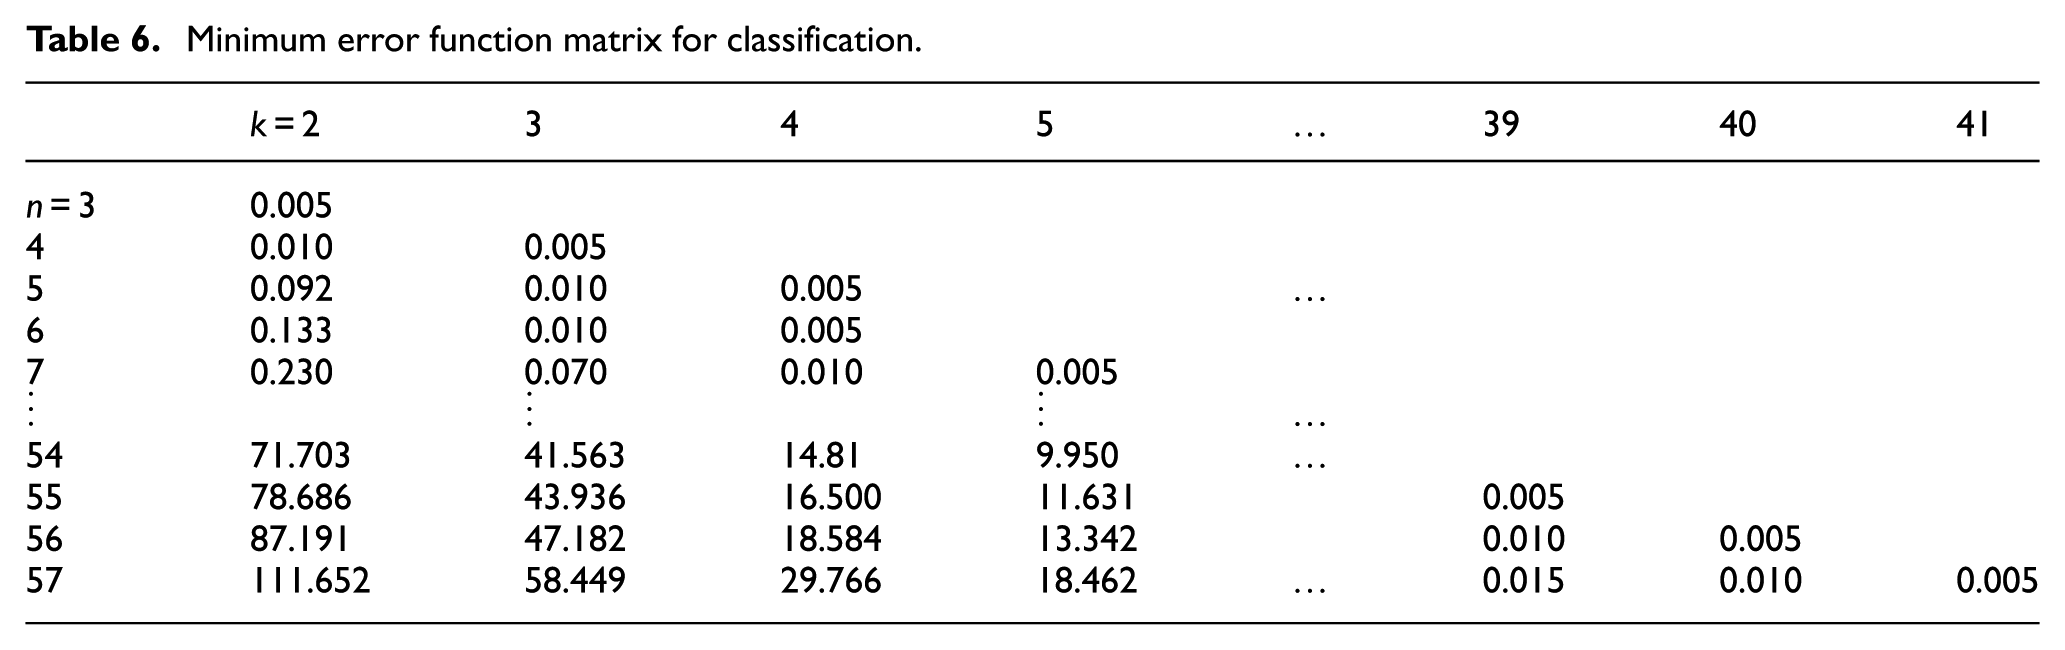
Definition of the minimum error function for classification
Assuming that n ordinal samples are divided into k groups, such as

Solution of the optimal partition
The detailed solution algorithm of the Fisher optimal partition method could be obtained from the work by Fisher. 37 The following two recursion equations are the keys to the solution algorithm


Equation (4) is the minimum error function that n samples are divided into two groups; equation (5) is the minimum error function that n samples are divided into k groups, and indicates that the calculation of
Following the four steps above, we calculated the ASI values; there are only 41 different ASI samples. Then, we calculated the values of
Diameter matrix of each group, D(i, j).
Minimum error function matrix for classification.
The relating curve of minimum error

Relating curve of minimum error function versus classification number.
Accordingly, we can classify roadside crash severity into four levels which is consistent with “Chinese Guideline for Implementation of Highway Safety Enhancement Project,” 27 and propose the roadside crash severity level classification standard in Table 7:
Relationship between roadside hazard rating and ASI value.

ASI = Acceleration Severity Index.
Limitations and further research
There are some research limitations and further research orientations to be addressed. First, the ASI-based method of severity evaluation should be correlated with injury severity. Many researchers have conducted studies on this issue and established relationships between ASI and injury severities.18–20,38–40 Some comparisons between these studies and the methodology proposed in this article would be desirable in the future.
Besides, the Fisher partition algorithm demands ASI values for all possible crash modes. Our study includes many representatives but not all possible crash modes on the secondary class highway in China. Future research with further amendments and implementations, in terms of additional test vehicles, roadside hazards, and impacting speeds and angles, are desirable for applicability in practice.
Furthermore, additional geometric considerations such as the width of the roadside clear zone and the width and slope of the roadway may contribute considerably to roadside crash severity and should be considered in future studies.
Conclusion
Crash-data-based statistical models and comprehensive crash analyses are typical approaches for evaluating run-off-roadway crash severity. However, seriously underreporting and data quality issues of China’s crash statistics render these approaches undesirable or infeasible for this study. Instead, this study applied simulation-based crash testing to evaluate run-off-roadway crash severity. Results of this study suggest that crash simulation is a suitable tool for studying roadside safety on secondary highways in China.
The ASI can reflect the occupants’ risk during vehicle impact with roadside objects, which has been proved in contemporary literature.18–20 However, ASI threshold corresponds only to “light injury, if any” but not to the finer levels of serious injury. To address this issue, we employed Fisher optimal partition to classify roadside crash severity into appropriate number of levels and determine the ASI threshold values that delineate these levels. The results of the Fisher partition algorithm indicate that dividing roadside crash severity into four levels is optimal for the purpose of this study, as illustrated in Figure 10, which is consistent with the “Chinese Guideline for Implementation of Highway Safety Enhancement Project.” 27
The ASI-based method does have an important stipulation that the ASI values of all possible vehicle–object crashes, in which all types of vehicles impacting with all types of roadside objects at different angles and velocities, should be obtained by crash tests. To that end, this study built 21 vehicle-object crash simulation models using 3 vehicle types, 7 roadside object types, 3 impact velocity values, and a fixed impact angle of 20°, based on the comprehensive investigations on 1917 km of secondary roadways in four provinces in China. The study also included another 38 simulation-based crash tests of vehicles crashing into steep embankment of 2, 4, 8, and 10 m in height and of slope gradients of 1:0 (vertical), 1:1, and 1:2. While embankments of such extremely steep slopes may be inadvisable and rare in the United States, they are relatively common infrastructure in China, which justifies the necessity and importance of this study.
Footnotes
Acknowledgements
The authors express their thanks to all who participated in this research for their cooperation.
Handling Editor: Jiangchen Li
Declaration of conflicting interests
The author(s) declared no potential conflicts of interest with respect to the research, authorship, and/or publication of this article.
Funding
The author(s) disclosed receipt of the following financial support for the research, authorship, and/or publication of this article: This research was funded by National Natural Science Foundation of China (No.51678076) and Hunan Key Laboratory of Smart Roadway and Cooperative Vehicle-infrastructure Systems (No.2017TP1016).