
Abstract
One of the main tasks of adaptive gearshift decision-making is to recognize the driving intention, which reflects the adaptability of the vehicle to the driver. This article proposes a method of classification and recognition to recognize this kind of intention, which based on an improved Gustafson–Kessel clustering analysis, and constructs the corresponding fuzzy recognition system based on the method of extracting the fuzzy rules of the driving intention from classification results. Driving intention recognition results as the driver power demand factor, which is the basis of adaptive gearshift decision for the vehicle to adapt to the driving intention, which reflects the driver’s demand for vehicle power. Based on the factor, by using the method of interpolation between economy and power shift line, making gearshift decision is adaptive of driver’s intention. In the end, through the real vehicle experiment, it is proved that the method can effectively recognize the driving intention and the adaptability of the decision.
Keywords
Introduction
The core of gearshift decision is how to determine the driving status of the car according to driving environment and driver’s operation. The engineered adaptive gearshift decision system will formulate corresponding shift schedules based on the recognition of the driving environment and driver’s operation to correct the shift point so as to meet the driving environment and driving operation. The recognition of the driving environment is generally reflected as the load of the vehicle, which can meet the needs of adaptation under static driving conditions.1,2 However, in the normal driving condition of the vehicle, the driver is one of the most unstable factors. If the real-time intention of the driver is misunderstood, problems such as wrong shifting and cyclical shifting occur. For example, when the vehicle is driving in a low gear, it is often judged as economical if the driver’s power demand is not large. In shifting, the driver may increase the throttle due to insufficient power to cause a cyclic shift, so adaptation to the driver’s intention becomes the key to intelligent decision-making.
Fuzzy inference can transform human’s experience and knowledge into fuzzy rules, which has the advantages of simple design, easy understanding, and so on. It is a common recognition method of driving style and intention. The use of fuzzy inference for the optimization of shift decisions is a very common and stable engineering application.3–6 The fuzzy rules of driving intention recognition are mainly based on the expert’s knowledge and experience as well as the observation, statistics, and analysis of the driver’s manipulation. Moreover, the initial design of fuzzy rules usually requires continuous experimental verification, modification, and optimization. The rationality of the rule base is affected by human factors. Artificial intelligence algorithm has become a hot point of driver intention recognition. Intelligent algorithms can objectively express the driver’s complex intentions. Artificial neural networks and hidden Markov model are two commonly used methods. Artificial neural network can express complex behavior based on data inference mapping function,7,8 and hidden Markov model can infer hidden states based on probabilistic models and has good processing power for time series with dynamic properties.9,10 However, their performance will vary significantly based on the training data provided and precise probabilistic inferences need to be matched with advanced incremental techniques to meet long- and short-term changing human behavior. At present, this kind of technology is not enough for engineering. Another issue that is getting more and more attention is that the decision basis obtained by directly applying these artificial intelligence algorithms cannot be clearly expressed. In essence, the recognition of driver’s intention is a process of pattern recognition. The clustering algorithm needs a smaller amount of data than the above-mentioned intelligent algorithm, which can ensure the stability of the accuracy. This is an advantage for engineering applications. Due to the soft classification nature of driving operations, Fuzzy C-Means (FCM)is a suitable method.11,12 Gustafson–Kessel (GK) algorithm is an improved algorithm based on FCM13,14 which can effectively eliminate the influence of outliers and is very suitable for such behaviors as drivers.
Based on the improved GK clustering algorithm, this article analyzes the driver’s intention of driving demand, determines the fuzzy recognition rules based on the driver’s intention clustering results, and eliminates the disadvantages of the excessively large artificial factors of the fuzzy rules. The decision-making can also provide a clear basis for decision-making. Combining the proposed driver’s long-term driving recognition, 15 the result is integrated into the driver’s power demand factor to comprehensively reflect the driver’s demand for the vehicle’s power, and then the adaptive gearshift decision based on the driver’s power demand factor is proposed. The method can provide clear decision-making basis while giving intelligent decision-making.
Driving intention recognition process based on clustering analysis
Fuzzy inference recognition is a common method of driving intention recognition. The fuzzy rule base determines the performance of the fuzzy system. However, the fuzzy rules of fuzzy inference are often based on the experience of designers and drivers, so the rules are not objective enough, the expert experience is difficult to obtain, and so on.
As shown in Figure 1, in this article, a fuzzy rule extraction method based on fuzzy clustering analysis is used to construct the driving intention fuzzy recognition system. Utilizing the data samples obtained from the real vehicle road test, the GK fuzzy clustering algorithm is used to classify the driver’s driving intention, and then the fuzzy rules are extracted based on the clustering results, and the fuzzy recognition system of driving intention is constructed. This method can directly produce fuzzy rules from data and can eliminate the problem of incomplete and unreasonable rules caused by artificial fuzzy rules, so that the fuzzy rule base is more in line with the actual situation.
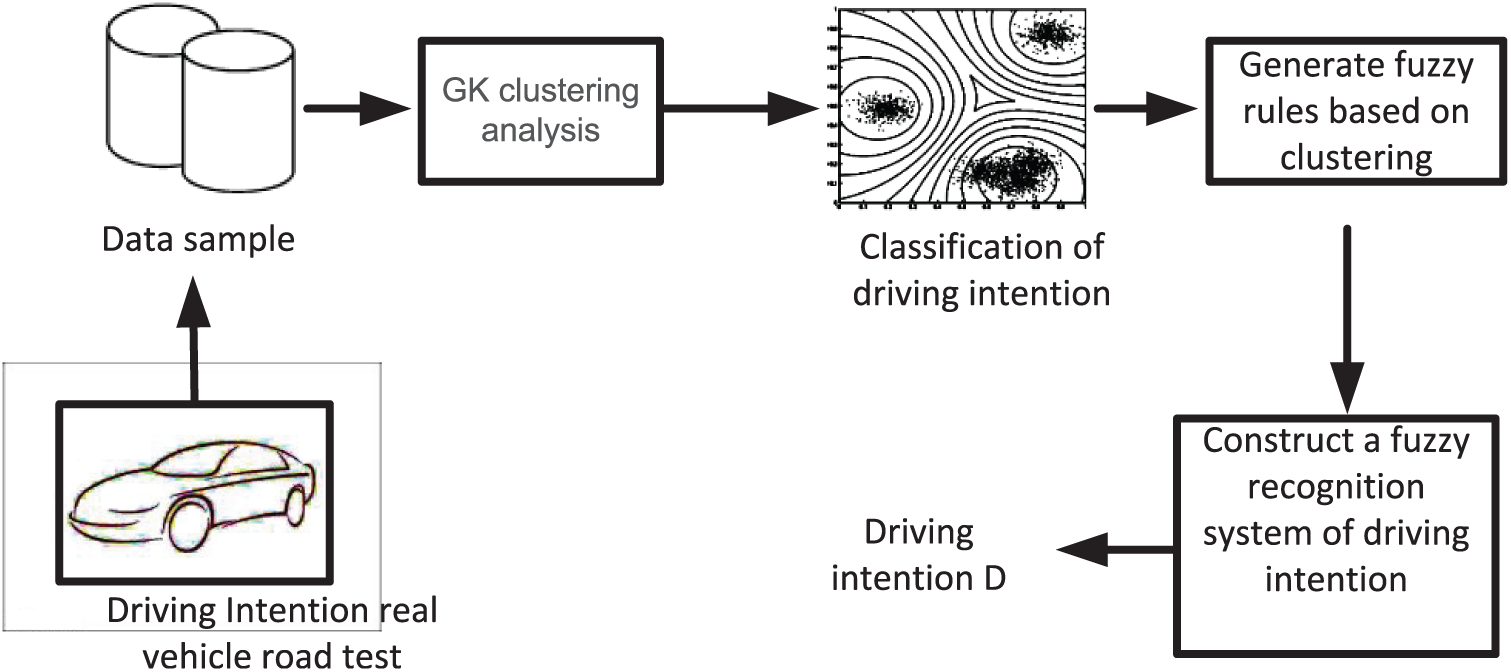
Recognition process of driving intention based on clustering analysis.
GK clustering analysis
In this article, an improved GK clustering algorithm, which is put forward in the literature, 16 was taken to classify driving intention. After the actual application is compared with several other clustering algorithms, GK clustering algorithm can effectively eliminate the influence of sample outliers and noises on the clustering results.
GK clustering algorithm
Improved GK clustering algorithm has solved the covariance matrix calculation problem caused by the linear correlation between small sample data and the within class data. In addition, optimizing the whole recognition process for GK clustering algorithm applied to the Takagi–Sugeno fuzzy model, the iterative calculation proceed as follows.
Setting Z is the effective data collection to be clustered,
The objective function

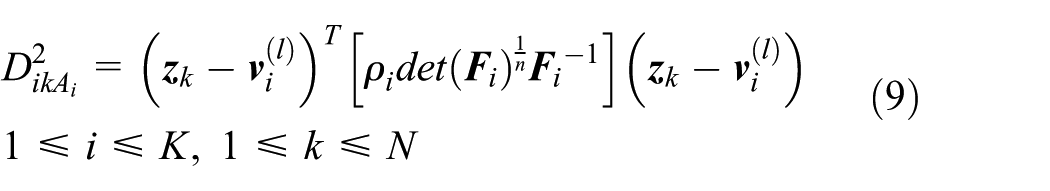
The distance norm is

In the formula,
By Lagrange, the (U, V) condition is


For the clustering sample collection Z, set the cluster number K, tolerance
The first step: calculate the cluster center

Second step, calculate the covariance matrix

Add a scaling matrix

Extract eigenvalue

Rebuilt
Third step, calculate the distance norm
Fourth step: update partition matrix
for
if

Else if
Repeat above steps, until
The result of the GK clustering is a fuzzy partition matrix, which can be transformed into a hard partition matrix (hardening) by using the principle that is nearest from clustering center or the principle of maximum membership degree. In this article, use the principle of maximum membership degree.
Clustering validity test
FCM clustering and GK clustering cannot automatically determine the optimal clustering class number C, which needs manual determination, and the different clustering class number has a great impact on the clustering results. Different scholars put forward a series of clustering validity index to test the result of clustering under different number of clusters to determine the optimal number of clustering,17,18 for example:
The index partition coefficient (PC) and classification enropy (CE) characterize the overlap and the degree of fuzziness of the classification results. The results are better with the bigger PC and the smaller CE, but the two indexes have the defects of monotone optimal with the increasing number of clustering;
The index partition (SC), index separation (S), and index Xie-Beni (XB) characterize the compactness and the degree of separation of the classification results. The clustering results are better with the smaller value. And index XB 19 takes into account the separation degree and the compactness degree between different classes, the clustering results are better with the smaller value. It is an index with the good performance by the actual test, which is used widely. S and SC have the same defects with PC and CE;
The index Dunn Index (DI) and Alternative Dunn Index (ADI) characterize the compactness of the intra- and inter-class separation performance of the clustering results, mainly used for hard clustering, and the clustering results are better with the smaller value.
Data standardization
During the actual process of clustering, the characteristic parameters of each sample are usually different. Usually, we need to do the normalization of the data to the interval [0,1], so as to make different characteristic quantity with different dimension to take part in clustering. We use translation standard deviation in this passage with the below formula

where
Classification of driving intention based on clustering analysis
Driving intention can be reflected by the characteristics of driver’s operation, such as throttle opening, the throttle opening change rate, the frequency of braking, the strength of braking, steering wheel angle and its rate of change, and so on. In this article, the classification and recognition of driving intention is based on the point of the driver’s power demand norm driving on flat road of the vehicle. Therefore, we choose throttle, the throttle opening change rate, and vehicle speed as the characteristic quantity of driving intention. And the braking and the negative rate of throttle opening change represent the power demand, which is 0 or negative. Hence, we acquiesce that the results of the driving intention is 0 during the process of recognition.
The cluster samples come from the data of driving intention test, including six drivers, a total of 15 h and 20 min. We set the data sampling rate as 150 ms, and remove the time of shifting, braking, and negative rate of change of throttle opening. We finally get 39,624 samples.
After the samples are transformed into the standard deviation, we mainly use the index of XB and refer to the method of the index PC and S to confirm the number of clusters. Figure 2 is the index value of the cluster number 2–14. According to this figure, first according to the XB, we determine the number of clusters C to be 2–5, observed PC in 2, 4, 5 when better, S increases monotonically with the number of clusters, but we do not consider it. And then combined with the actual clustering results, we find that when C is 2, we can classify the driving intention well, so we choose 2 for C.

Checkout index of different clustering number.
Figure 3 is the result when clustering number is 2. Analysis shows that the first class of throttle rate scope is bigger, and the second class of change rate is small. It shows that the clustering is based on the principle of the stability of the throttle change rate.
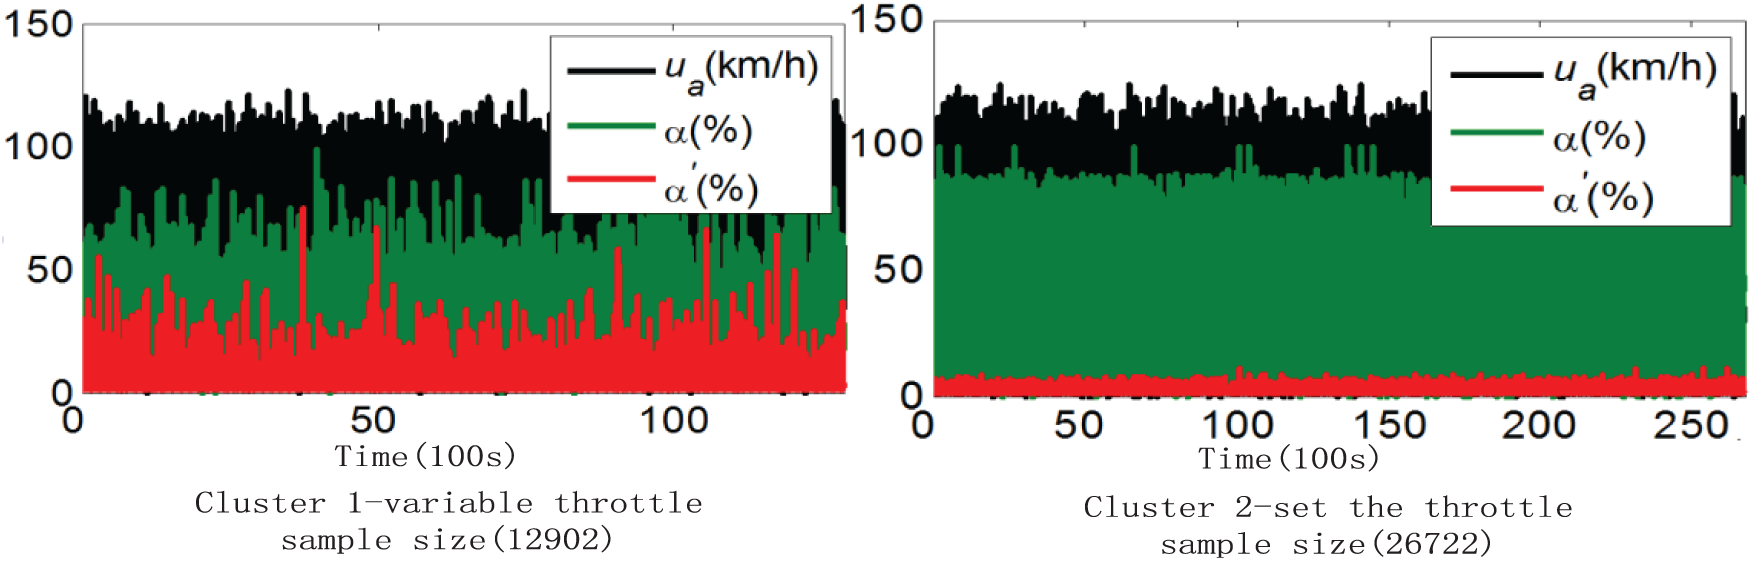
Driving intention clustering results for the first time.
The above classification is the rough classification of samples, and according to the former method, cluster 1 is finally clustered into seven clusters and cluster 2 into five clusters, finally all samples are clustered into 12 clusters. Figure 4 is the results of these clusters that are arranged according to the vehicle speed.

The final result of clustering of each driving style (1–12).
Table 1 is the analysis results of the clusters that combined the clustering results and statistical data and synthesized practical driving information. This table is the basis for the generation of fuzzy rules.
Analysis results of driving intention clustering.
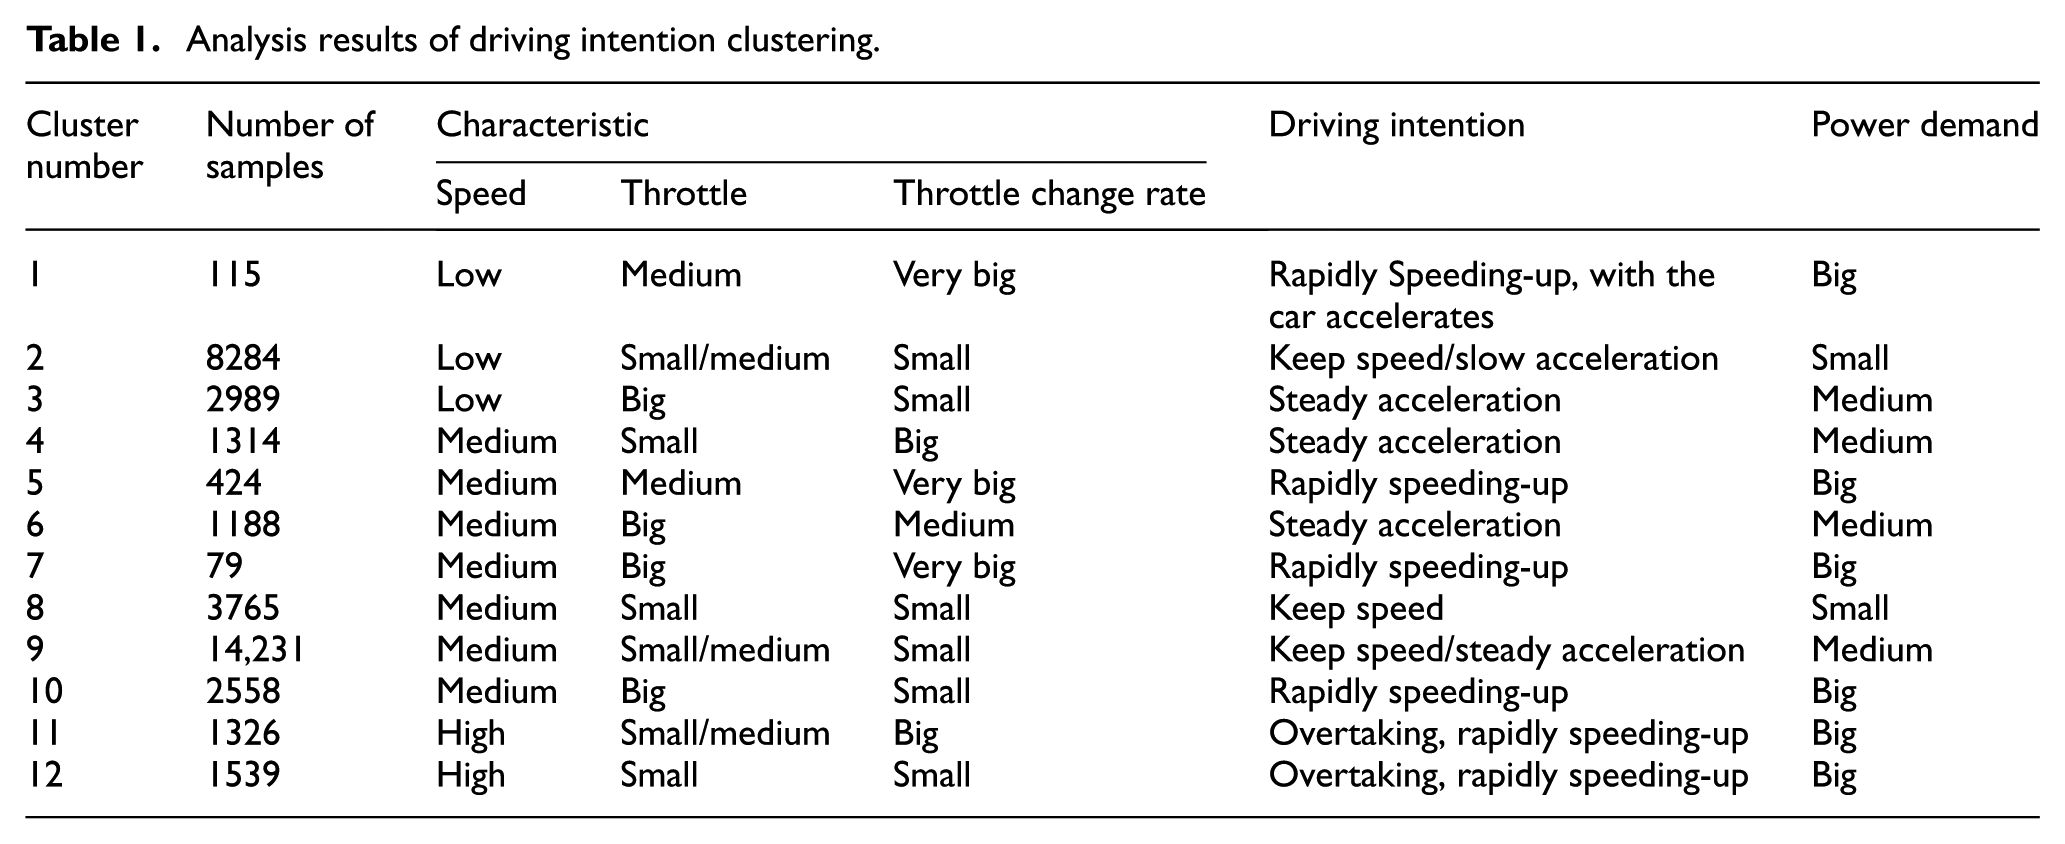
The test vehicle is a subcompact. In this table, according to the vehicle and the actual road test analysis, the vehicle speed is divided in accordance with the 40, 60, and 80 (km/h) roughly into low, medium, and high ranges; and the throttle opening is divided in accordance with the 30%, 50%, 70% roughly into small, medium, and big ranges. The throttle opening change rate (mainly concentrated in the range 0–40) is divided in accordance with the 3, 6, 10, and 20 roughly into small, medium, big, and very big range. Each class of the corresponding power demand is divided into big, medium, and small. The table shows the second and ninth classes in order to keep and slow acceleration that are mostly which accords with the situation in the process of actual driving.
Automatic extraction of fuzzy rules of driving intention based on cluster analysis
The fuzzy recognition system of driving intention is showed in Figure 5. Speed, throttle opening and the throttle change rate are handled, then Mamdani’s inference method is used to do the inferential decision, then the center of gravity method is used to get the power demand factor D.

The fuzzy recognition system of driving intention based on fuzzy inference.
The step of generating fuzzy rules based on clustering analysis is as follows:
Using the clustering algorithm to cluster the sample set which is obtained by driving intention real vehicle experiment to obtain the driving intention under different conditions.
A corresponding fuzzy rule is designed for each classifier.
The membership function of each rule is generated by using the statistical histogram.
The set of these fuzzy rules is the final fuzzy rule base.
Acquisition of fuzzy rules
Fuzzy rule generation based on expert experience need to artificially complete the language variable selection, classification, and domain division. There exist great randomness, and the final performance of the fuzzy system depends on the designer’s experience. Fuzzy rule generation based on GK clustering analysis can complete this work automatically. Clustering results is an automatic partition of the sample space, while each partition corresponds to a fuzzy rule. As shown in Table 2, each row of clustering results is a fuzzy rule, taking cluster 11 (high-speed overtaking intent) as an example, a fuzzy rule can be obtained:
The type and characteristic parameters of membership function of fuzzy rule antecedent.

Rule 11: If <speed high> and <the throttle opening small/medium> and <throttle change rate is high> then <high power demand>;
Among them, the vehicle speed, the throttle opening, the throttle change rate are the language variable, low, small/medium, and high are the language variable values. It notes that Language value small/medium is different from that of the traditional language variable, and its corresponding domain remains a single cluster sample space. Thus, 12 fuzzy rules can be obtained.
Antecedent membership function
The selection of membership function is one of the key tasks in designing a fuzzy logic system. The selection of membership function needed to consider the generation and adjustment of fuzzy rules is simple, easy to implement, and improves the recognition rate. In this article, using the sample data of each dimension characteristic of each cluster, through drawing statistical histogram, the majority of the membership function of each characteristics is transformed into a triangle form, and the rest is converted into a trapezoidal form. Triangular membership function is expressed as

In the formula, a, b, c, respectively, are the minimum value of the triangular membership function, the corresponding value of the membership degrees 1, and the maximum value. The trapezoid membership function can be regarded as the synthesis of triangle function and Don’t Care membership function. The following still takes Clustering 11 overtaking intent as an example to explain this rule of the membership functions of the generation process, as shown in Figure 6.
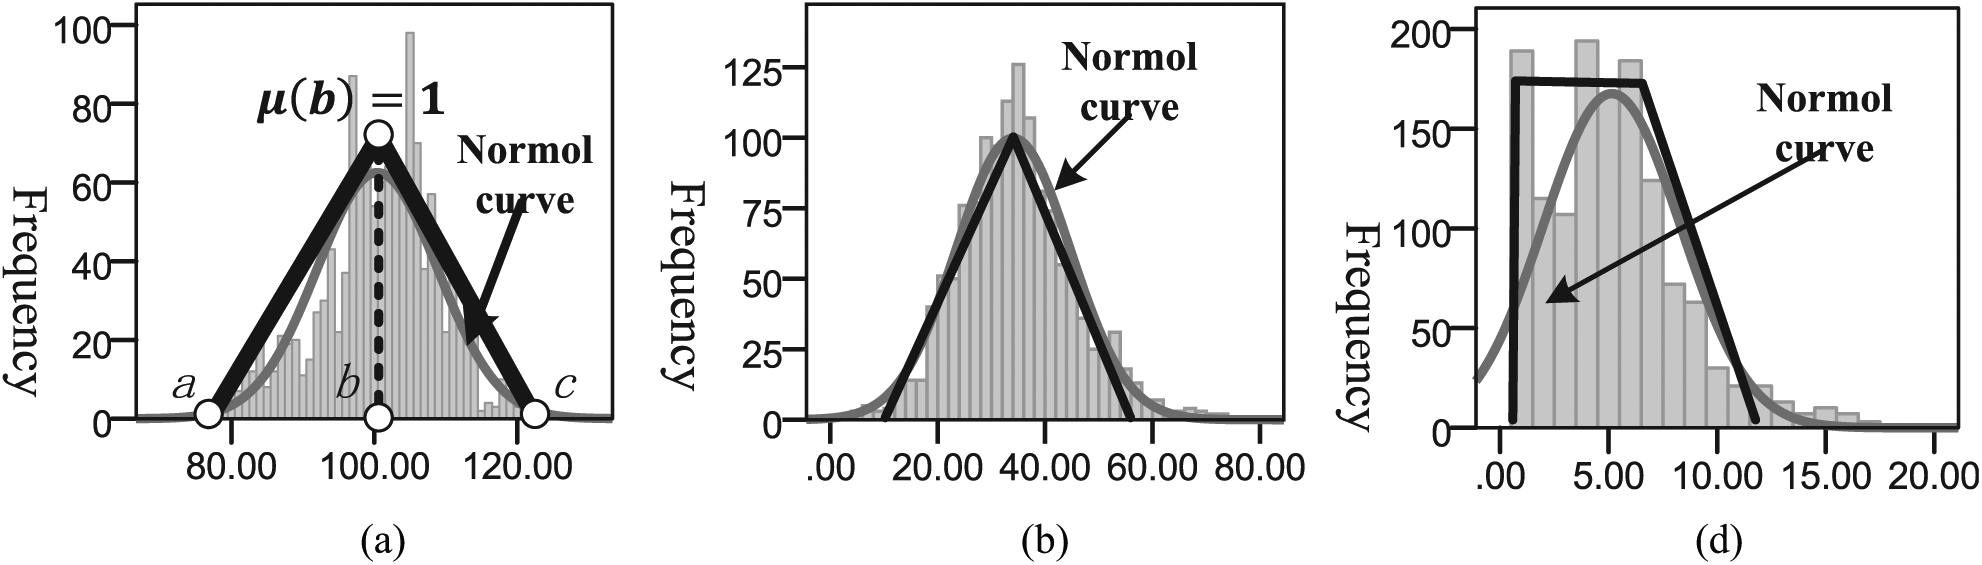
Membership function generation based on statistical histogram: (a) vehicle speed, (b) the throttle, and (c) the throttle opening change.
In the figure, statistical histogram shows the occurrence times of each data point in the sample space of each characteristic in the cluster, the greater the frequency of the point indicates that the greater the proportion in this class, the more attention should be paid. While the purpose that the membership degree transformation is using the triangle or trapezoid envelope histogram, making it conform to frequency trend of each data point. In the figure, drawing each feature quantity of normal distribution curve at the same time, it can be seen that the vehicle speed and throttle opening accord with normal Gaussian function distribution, and the triangular membership degree function is a simplification of the Gauss function. In the vehicle speed histogram, a, b, and c points, respectively, mark the point of triangular function characteristic parameter values in the sample space (78,100,122). Membership degree function of the throttle change rate is trapezoidal.
According to this method, we can get the antecedent membership functions of other 11 rules. Table 2 consists each rule-generated form and characteristic parameters.
Consequent membership function of structure
From the Clustering analysis results of Table 2, we can know that the consequent of each rule what is named the power demand level is divided into big, medium, and small, which are corresponding to the sport type, medium type, and economic type, and its domain is [0–100], then the membership functions can be designed according to the equal interval. As the center-of-gravity method is used to perform the defuzzification, the membership function can be used in the form of a single point function, as shown in Figure 7.

Membership functions of D.
Fuzzy rule synthesis output
The set of the fuzzy rules is fuzzy rule base, and the center-of-gravity method is used to realize the fuzzy output, and the formula is as follows

where n is the rule number,
Gearshift decision-making based on the result of driving intention recognition
Driving intention is essentially an intentional correction of the degree of power demand. From the actual situation, this intention is more intentional in the positive demand, and it has a certain short-term nature. The focus of this article is the positive change of the throttle. Negative demand tends to adapt to a longer driving style under most conditions.
Lei et al.
2
have studied the driver’s long-term driving style based on the driver’s quantification factor and use the exponential smoothing prediction technology to predict the long-term driving style. The driver’s quantization factor

where
Long-term style

where
This article combines long- and short-term factors to give the drivers power demand factor. The final output of the driving intention recognition results is [0,100]. So also normalize

where
The final driver power demand factor is defined as

In order to make the output change intervals consistent, the weights
Figure 8 shows the driving intention recognition and shift point optimization methods. In the figure, according to the size of the power factor, shift point correction function based on driver power demand factor to correct the shift point by interpolation between the flat road power shift line and the economic shift line, implementation of adaptive driver. The formula is
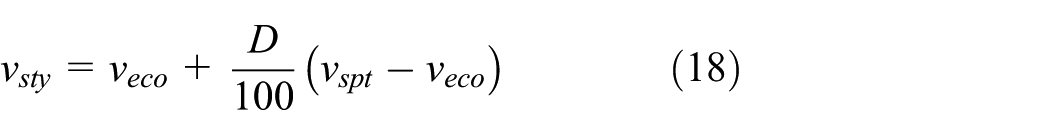
where

Driving intention recognition and shift line optimization process.
The recognition model runs continuously, estimating at each time step t (150 ms), and needs to first detect whether the rate of change of throttle is a positive change. When the rate of change of the throttle is a negative change,
Driving intention comprehensive recognition experiment
Driving intention recognition test can verify the driving intention recognition algorithm and the driver’s power demand factor recognition effect, respectively, the driving intention identification test of common path acceleration and high-speed road overtaking is carried out. In order to make a comparison, the article gives the basic driving load resistance according to literature, 2 as shown in Figures 9 and 10.

Synthetic recognition results of driving intention in accelerating condition.

Comprehensive recognition results of driving intention in overtaking condition.
In Figure 9, due to the driver’s large accelerator operation, the driver’s power demand factor D, with the driver accelerator operation increased or decreased, fully reflects the driver’s acceleration.
In Figure 10, the driver has a number of overtaking behavior on the highway. In order to reflect the instantaneous power demand of the driver, the driver’s power demand factor D changes with the driver’s accelerator operation.
Gearshift decision comprehensive flat road experiment
Figure 11 shows the data of flat road test in urban drive condition. During the experiment, the driver has a number of quick off-throttle, slow off-throttle, deep, and slow step on the throttle. The result of driving intention recognition, the throttle operation of the driver, and the adaptive gearshift decision-making process are drawn. Known to the picture:
When vehicles running on the flat road, the gearshift decision-making process is focused on shift line correction that based on driver power demand factor, which can reflect the adaptability of decision-making process to driving intention.
During this driving process, there are several intersections between economic shift line and vehicle speed curve (i.e. the basic shift point). If only using this gearshift rule to do gear-position decision, it will lead to frequent gearshift. With the driver’s power demand factor as the main shift, there are two cross points between the final shift line and the vehicle speed. This shifting point is mainly the result of the adaptive decision system of the gear-position decision system.
The higher the driver’s power demand factor is, the adaptive shift is closer to the moving type gearshift line, and at this time, decision-making is to give full play in order to play the main power of the whole vehicle. When the demand factor is low, the adaptive shift is closer to the economic shift line, and at this time, the decision is to give full play to the economy of the whole vehicle. Therefore, based on the driver’s power demand factor, correction method is to meet the driver’s power demand as the principle, and the power that does not provide the driving force of overtaking drivers can improve the economic performance of the vehicle.

Comprehensive flat road test results.
The experimental results show: the comprehensive road test on flat road use a gear-position decision method that is based on driver power demand that can meet the different needs of drivers for vehicle power and economy, with the adaptive performance of drivers.
Conclusion
Based on the GK clustering analysis of driving intention, this article studies the method of fuzzy rule extraction and recognition of driving intention based on classified samples. A shift line adaptive correction method based on the driver’s power demand factor is proposed to satisfy the dynamic demand of the driver’s driving intention. GK clustering analysis technology can realize the driving intention automatic classification, and automatic extraction method of fuzzy recognition rules for driving intention based on the result of the GK clustering analysis can avoid the problem of incomplete rules and conflict in the artificial construction of the rule base. The driver power demand factor based on the driving intention recognition results reflect the driver’s demand for the current vehicle power, and the shift line correction method based on the driver’s power demand factor has the adaptability to the driver.
Footnotes
Handling Editor: Fakher Chaari
Declaration of conflicting interests
The author(s) declared no potential conflicts of interest with respect to the research, authorship, and/or publication of this article.
Funding
The author(s) disclosed receipt of the following financial support for the research, authorship, and/or publication of this article: This research was supported by the National Natural Science Foundation Project of China (grant no.: 51575220), the International S&T Cooperation Program of China (grant no.: 2014DFA71790), the Key Scientific and Technological Project of Jilin Province (grant no.: 20130204023GX), and the Doctoral Fund of Ministry of Education of China (grant no.: 20120061110027).