
Abstract
Gurney flap is a miniature lift-enhancement device installed at the airfoil trailing edge and has been successfully applied to fixed wing aircraft and low-speed horizontal wind turbines. In this article, Gurney flap is extended to increase pressure output of a diffusive cascade flow in rotating turbomachinery, which is complicated for its three dimensionalities and diffusive separation characteristics. Wind tunnel tests and computational fluid dynamic simulations were accomplished on an axial fan profiled with an NACA 65-(12)10 airfoil to investigate the effects of Gurney flap on the performance of a high solidity. We present the detailed flow features of the fan with and without Gurney flap after validating the simulation results with the experimental datum. The experimental results show positive Gurney flap effects on fan’s pressure rise and flow rate improvement. However, negative Gurney flap effects on fan’s efficiency are more evident than Gurney flap on isolated airfoils. Detailed flow field analysis from computational fluid dynamic computation reveals that the increased airfoil pressure loading along the fan blade chord strengthens the tip leakage flow, which induces more tip second flow losses than in the baseline fan. In addition to the positive lift enhancement, the net Gurney flap effect in diffusion cascade is influenced by the three-dimensional flow structure.
Keywords
Introduction
Gurney flap (GF) was invented by a race car driver Dan Gurney in 1960. It is a small lift-enhancement device which is usually mounted close to or at the airfoil trailing edge. Liebeck 1 found a GF with a height of 2% airfoil chord (2%C) can increase the maximum lift coefficient by 21% and lift-to-drag ratio by 35% on an NACA0012 airfoil. The lift-enhancement mechanism stated by Liebeck is shown in Figure 1. A short separation region of increased pressure is formed upstream of the GF. Two counter-rotating vortices appear downstream of the flap. The flow turning at the trailing edge is increased, which is equivalent to increase the airfoil camber, resulting in an increased lift. Greenblatt 2 proposed a semi-empirical analysis of GF effects and predicted lift and drag with respect to GF height and airfoil chord. Because of its simple structure, easy manufacture, and cost-effectiveness, the GF has attracted a lot of aerodynamic researchers in fixed wing and rotorcrafts. Lots of researches have focused on the utilization of a GF on isolated airfoils, multi-element airfoils, and aircraft wings. Flap shapes have revealed positive effects on airfoil lift for various applications.

Schematic showing the physical effect of the Gurney flap on the trailing-edge region.
Wang et al. 3 studied the influence of the GF mounting locations on the performance of an NACA0012 airfoil. GFs were mounted at 0%, 2%, 4%, and 6% of the airfoil chord upstream of the trailing edge, respectively. Results showed that the increment of the lift coefficient decreased when the GF was moved forward to the leading edge. The mounting angle was also studied by Traub et al. 4 They found that a perpendicular GF generated the lowest lift-to-drag ratio. Inclined GFs at 45° and 60° produced the maximum lift-to-drag ratio.
Traub and Galls 5 examined in a wind tunnel the GF’s dependence on selected geometric parameters. Results suggested that the lift augmentation of their GFs varied linearly with the flap height, porosity, and the projected height normal to the surface. He et al. 6 studied six traditional plain GFs with heights ranging from 1%C to 5%C on SFYT15 thick airfoil. They found that the larger the GF height, the more evident the lift enhancement would be.
Amini et al. 7 pointed out that although GF can enhance lift, it increased drag simultaneously. Adjoint shape optimization was used to optimize GF shape to control the unfavorable effects on the drag coefficient. Final GF airfoil maintained the lift coefficient and improved the lift-to-drag ratio performance. A special configuration of saw-toothed GF8,9 for an isolated airfoil was investigated and shown to improve the lift coefficient and reduce the drag coefficient. That was attributed to a reduction in the effective windward area. Xie et al. 10 utilized a new type of GF on NACA0012 airfoil, which showed significant increase in energy extraction coefficient and efficiency. They also found an alternatively shed Karman vortex street behind the airfoil, which reduces the adverse pressure gradient near the trailing edge and increases the velocity over the suction surface, resulting in a delay in flow separation and decrease of pressure over there.
GF effectiveness is complicated with not only its own shape but also the characteristics of airfoil on which it is mounted. Cole et al. 11 found that the GF effectiveness was strongly influenced by airfoil shape. Traub and Chandrashekar 12 examined the effect of wing sweep on the aerodynamic characteristics of GF. Their data indicated that the effect of sweep was primarily to attenuate the lift augmentation capability of the GF, with a dependency on the cosine function of the leading edge sweep angle. Zhan and Wang 13 tested a delta wing with GFs and apex flaps. The experimental results indicated that the lift coefficient was improved for different angles of attack (AOA) for a delta wing with GFs and apex flaps. Zhu et al. 14 used an adaptive GF on a flap wing and the results indicated that the adaptive GF improves the wing efficiency by increasing the heave force. Additional applications of the GF on wings can be found in the studies by Cavanaugh et al. 15 and Buchholz and Jin. 16
Aerodynamic GF effects on dual or multi-element airfoils or wings for aircraft applications have been reported. Storms and colleagues17,18 utilized 0.5% and 1% chord GF, respectively, on an NACA632-215(B) airfoil to increase the maximum lift coefficient by 10.3% when the deflection angle of the slotted flap was 42°. On a two-element GA(W)-2 airfoil, Myose and colleagues19,20 mounted 1% chord GFs at the trailing edges of both main and flap elements. It was found that the “flap GF” and “flap main GF” can enhance the lift coefficient, but the “main GF” reduced the lift coefficient compared to a “clean” airfoil.
Successful applications of GFs on an isolated airfoil, multi-element airfoil, or wings as well as the appealing features of simplicity, lift enhancement, and separation control have also given rise to the attention of experts in other fields, especially in the turbomachinery industry.
GF has been extended to rotors with blade sections of various airfoils. Gibertini et al. 21 investigated the performance of GFs on a helicopter rotor model in hovering and the experiment results showed an apparent benefit produced by GFs in terms of rotor performance with respect to the clean blade configuration. Ismail and Vijayaraghavan 22 utilized an optimized combination of GF and semi-circular inward dimple on a vertical axis wind turbine. Average tangential force was found to be increased by approximately 35% in steady-state case and 40% in oscillating case.
Byerley et al. 23 experimentally investigated the influence of the GF on the location and size of the laminar separation bubble on turbine blades in a linear cascade. The testing data showed that the lift generated by the blade was increased and that the GF also produced a larger wake. It was suggested that GFs might possibly be implemented in a semi-passive manner. They could be deployed for a low Reynolds number operation and then retracted at high Reynolds numbers when separation is not present. Janus 24 conducted numerical and experimental analyses of the size effect of the GF on the performance of a cascade. Two baseline geometries with varied GFs were tested: one had a sharp trailing edge and the other had a round trailing edge. The results suggested that the flap size should be limited to between 1%C and 1.5%C.
The above cascade studies based on the cascades do not consider the effects of rotation. The lack of centrifugal and Coriolis forces that are inherent to a rotating fan raises questions as to what extent the cascade results are transferable to a rotating environment. Greenblatt 2 and Mudassir and Quamber 25 reported studies on the effect of GF on aerodynamic performance of rotating diffusive flows. Extraordinary large GF heights of 10%C, 20%C, and 30%C were tested on a fan facility by Greenblatt. 2 It was found that blades with GFs produced higher pressures than those without GFs. A GF of 10%C increased the static efficiency by 18%. A GF of 30%C created large volumetric flow rates and reduced the sound pressure level by 4 dB. Numerical studies have been carried out on the effectiveness of trailing-edge GF with varying depth and spanwise length on an axial compressor rotor by Mudassir and Quamber. 25 The results showed that high blade loading with GF was responsible for lower stall margin. In addition, the formation of trailing end vortex structure resulted in bending of the streamlines toward suction surface of the rotor blade, with reduction in flow deviation and increased flow deflection, and hence increased total pressure ratio.
As indicated by the abovementioned literature survey, effect of GFs on stationary one-element airfoils, multi-element airfoils, and wings has been extensively investigated. In comparison, there have been few studies of GF applications on axial fans. The application of GFs seems to be a promising approach to improve the performance of axial fans since fan blade sections are similar lift generating device as airfoils. However, axial fan is a rotor of multi-airfoil cascade configuration in which solidity plays an important role on its performance. Greenblatt’s 2 fan has only two blades and neglects the solidity effect. In this article, an axial fan model of 19 blades is designed to investigate the GF effects on the performance of axial fan. Efforts will be focused on understanding the GF effects on the diffusive flow in an airfoil contoured channel. Experiments are organized to provide fan’s performance chart. Pressure coefficient, total pressure efficiency (TPE), and static pressure efficiency (SPE) of the clean fan and axial fans with varied plate GFs are tested first. Then, computational fluid dynamic (CFD) computations provide internal flow fields with and without GFs and are validated in comparison with experiment data. The flow features of a fan with GFs, especially the clearance flow on the blade tips and the extra losses caused by the GF, have been studied. CFD results give insights of flow control mechanism and a theoretical foundation for further application optimization on axial fans.
Experimental setup
Testing facility
Fan performance tests were carried out in a suction-type testing chamber. The testing rig shown in Figure 2 was built in compliance with the Chinese national standard for fan performance measurement (GB/T1236-2000), which is an equivalent of AMCA 210-74. The fan’s inlet flow quality in the plenum is guaranteed. Beyond a velocity of 10 m/s, the variation in the total pressure and static pressure field is less than 0.1% and 0.3%, respectively, while the maximum deflection of the flow angle is below ±0.2 degree, and the turbulence intensity is less than 0.5% in the test section.

Testing rig for the fan.
The test rig is composed of four parts (long entrance duct, diffusion nozzle, plenum, and exhaust duct). The lengths of these four parts are approximately 3580, 587, 1600, and 370 mm, respectively. The diameter of the long duct is approximately 498 mm, and the diameter of the plenum is approximately 1240 mm. At the inlet of the long entrance duct, a standard constriction nozzle is used to measure the mass flow rate
The testing fan is installed inside the exhaust duct, as shown in Figure 3. The exhaust duct consists of four parts (inlet collector, hub fairing, fan rotor, and motor cartridge). With this design, the tested fan rotor can be changed for alternative GF shapes. The exhaust duct was manufactured using a computerized numerical control (CNC) machine. For ease of manufacturing and to achieve a high mechanical strength, acrylonitrile–butadiene–styrene (ABS) was chosen as the material for the exhaust duct.

Simulated duct.
Fan models
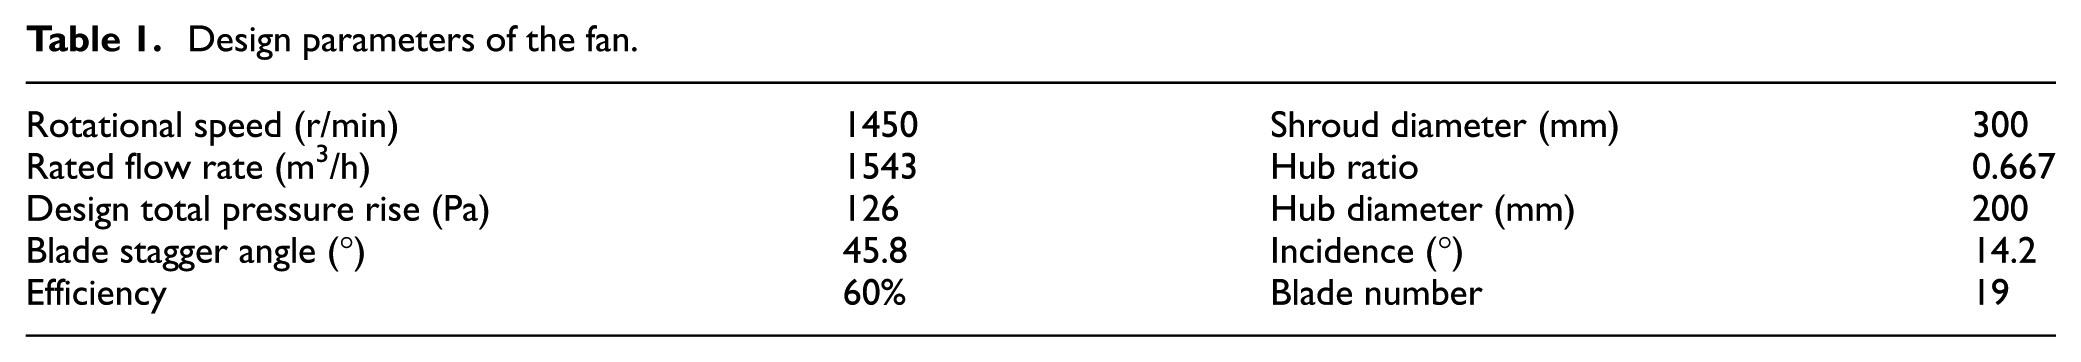
One prototype fan and three fans with GFs are tested in this article. They are axial fans with 19 straight blades and have a low aspect ratio. This type of fan is commonly used for room ventilation and air-conditioning systems. Generally, fans with GFs have the same geometrical sizes as the prototype fan. The mean section airfoil of the fan blades is an NACA 65-(12)10 airfoil with a height of 49 mm and a chord length of 41 mm. The diameter of the shroud and hub is
Design parameters of the fan.
We add the GF directly to the trailing edge of the blade of the prototype fan to form an axial fan with a GF. Three flaps of different heights 1.25%, 2.5%, and 5% of chord length are studied, which means that the heights of the GFs are 0.50, 1.00, and 2.00 mm, respectively. This dimension is too small to be precisely machined by CNC tooling. Therefore, a special type of rubber tape was adopted to form the GFs. Figure 4 presents the real models of axial fans with 5%C height of GF and without GFs. The special rubber tape has different thicknesses, and we can choose an appropriate thickness to form the GFs.

(a) Prototype fan and (b) fan with GF (5%C height).
Data acquisition devices and reduction
Data acquisition
The data acquisition devices used are mainly a pressure transmitter, thermometer, hygrometer, tachometer, and torquemeter. At test beginning, the pressure, temperature, and humidity of the surrounding environment (
Detailed information about the data acquisition devices.
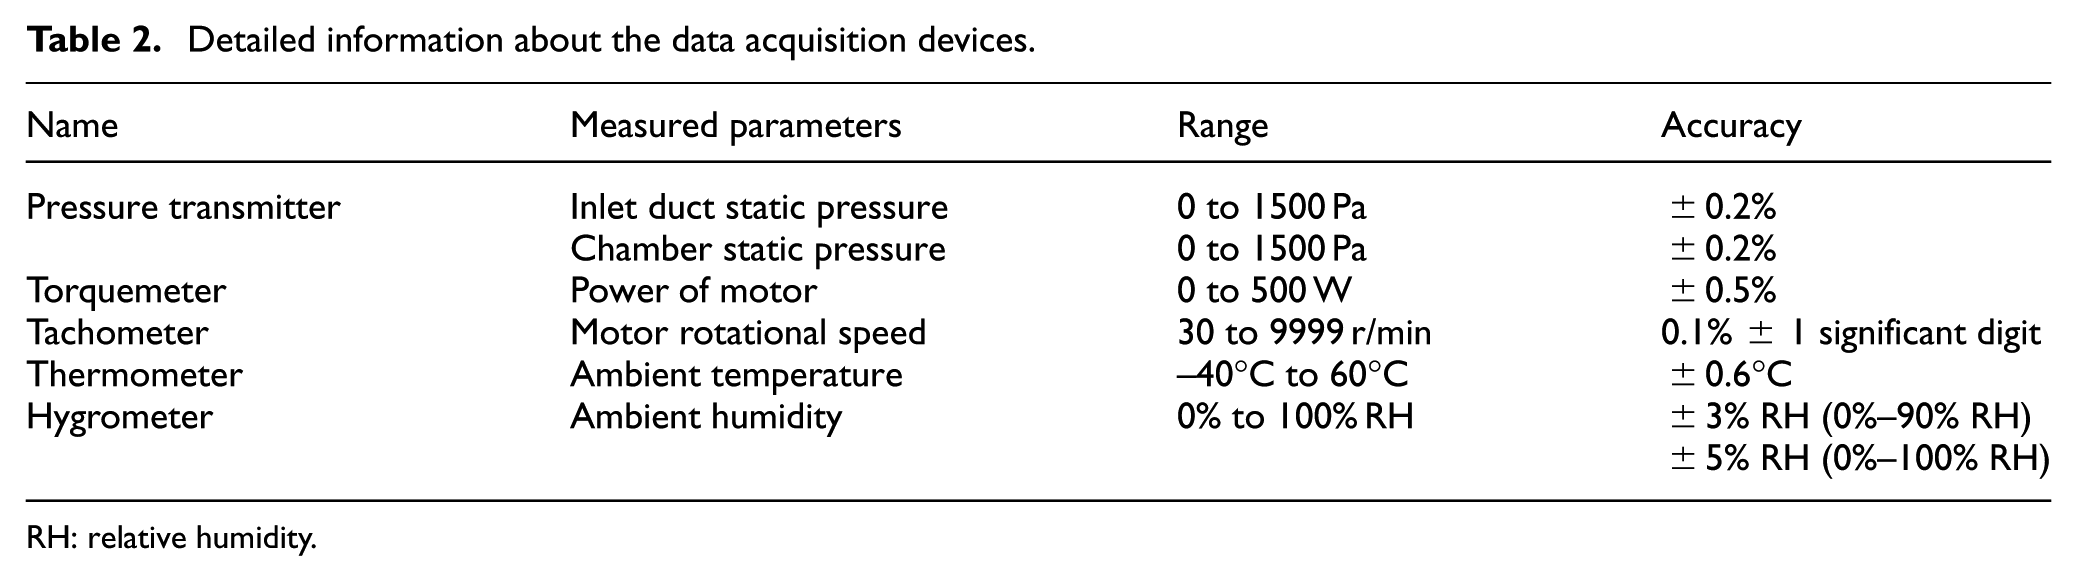
RH: relative humidity.
Data reduction
The purpose of fan test is to obtain a performance map, including the pressure rise, efficiency, and shaft power as a function of the flow rate and rotational speed. Data acquisition system provides the basic values of ambient conditions
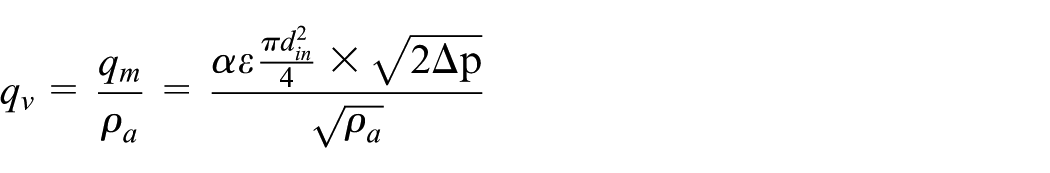
The mass flow rate can be calculated by the static pressure difference measure on the inlet bellmouth, which has a standard nozzle contour

where
Uncertainty analysis
According to error theory, measurement error is composed of system error, random error, and gross error. The experimental data in this article are mainly obtained by the data acquisition devices. The measurements of all of the working conditions are repeated several times by different test operators to eliminate the random errors and the gross error. Averaged values of different test data sets are used to calculate fan performance. Thus, the experimental error is focused on the system instrument error.
Uncertainties in the measured data are estimated according to the method in Moffat.
26
Given that the directly measured quantities are

If the direct measurement errors are

Comprehensive error can be expressed as

Gas constant


The error of the gas constant can be calculated by the following formula

2. Atmospheric density

The error of the atmospheric density can be calculated by the following formula

3. Volumetric flow rate
The error of the volume flow can be calculated by the following formula

4. Exhaust airflow density


The error of the exhaust airflow density can be calculated by the following formula

5. Total pressure of airflow

The error of the total pressure can be calculated by the following formula

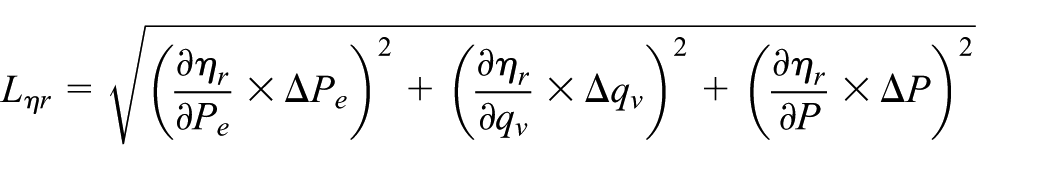
6. Efficiency of the fan
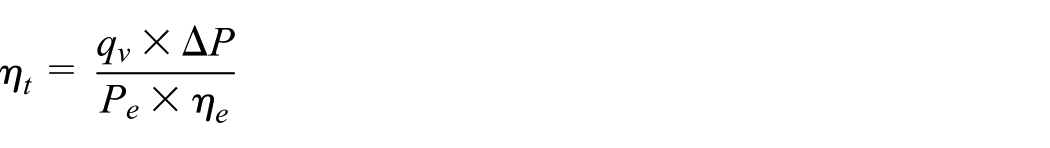
The error of the efficiency of the fan can be calculated by the following formula
The final results are shown in Table 3.
Error range of the calculation parameters.

Numerical method
Computational domain modeling
To keep boundary conditions with experiment settings as consistent as possible, we created a computational domain containing the upstream zone (plenum), axial fan, and downstream zone (ambient environment). The upstream and downstream zones are extended six times the diameter of the fan for better steady-flow conditions. The whole computational domain is shown in Figure 5. The GF size, especially the height, is relatively smaller than the size of the other parts. It is hard to resolve this small feature in a large computational domain to achieve a high-quality mesh. Popular ICEM software is adopted to generate the unstructured tetrahedral mesh. Boundary layers are paved on the solid wall surfaces of the blades, hub, and shroud to ensure that y-plus is close to 1 to resolve the near-wall flow properly. The mesh size is also refined in those areas that are close to the axial fan to properly capture large gradient variation of the pressure and velocity. The detailed mesh around the fan blade is shown in Figure 5.

Detailed mesh around the fan blade.
To confirm the requirements for computational accuracy are satisfied, mesh independence is verified using the original fan with five meshes of different grid sizes, as listed in Table 4. When the mesh number exceeds 1.9 million, the variations of total pressure rise and efficiency are negligible. Hence, a mesh number of 1.9 million is selected for this study. This total mesh number is divided into 0.3 million for the upstream domain, 1.3 million for the axial fan domain, and 0. 3 million for the downstream domain.
Grid independency test.

Governing equations and simulation strategies
The flow through fan is taken as turbulent incompressible flow and is governed by the Reynolds-averaged Navier–Stokes (RANS) equations

where

where
The Reynolds stress

where

The above equations need turbulence closure for resolution. The RNG k-ε turbulence model and SIMPLE algorithm were applied to the steady simulation calculation of the flow field in the small axial flow fan.27–29 The shear-stress transport (SST) turbulent model was adopted by Kim et al. 30 to calculate the flow field of a tunnel ventilation jet fan. This turbulence model is sensitive to adverse pressure gradients and boundary layer separation, which are more common when an axial fan is under a state of rotational periodicity. Generally, in the case of SST turbulent models or k-ω turbulent models, using the wall function is known to be valid when the y-plus values are not higher than 300. 9 The SST turbulent model, which has the advantages of both k-ω and k-ε, employs the k-ω model at the near-wall and the k-ε model in the bulk-flow region, a blending function that ensures a smooth transition between the two models. 31 Since the SST model showed better predictions of flow separation along smooth surfaces, it was adopted for use in this article.
The finite volume method is used to discretize the governing equations. The second-order upwind interpolation schemes are applied for the pressure and momentum equation, respectively. The SIMPLE algorithm is adopted to handle the pressure–velocity coupling. The frozen rotor method is utilized to transmit flow properties between the rotational and the stationary zone interface. All the solid walls imposed no-slip flow condition. The flow conditions at rotor inlet are characterized by total pressure, whereas mass flow rate is specified at the rotor exit. A convergence criterion is prescribed to obtain a periodic variation of the torque of the fan and a maximum residual less than 1.0 × 10⁻⁵.
Results and discussion
Tested performance of the fan
After the wind tests, some characteristic parameters can be obtained from the experimental datum. Figure 6 shows the effect of the GF height on the fan’s total pressure rise coefficient

Effects of GF height on the total pressure rise coefficient.
Figure 7 shows the effects of the height of the GF on the TPE
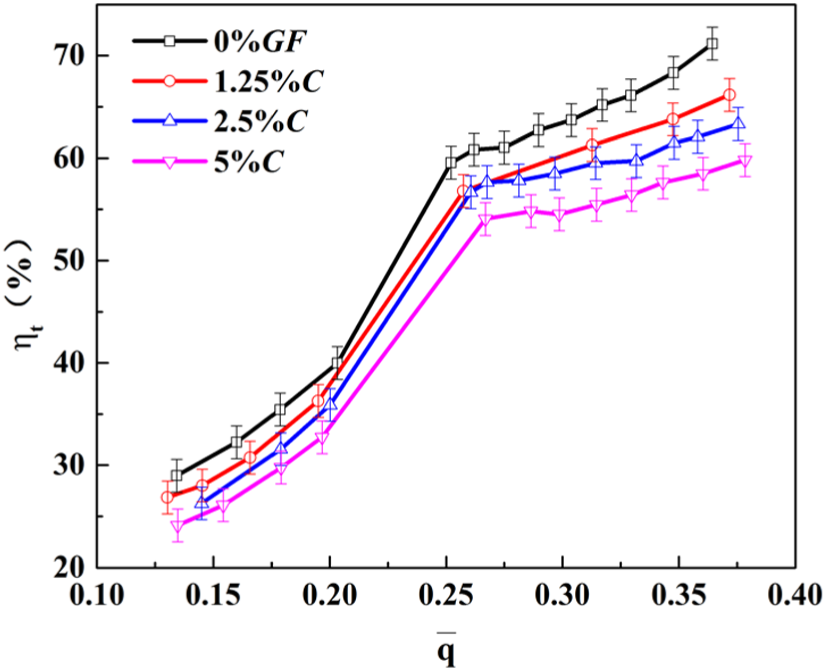
Effects of the GF height on the total pressure efficiency.
The effect of GF height on the SPE

Effects of the GF height on the static pressure efficiency.
Validation of CFD computations
The CFD validations are performed by comparing the calculated and measured performance curves of baseline fan and fan with 1.25%C GF. Figure 9 shows the comparison of total pressure rise. For operations near the design point, CFD result matches well with experiment data. Difference is within the measurement uncertainty band. When the fan tested approaches the stall limit, CFD computation becomes unstable and hard to meet the prescribed calculation convergence criteria. It is a common problem faced by RANS solutions since the turbulence model enclosed is not predictable for the separating flow in stalling fan. Nevertheless, Figure 9 proves that the chosen simulation strategies are reliable. It also provides a solid foundation for the flow field analysis in the following paragraphs.

Comparison of the experimental and simulation results.
Flow analysis of a fan with GF
Numerical simulation was carried out at the operation condition that the mass flow rate coefficient

Vorticity distribution at the trailing edge of the blade: (a) fan without GF, (b) fan with GF (1.25%C), (c) fan with GF (2.5%C), and (d) fan with GF (5%C).
Distributions of static pressure coefficient at 10%, 50%, and 90% height of the blade are shown in Figure 11. The dimensionless static pressure is defined as

where

Static pressure distribution along the blade chord: (a) 10% height of the blade, (b) 50% height of the blade, and (c) 90% height of the blade.
In order to illustrate the static pressure variation with the GFs, the static pressure distribution on the suction surface is presented in Figure 12. There are two obvious high-pressure zones on the suction surface of the baseline fan. The first high-pressure zone is large and covers the blade height below 50% spanwise. The other one is a small area near the blade tip. As the GF height is increased, it can be found that the static pressure on the suction surface is reduced near the trailing edge of the blade, especially below the midspan surface. It supposes that the velocity on the suction side is accelerated and the static pressure is reduced.

Static pressure distribution on the suction surface: (a) fan without GF, (b) fan with GF (1.25%C), (c) fan with GF (2.5%C), and (d) fan with GF (5.0%C).
Figure 13 shows the variation in the total pressure coefficient along the flow direction at the blade midspan. A higher total pressure coefficient is obtained with a higher flap. In total, 11.74% more total pressure coefficient can be obtained with 5%C GF than the original fan at the tailing edge. Since a GF is so limited in size, an obvious difference in the total pressure coefficient between fans with and without GFs can only be found around the airfoil and near the blade trailing edge.

Midspan axial variation of the total pressure rise.
Figure 14 shows the wall shear stress on the midspan suction surface. Minus axial wall shear is observed on the suction side which indicates a separation occurs. However, it can also be observed that separation occurs earlier on the clean fan than on a GF fan. This indicates that the flow separation at the suction surface will be suppressed when the GF is installed. It is the same result with Jeffrey et al.’s 33 experimental data. She conducted laser Doppler anemometry (LDA) measurements downstream of a GF. The LDA data show that the wake consists of a Karman vortex sheet of alternately shedding vortices. When a GF is added at the trailing edge of the airfoil, a periodic shedding of vortices occurs, which reduces the adverse pressure gradient to a certain extent and accelerates the flow over the trailing edge. This results in a decrease in the flow separation and pressure of the suction surface trailing edge.

Distribution of axial wall shear on the midspan suction surface.
Figure 15 shows the distribution of pitch-averaged relative outlet airflow angles along the blade height. Relative outlet angle is defined as

where u represents for circumferential velocity and w represents for axial velocity. The relative outlet airflow angle of the fan with a GF is smaller than that of the original fan from the hub endwall to 80% span of the blade, indicating that the flap exerts extra blade force to push the outlet flow toward the axial direction and causes the flow to have a larger airflow-turning angle. Therefore, the GFs can enhance the work capability of fans. We know from the previous sections that the GF is able to increase the pressure difference between the suction surface and pressure surface on the rear half chord near trailing edge, which produces a stronger blade tip leakage vortex, tending to move from the pressure surface to the suction surface. Its mixing with the main flow is intensified with the height of the installed GF. As shown in Figure 15, this difference is clear at the spanwise position from 80% to 100% of the blade height, where the tip leakage flow mixes with the main flow.

Relative outlet airflow angle along the span.
Figure 16 shows the variation in the total radial pressure rise at the positions of 0%, 20%, 40%, 60%, 80%, and 100% of the axial chord. Compared with the original fan, there is no obvious difference in the pressure distribution before 20% of the axial chord. When the flow comes to a position of approximately 40% of the axial chord, the difference in the total pressure at the blade tip becomes obvious due to the strengthened tip leakage caused by the GF. This phenomenon can be clearly found when the flow runs over the blade surface near 60% of the chord. At positions of 60%, 80%, and 100% of the axial chord, the total pressure of a fan with a GF is always higher than that of the original fan for the entire blade span. Approaching the blade trailing edge, larger differences in pressure appear. In addition, this difference will be more obvious when the height of the GF is increased.

Comparison of total pressure rise at different axial positions with GFs: (a) 0% axial chord, (b) 20% axial chord, (c) 40% axial chord, (d) 60% axial chord, (e) 80% axial chord, and (f) 100% axial chord.
Figure 17 compares the circumferential average total pressure loss coefficient along blade height. The total pressure loss coefficient is defined as
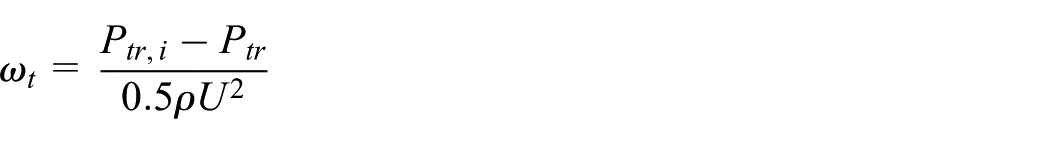
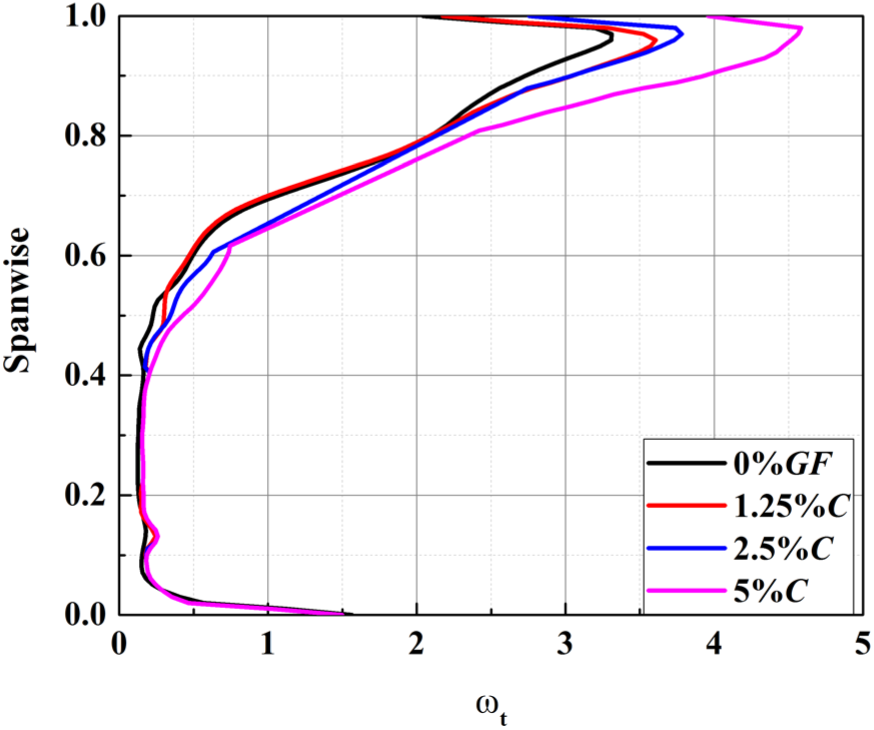
Circumferential average total pressure loss coefficient in spanwise.

Turbulent kinetic energy contours at the exit plane of the fan: (a) fan without GF, (b) fan with GF (1.25%C), (c) fan with GF (2.5%C), and (d) fan with GF (5%C).
Figure 18 presents the turbulent kinetic energy contours on the cross-flow section at the blade railing edge. The turbulent kinetic energy is clearly increased at the outlet area by adding a GF, especially in the area of the blade tip. High-turbulence area is the location of the tip leakage vortex. As the GF height increases, the center of the tip clearance vortex moves inward to the suction surface. In addition, the vortical occupied area grows larger. These colored contours more intuitively demonstrate the conclusions ever drawn that the static pressure of the suction surface of the blade is decreased and the static pressure of the pressure surface is increased when a GF is installed.
Conclusion
This article presents a computational and experimental investigation of the effect of the GF on the performance of an axial fan. The fan is specially designed for relatively low blade aspect ratio and high solidity assembling diffusive cascade flow characteristics. Baseline fan without a GF is compared to fans with 1.25%, 2.5%, and 5% chord GFs. Similar GF effects have been found on target axial flow fan with some new especial hints for diffusive cascade flow. Some main points are drawn as conclusions:
The experimental results show that the total pressure rise is increased with a GF installed, and the magnitude of the increase is enlarged with increase in GF height. In contrast, the fan’s total pressure efficiency is reduced by GFs within the entire operation range of flow coefficients. However, the SPE of a fan with a GF is increased compared with the original fan when the flow coefficient is 20% larger than the design value.
The computed pressure rise of the original fan and that of a fan with a 1.25% chord GF is compared with the experimental data. The presented computational results agree reasonably well with the available experimental data. This verifies that the CFD strategies chosen are reliable in evaluation of GF effects and related fan’s performance.
Through a numerical investigation, it is found that trailing-edge GF accelerates the flow and reduces the adverse pressure gradient on the suction side, which suppresses the potential flow separation on the suction surface close to cascade exit. The fan’s exit flow tends to be deflected toward axial. This indicates that a fan with GF produces a larger airflow-turning inside the diffusion cascade. Shedding vortices with high-turbulence intensities are clearly visible in the GF blade wake. An extra vortex region is created in front of the GF. These vortices are responsible for the increased suction on the upper surface and increased pressure on the low surface. All of the above phenomena result in an increasing work capability of the fan. The tip leakage vortex is strengthened by the increased suction on the suction surface and the increased pressure on the pressure surface. It is the main reason for the decrease in efficiency.
Footnotes
Appendix 1
Handling Editor: Zengtao Chen
Declaration of conflicting interests
The author(s) declared no potential conflicts of interest with respect to the research, authorship, and/or publication of this article.
Funding
The author(s) disclosed receipt of the following financial support for the research, authorship, and/or publication of this article: The work described in this paper was supported by the Chinese National Natural Science Funds (No. 51276116).