
Abstract
A method based on basic scale entropy and Gath-Geva fuzzy clustering is proposed in order to solve the issue of bearing degradation condition recognition. The evolution rule of basic scale entropy for bearing in performance degradation process is analyzed first, and the monotonicity and sensitivity of basic scale entropy are emphasized. Considering the continuity of the bearing degradation condition at the time scale, three-dimensional degradation eigenvectors are constructed including basic scale entropy, root mean square, and degradation time, and then, Gath-Geva fuzzy clustering method is used to divide different conditions in performance degradation process, thus realizing performance degradation recognition for bearing. Bearing whole lifetime data from IEEE PHM 2012 is adopted in application and discussion, and fuzzy c-means clustering and Gustafson–Kessel clustering algorithms are analyzed for comparison. The results show that the proposed basic scale entropy-Gath-Geva method has better clustering effect and higher time aggregation than the other two algorithms and is able to provide an effective way for mechanical equipment performance degradation recognition.
Keywords
Introduction
In the theory of mechanical equipment maintenance, condition-based maintenance (CBM) is proposed based on the real-time monitoring information of the equipment. Under the framework of CBM, the operating condition can be recognized combining with equipment structure and dynamic character, the fault evolutionary trend can be predicted either. 1 The key technologies of CBM include degradation feature extraction, degradation condition recognition, and residual life prediction.2,3
Rolling bearing is an important rotary supporting component in mechanical equipment and bearing faults usually take up about 30% in rotating machinery faults. At present, many studies focus on feature extraction and pattern classification for different fault types of bearings.4,5 Correspondingly, studies on degradation feature extraction and residual life prediction are relatively less. Rolling bearing usually experiences an evolution process from normal to failure in the performance degradation process; if its degradation condition can be recognized timely and accurately, the inspection and replacement for bearing will be more scientific and reasonable, thereby enhancing the operating reliability of the entire mechanical equipment. In order to recognize the degradation condition of rolling bearing, it is necessary to solve the aforementioned two key technologies: the first one is extracting an effective degradation character and the second one is establishing a scientific degradation condition recognition model.
As the first key technology, degradation feature extraction is the basis of degradation condition recognition and its target is reflecting performance degeneration principle accurately. Degradation feature extraction is usually proposed with mechanical signal processing for pre-processing, and then, some statistical parameters can be directly used as the health indicators 6 such as kurtosis, root mean square (RMS), 7 spectral kurtosis, 8 and smoothness index. 9 On the basis of spectral kurtosis technique, which is a well-known and recognized research work, spectral L2/L1 norm is proposed as a new progress toward bearing and gear for characterizing non-stationary signals;10,11 this health indicator has an extension form as spectral Lp/Lq, when p = 2 and q = 1, spectral L2/L1 is the square root of spectral kurtosis and when p = 1 and q = 0, spectral L1/L0 is the reciprocal of the smoothness index.
In addition to these typical statistical parameters, entropy theory provided an effective way for nonlinear signal analysis and degeneration feature extraction. Typical entropy-based health indicators include Shannon entropy and its variants such as lifting wavelet sample entropy, 12 hierarchical entropy, 13 local characteristic-scale decomposition (LCD) spectral entropy, 14 multi-scale entropy, 15 and permutation entropy. 16 Its advantages lie in scientific theoretical basis, anti-noise, and dimensionless. They are very attractive for constructing degradation features. In this field, the proposal of basic scale entropy (BSE) 17 provides a new idea for nonlinear signal analysis. BSE is able to symbolize the amplitude of heartbeat interval and measure the complexity based on symbolic dynamics theory. The method originates from cardiac electrical signal analysis18–20 and has some advantages such as simple and fast in calculation, as well as strong anti-jamming capability, and it is effective in analyzing short-term, non-stationary, and noisy interference signal. There have been some successful applications in fault diagnosis field. For example, a fault diagnosis method based on improved intrinsic time-scale decomposition (IITD) and BSE is proposed. 21 IITD is used to decompose the gear vibration signal first, and then, BSE parameters of the first four components are calculated as the fault feature vectors. A diagnosis method based on local mean decomposition (LMD) and BSE is proposed. 22 The fault feature vector is extracted using LMD and BSE, and adjacent propagation (AP) clustering algorithm is used for classification of different fault types. In this article, we try to propose a degradation analysis technique based on BSE, which is different from above-mentioned research thought; BSE theory will be applied in the performance degradation feature extraction and the evolution rule will be analyzed, which lays the foundation for the recognition of diverse performance degradation conditions.
As the second key technology, degradation condition recognition is a pattern recognition issue essentially. The degradation process of mechanical engineering is characterized by randomness and fuzziness, and it is unpredictable, as well as the number and boundary of degradation conditions are difficult to be determined. Clustering analysis is able to deduce the similar relationship among the data from the degradation features and divide them into different categories without supervision, which is an effective way to solve the degradation condition recognition issue. Typical clustering methods include K-means clustering (K-means), fuzzy c-means clustering (FCM), Gustafson–Kessel (GK) clustering method, and so on. The mathematical morphological fractal dimension 23 is used for the performance degradation character, and FCM algorithm is employed to realize degradation condition clustering automatically. A degradation condition clustering method based on empirical mode decomposition (EMD) and K-means is proposed. 24 Ensemble empirical mode decomposition (EEMD) permutation entropy is extracted as the fault feature, 25 and principal component analysis and GK clustering method are employed to achieve automatic clustering for rolling bearings.
Within the unsupervised clustering algorithms, Gath-Geva (GG) fuzzy clustering algorithm improves the traditional clustering algorithm and introduces distance norm based on the fuzzy maximum likelihood estimation. GG fuzzy clustering is able to reflect data categories in different shapes and directions, and the clustering accuracy is higher than traditional clustering algorithms. Fuzzy entropy and GG clustering are used in bearing diagnosis, 26 and the clustering effect is better than FCM and GK algorithms. A degradation condition evaluation method based on variational mode decomposition (VMD) and GG clustering is proposed, 27 and time series is segmented by GG clustering. A fault feature extraction method based on EEMD and singular value decomposition (SVD) is proposed, and GG fuzzy clustering method is employed in fault types clustering. 28 In the field of GG fuzzy clustering algorithm, the focus mainly lies in fault diagnosis and clustering of performance degradation condition is relatively less. In addition to this, the time continuity constraint in performance degradation condition is not taken into account, and it is necessary to go further study.
In conclusion, the two key issues above for degradation condition recognition will be solved based on BSE and GG fuzzy clustering algorithm. The evolution rule of BSE in bearing performance degradation process will be analyzed, and the degenerate eigenvector including time constraint will be established. GG fuzzy clustering algorithm will be used to recognize different degradation conditions. The validity and superiority of this method will be verified using IEEE PHM 2012 bearing whole lifetime data.
The remainder of this article is organized as follows. In section “Review of BSE,” BSE theory is briefly introduced. In section “Degradation condition recognition based on BSE-GG,” the degradation condition recognition method based on BSE-GG is proposed. In section “Application and discussion on rolling bearing,” the whole lifetime datasets are introduced and the method is applied and discussed. Our conclusion is presented in section “Conclusion.”
Review of BSE
The calculation idea of BSE for one-dimensional signal includes three steps: first, transforming the signal from one dimension to m dimensions. Second, converting the m-dimensional vectors to m-dimensional corresponding symbol vectors according to basic scale parameter a. Finally, making a probability statistics for the symbol sequence and calculating the complexity of information named BSE. The specific calculation process is as follows:
Step 1: dimension transforming.
Defining u as a one-dimensional time series of length N, transforming the signal from one dimension to m dimensions named X as follows

where m is the number of dimensions and L is the delay factor which meets the following constraint: i + (m − 1)L ⩽ N.L is usually set as L = 1 and X(i) can be described as follows

Therefore, u is transformed into a vector with the structure of (N − m + 1) × m.
Step 2: symbol converting.
Converting X to corresponding symbol sequence S as follows

where s ∈ A, A = 0, 1, 2, 3. The conversion regulation is as follows 29

where

The variable a is the basic scale parameter that need to be selected properly in practical application. Detail information and dynamic variation of the signal are unable to be reflected if this parameter is set bigger; relatively, the result will be affected by noise if this parameter is set smaller.
Step 3: probability statics and information calculation.
Making a probability statistics for the m-dimensional symbol sequence S. According to mathematical statistics, m-dimensional symbol sequence S has a total of 4m different combinations considering of the four symbols in formula (4), so the distribution probability P of the vector can be calculated as follows

where 1 ⩽ t ⩽ N − m + 1, operator “#” represents the number. Finally, calculating the normalized BSE as follows

The BSE describes the information complexity of fluctuation in time sequence. The larger the BSE value, the more complex of the time sequence; on the contrary, the lower the BSE value, the more simpler the time sequence. According to the definition in formula (7), the indicator is proposed based on information entropy theory. The maximal value will be obtained as H(m) = 1 when
In general, the delay factor defaults to L = 1, the vector dimension m is generally valued from 3 to 7, and it satisfies the condition of 4 m or less than N. Parameter a is generally set as 0.1–0.4. 30
Degradation condition recognition based on BSE-GG
It has been accepted that rolling bearings will generally experience several degradation conditions from normal to failure in degradation process. 31 In order to analyze the degradation principle and recognize degradation conditions effectively, BSE and GG fuzzy clustering method are combined and employed for solving the degradation condition recognition issue in this article, and the basic flow of the so-called BSE-GG method is shown in Figure 1.

The flow of degradation condition recognition based on BSE-GG.
Whole lifetime data set gathering and division
Gathering whole lifetime data set from normal condition to failure based on online monitoring. Considering the long testing time and huge data, continuous interleaved sampling is adopted. Each vibration data are marked as group 1, group 2 until group N.
Degradation feature extraction
Extracting the degradation features for each group, BSE indicator and RMS are employed as the degradation features to represent the degradation principle in complexity and time domain respectively. At the same time, considering the continuity constraint of the same degradation condition in time scale, the time feature t is employed into degradation feature to describe the time process of the groups. So, three-dimensional feature vectors labeled as [BSE; RMS; t] will be constructed.
Degradation conditions recognition
Setting key parameters such as the number of class and inputting degradation feature vectors into GG fuzzy clustering algorithm to recognize different degradation conditions.
Clustering effect evaluation
Evaluate the clustering effect based on classification coefficient (CC), average fuzzy entropy (AFE), and time accordance (TA), comparing the effect with other clustering algorithms. The definitions of the three indicators are as follows.
CC
This indicator is defined as the quadratic mean of membership matrix. The calculating formula is as follows, in which μik represents the membership value. The closer CC to 1, the better the clustering effect

AFE
The indicator is defined as the information entropy of the membership distribution. The calculating formula is as follows, in which μik represents the membership value. The closer AFE to 0, the better the clustering effect

TA
This indicator is defined as the deviation of the samples on the time character. First, define a parameter named sequence deviation degree (Sd, Sequence divergence) to represent the out-of-order degree. Assuming that Se is an digital sequence with N elements, Se1 can be obtained by ascending Se. Assuming q is the minimum value in Se1, the sequence index I1 can be calculated with the operation that each element minus (q − 1) in Se1. A standard sequence index I0 is defined as [1, 2, …, N]. And, the sequence deviation degree Sd is defined as follows

Assuming that the set of clustering samples X = {x1, x2, …, xN} is classified into c classes. The sample set belonging to each class is S = {s1, s2, …, sc}. Calculating the sequence deviation degree Sdi (i = 1, 2, …, c) for samples in each class on time character. And, the TA indicator can be calculated as follows

According to the basic definition, the closer TA to 0, the higher the time aggregation of the sequence and the better the clustering effect.
Application and discussion on rolling bearing
Whole lifetime data sets
Bearing whole lifetime data set in this article is provided by IEEE PHM 2012. 32 The experiment was processed at the PRONOSTIA test rig of the FEMTO-ST Research Center. Multiple sets of bearing whole lifetime vibration signals were acquired varied from normal to failure by running accelerated degradation test under different loading conditions. The actual scene of the test rig is shown in Figure 2. Vibration signal from the vertical and horizontal axes at the rotor output shaft is collected in the accelerated degradation test.
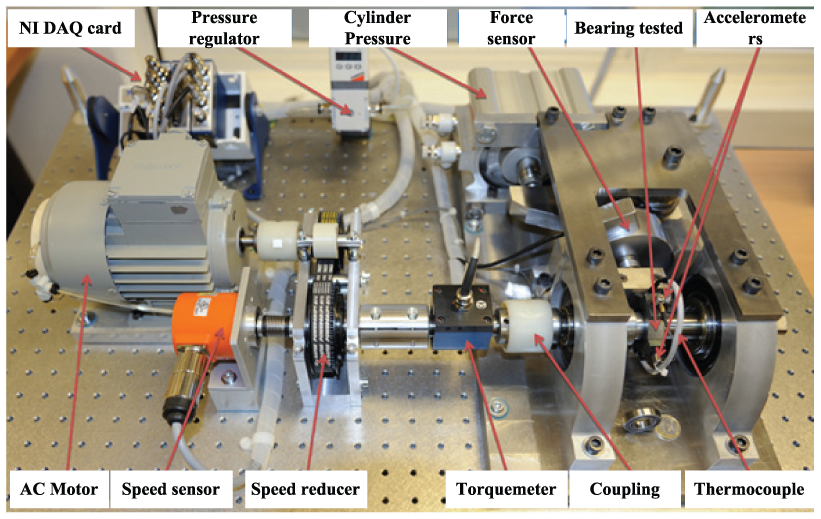
The setting of accelerated degradation test.
Three groups of whole lifetime data sets are selected, in which the vertical axis vibrating signal is analyzed with emphasis. The sampling frequency is 25.6 kHz, the sampling time is 0.1 s, and the interval of sampling is 10 s. The basic description of the data sets is shown in Table 1.
Relevant parameters for the three groups of whole lifetime test data set.

We got a sketchy description of the performance degradation process from time-domain waveform by ignoring the sampling interval. As shown in Figure 3, it is clear that three data sets maintain a relatively stable state in early and middle stages of life, and the amplitude gradually increased in the later stage until the bearing fails. Relatively speaking, obvious impulsive component exists in the middle stage for dataset3.
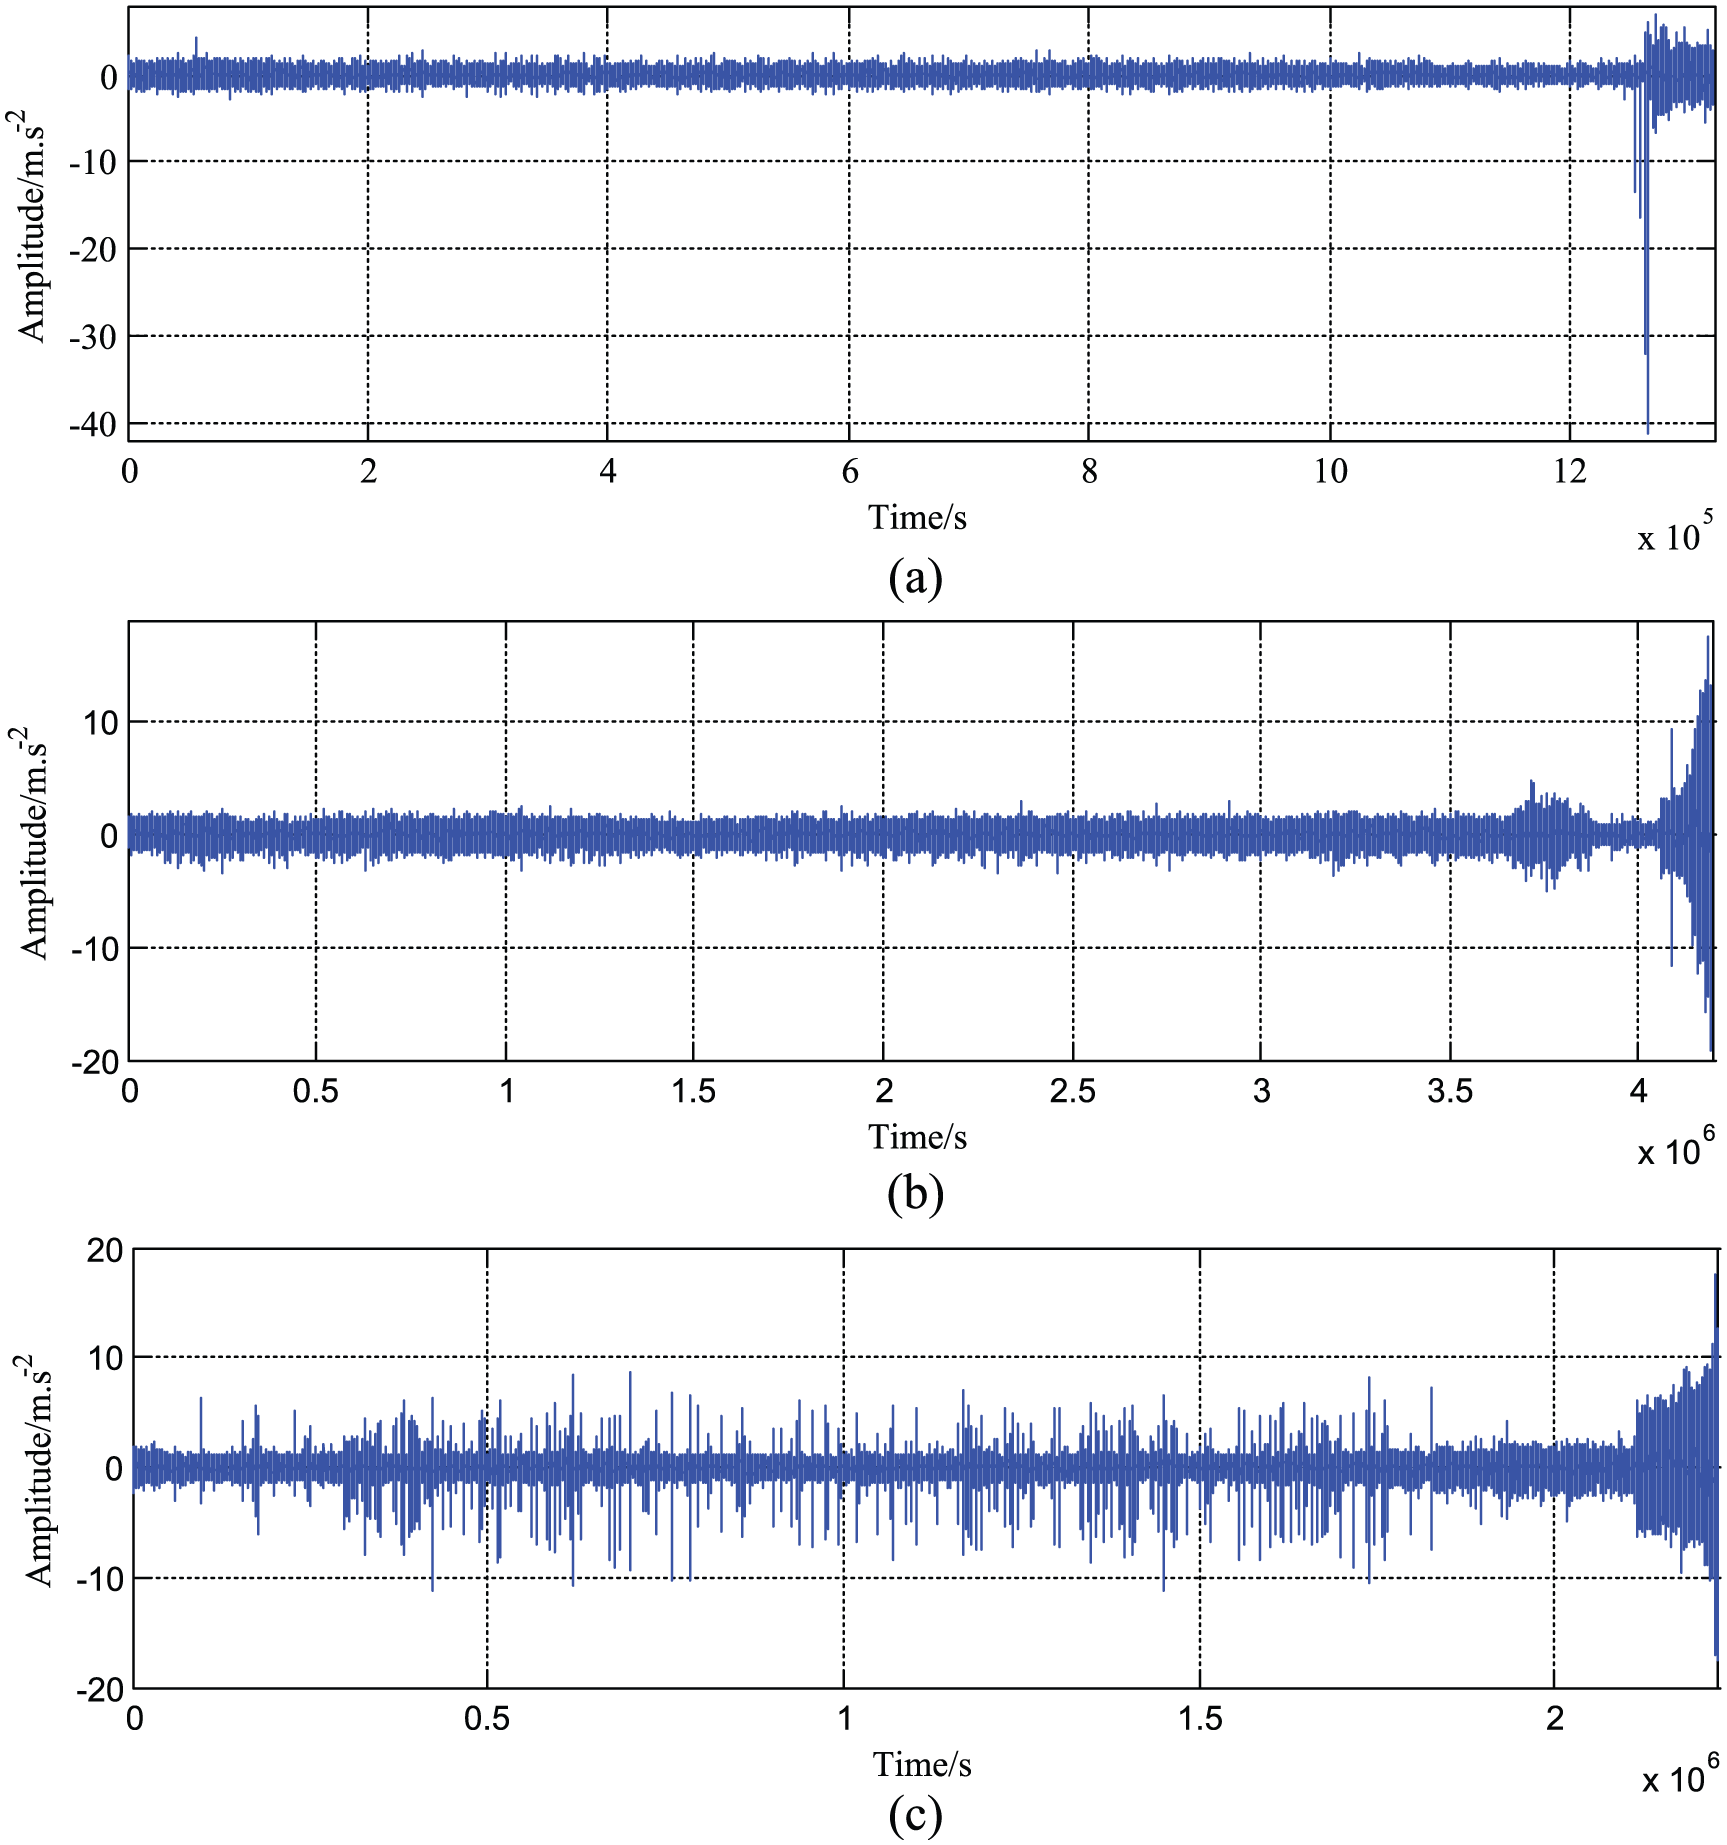
The time-domain waveform for three groups data sets: (a) dataset1, (b) dataset2, and (c) dataset3.
Degradation feature extraction based on BSE
Taking dataset1 as the analytical target and extracting the degradation features following the method shown in Figure 1. In the BSE calculation process, by contrast, BSE has no evident differences if m changes from 3 to 7 and a changes from 0.1 to 0.6. So, the basic parameters are set as L = 1, M = 4, a = 0.2 according to experience and some comparison. The BSE and the RMS of the three data sets are shown in Figure 4.

The features evolution diagram for dataset1: (a) BSE and (b) RMS.
It is apparent that BSE shows a monotonically increasing trend as well as certain staged characteristic in the process reflecting different conditions of bearing performance degradation. As the upper and lower bound of BSE introduced in section “Review of BSE,” the BSE value remains relatively stable and maintains at about 0.55 before the 55th sampling point. A slow rise process exists and the value rises from 0.6 to 0.72 slowly from the 55th to the 490th sampling points. After the 490th sampling point, a significant rise appears and the value remains at about 0.75 when the bearing is considered invalid. Correspondingly, the value of RMS presents a rising trend and the staged characteristic is obvious; however, there is a significant downward trend around the 55th sampling point, the phenomenon may be induced triggered by the breaking-in period of the bearing and different regularity appears in the angles of BSE and RMS.
In summary, BSE reflects an overall monotonous character and it is very sensitive to the state variation in the bearing performance degradation process. The regularity of bearing performance degradation can be reflected by this parameter, and it is effective for extracting BSE as the performance degradation feature.
Degradation condition recognition using GG clustering
The course of degradation condition recognition is expounded taking dataset1 as an example in this section. We can get the 515 × 3 degradation feature vectors in section “Degradation feature extraction based on BSE” and the feature vectors will be clustered automatically by GG fuzzy clustering after normalization. According to the preliminary analysis in section “Degradation feature extraction based on BSE,” the parameters are set as c = 3, M = 2, and ε = 0.0001. The degradation condition centers are updated iteratively until the algorithm is converged. The FCM and GK clustering algorithms are employed for comparison. The contour line clustering effect on the two features of BSE and RMS are shown in Figure 5, where “O” represents the cluster centers. It is observed that the contours are arbitrary shapes and the overlap degree for clustering samples is low while the contours of FCM and GK clustering are close to circular and elliptical, respectively. It indicates that GG fuzzy clustering algorithm has the lowest distribution requirement for data source, and the fitness is the best.

Contour line clustering effect for three clustering algorithms for analysis on dataset1: (a) contour line clustering effect for GG, (b) contour line clustering effect for FCM, and (c) contour line clustering effect for GK.
The three-dimensional clustering effects for the three clustering algorithms are shown in Figures 6–8. We identify the clustering results as condition 1 (breaking-in phase), condition 2 (stable phase), and condition 3 (failure phase) based on the value of BSE, respectively. After contrastive analysis qualitatively, we can conclude that GG fuzzy clustering algorithm is able to identify the main trend and mutational points of the character curve while FCM algorithm identifies most of the stable samples as a failure data and GK algorithm estimates an overlong time for breaking-in phase.

Clustering effect for GG algorithm.

Clustering effect for FCM algorithm.

Clustering effect for GK algorithm.
The clustering effect of the three algorithms on dataset1 is contrasted quantitatively in Table 2. It is evident that GG fuzzy clustering algorithm gets the highest value in CC and the lowest value in AFE as well as TA, which means the best clustering effect among the three clustering algorithms.
Quantitative results for the three clustering algorithms.

GG: Gath-Geva; FCM: fuzzy c-means clustering; GK: Gustafson–Kessel.
Comparison with different features
After analysis and comparison on dataset1, GG fuzzy clustering algorithm is employed in analyzing dataset2 and dataset3. Three-dimensional eigenvector [BSE; RMS; t] and two-dimensional eigenvector [BSE; RMS] are used, respectively, to show the effect of time character. The contrast is shown in Figures 9 and 10 and Table 3. It is clear that CC and AFE are nearly close, but the TA is better for three-dimensional eigenvector than the two-dimensional eigenvector without time character. For example, from Figure 10(a), several data points clustered in condition 3 have been sporadically distributed in the continuous time scope belonging to condition 2, and the value of TA has reached 204, which means a bad accordance in time sequence. It can be concluded that the time dimension distance can be considered in the course of GG fuzzy clustering under the constraint of time eigenvector, and the time aggregation degree will be enhanced within the same class.

Clustering effect of GG fuzzy clustering algorithm with different features for dataset2: (a) two-dimensional feature [RMS; BSE] and (b) three-dimensional feature [RMS; BSE; t].

Clustering effect of GG fuzzy clustering algorithm with different features for dataset3: (a) two-dimensional feature [RMS; BSE] and (b) three-dimensional feature [RMS; BSE; t].
The quantitative clustering results for the three algorithms.

BSE: basic scale entropy; RMS: root mean square.
In conclusion, the method proposed has a good clustering effect in validity and superiority, and it is able to meet the requirement of performance degradation condition recognition.
Conclusion
In this article, a degradation condition recognition method is proposed based on BSE and GG clustering. Three main conclusions are obtained through the analysis and verification of the method:
BSE is able to reflect the complexity of the fluctuation pattern for the signal, thus depicting the evolution rule of rolling bearing in the process of performance degradation. The feature presents a character of monotonicity for main trend and changing sensitivity so that it is an effective way for degradation feature extraction.
GG fuzzy clustering method is able to cluster data of arbitrary shape, the time aggregation degree within the class will be improved, and the clustering accuracy will be high on the condition that adding time constraints to the feature eigenvectors. The proposed indicator named TA has a better reflection on the time aggregation effect.
The uncertainty of the number of degradation conditions has always been a difficult problem in this field. In this article, the parameter c of GG fuzzy clustering algorithm is set by a priori knowledge, and the result is consistent with the visual analysis. It is necessary to study some intelligent method to solve this problem.
Footnotes
Handling Editor: Shun-Peng Zhu
Declaration of conflicting interests
The author(s) declared no potential conflicts of interest with respect to the research, authorship, and/or publication of this article.
Funding
The author(s) disclosed receipt of the following financial support for the research, authorship, and/or publication of this article: This research was funded by the National Natural Science Foundation of China (grant no. 51541506).