
Abstract
The surface coating is one of the novel approaches to enhance the performance and durability of the mechanical components by decreasing the wear and friction among two interacting bodies. In this study, tribological and mechanical properties of titanium nitride (TiN) coatings were investigated on the AISI 52100 bearing steel deposited by low-temperature physical vapor deposition system. Surface morphology and elemental composition of the TiN coating were analyzed by scanning electron microscope and energy-dispersive X-ray spectrum, respectively. Substrate surface roughness and coating thickness of TiN were varied for correlative analysis among adhesion, mechanical, and tribological properties. Scratch and tribo tests were performed for evaluating the adhesion and tribological properties, respectively. Samples having the substrate surface roughness (0.2 ± 0.05 µm) and the coating thickness of more than 2.83 µm presented relatively better adhesion, wear resistance, and lower coefficient of friction of the TiN coating.
Keywords
Introduction
Friction and wear are considered to be the most important factors for assessing the performance and functionality of the mechanical components. Tribo-mechanical properties of the surfaces of the machine components are enhanced by deposition of the ceramic coatings. These coatings are considered to be one of the best ways to enhance the performance and durability of the machine elements such as bearings and piston cylinder liner assembly systems.1,2 Owing to their superior mechanical properties, corrosion and wear resistance, and tribological characteristics, these coatings are extensively investigated in mechanical engineering research.3–7 In particular, titanium nitride (TiN) is a single metal nitride hard ceramic coating having broad range of applications in machine elements, cutting tools, and medical implants due to its excellent tribo-mechanical properties. 1 It is widely deposited on the surfaces of the various mechanical components in order to increase the operating life and performance of the system. Various studies have been conducted on the tribological properties of the TiN and similar ceramic coatings for highlighting the advantages of these coatings over uncoated surfaces of the mechanical components and tools.8–12
In this study, TiN coating is deposited on AISI 52100 bearing steel. The AISI 52100 bearing steel has many applications in different rotating elements such as anti-friction bearings, crankshaft, and camshafts. 13 Researchers have reported deposition of boride and nitride coatings on bearing steel for the assessment of tribological and mechanical performance.14,15 Due to the extensive use of bearings in almost every mechanical system, both the research community and the industry are facing challenges in designing, selection of the materials, and surface modifications for the enhancement in the performance of the industrial tribological systems. 16
Conventionally, TiN coatings are deposited by physical vapor deposition (PVD) and chemical vapor deposition (CVD) process. PVD is the most used method of depositing TiN coatings and traditionally requires 400°C–600°C substrate temperature for deposition.17,18 AISI 52100 steel is generally tempered at 150°C–260°C temperature range 19 which compromises its mechanical properties. In order to investigate the possibility of applying the TiN coatings on AISI 52100 bearing steel without damaging its mechanical properties, we have deposited low-temperature PVD TiN coatings at 130°C deposition temperature.
In order to achieve the maximum benefits of these coatings, the properties of these coatings have been probed at different parameters. This may affect the performance of the coatings. The substrate surface roughness and the coating thickness are the two most important parameters at which the fundamental coating properties (hardness and adhesion) depend. 20 However, there is only a small quantity of work available in the literature, which describes the impact of substrate surface roughness on the adhesion and tribo-mechanical properties of TiN coating (deposited by low-temperature cathodic arc PVD system). Besides the substrate surface roughness, the thickness of the coatings is also considered to be an important parameter which may affect the tribo-mechanical performance of TiN coatings.21,22
In this research, we have deposited and investigated the low-temperature TiN PVD coatings on the AISI 52100 bearing steel because there is almost no literature reported demonstrating low-temperature (less than 150°C) PVD TiN coatings on AISI 52100 bearing steel. At this temperature range, the possibility of commercial application of TiN coatings on bearing steel is possible without compromising mechanical properties of the base material, that is, AISI 52100 bearing steel. The impact of substrate surface roughness and coating thickness on the tribo-mechanical performance of the low-temperature TiN-coated AISI 52100 bearing steel has been evaluated. In addition, a detailed analysis of the friction and wear performance of the low-temperature TiN-coated AISI 52100 bearing steel is compared with conventional high-temperature PVD TiN coatings in literature. Furthermore, the causal relationship between the tribological properties, that is, coefficient of friction (COF) and wear rate, and the mechanical properties, that is, hardness and adhesion, are explained in detail.
Experimental work
Sample preparation
AISI 52100 steel having composition (1.05% C, 0.35% Mn, 0.3% Si, 1.5% Cr) was cut into circular disks. The disks were 4.0 mm thick and 30 mm in diameter. Four sets of disks, comprising two specimens in each set, were ground with emery paper (600–2500 mesh size), in order to achieve two different levels of surface roughness. The samples having the substrate surface roughness (Ra) 0.2 ± 0.05 µm and 0.05 ± 0.01 µm were considered rough and fine samples, respectively. Surface texture meter supplied by Taylor Hobson’s (Model Surtronic 25) was used for measuring the roughness of the samples.
Coating procedure
TiN was coated on these four sets of disk samples using cathodic arc PVD system. Prior to deposition, the samples were cleaned in the hot alkaline ultrasonic bath for 10 min; after this, the samples were submerged in methanol at 80°C for 15 min and then cleaned with deionized water. In the next step, the samples were blow dried with highly pure argon (Ar) gas. Finally, the samples were loaded into the PVD chamber for the deposition. The chamber was evacuated up to 6 × 10⁻⁶ mbar vacuum. High purity (N5.0) N2 and Ar gases supplied by mass flow controllers were used as the reactive and working gas, respectively. Before starting the coating deposition, the samples were cleaned in situ with 30 sccm Ar flow and 250 V substrate bias. Ar and N2 gases were supplied through a mass flow controller at 22 and 280 sccm, respectively. The coating was deposited at 100 V substrate bias voltage. The temperature was set at 80°C for each coating batch and reached up to 130°C during coatings. Coating thickness was varied by depositing all four sets with different deposition times, that is, 5, 15, 30, and 60 min.
Coating thickness (Calotest)
The thickness of TiN coating was measured using KALOMAX scratch tester. A steel ball of 20 mm diameter with diamond paste was rotated on the coated surface with the speed of 250 r/min for 60 s until the AISI 52100 steel substrate was exposed. An impression was created in the form of indent carrying two circles on the coated surface. The indent was observed on the optical microscope to evaluate the coating thickness by measuring the diameters of the pair of circles (inner and outer) by applying equation (1) 23

where Do is the diameter of the outer circle, Di is the diameter of inner circle, and R is the radius of the ball used.
The optical view of KALOMAX indent indicating the coating thickness of one of the samples is shown in Figure 1. Thicknesses of all test samples along with surface roughness level and deposition time are given in Table 1.

Optical view of KALOMAX indent of ≈0.432 µm coating thickness sample.
Thicknesses of four sets of TiN coating with respect to the corresponding deposition times and surface roughness.

Surface characterization of the TiN coating
A scanning electron microscope (SEM) was used for the investigation of the surface of the TiN coatings. Elemental composition of the TiN coating was obtained from the energy-dispersive X-ray spectrum (EDX) coupled with the SEM. Furthermore, post-surface roughness of the samples after the TiN coating was measured from the surface texture meter.
Scratch test
Standard scratch tests were conducted for the evaluation of adhesion of TiN coatings with the AISI 52100 steel substrates.24,25 The tests were performed on a progressive incremental load-type testing machine CSM (MSTX S/N: 01-2569). It was equipped with 100 µm radius Rockwell diamond indenter. The applied load was starting from 0.03 N, and the maximum final load was approximately 25 N. The tests were conducted at 7% acoustic emission sensitivity, indenter speed of 1.2 mm/min over the scratch length of 3 mm with the loading rate of 9.99 N/min. The critical load, which is also considered as scratch adhesion of the TiN coating with the substrate, is that particular value of the load at which the coating is completely delaminated and the substrate is visible. When the test was completed, the resulted scratch was observed on the optical microscope. An example of the scratch images of ≈0.672 µm coating thickness samples is shown in Figure 2.

Scratch images of ≈0.672 µm TiN-coated AISI 52100 bearing steel: (a) fine sample and (b) rough sample.
Nano indentation test
Nano indentation method is widely used for assessing the mechanical properties (elastic modulus and hardness) of the coatings.26,27 CSM Nano Hardness Tester (NHTX S/N: 01-2569) was used to determine the hardness (H) and elastic modulus (E) of TiN coating. The instrument employs a Berkovich-type diamond indenter. The maximum applied load was 50.0 mN. The tests were conducted at 10 Hz acquisition rate, 2000 nm/min approach speed with a 100.0 mN/min linear loading and unloading rate. During the tests, the sensors record the movement and indenter penetration into the coating, and the area of the indent was calculated from indenter geometry. A small pause of 20 s was given at the maximum load to ensure the deformation of the coating under the maximum load. Three indents were made on each sample, and corresponding three values of H and E were measured. The average of these three values of a sample was recorded as the hardness and elastic modulus of that sample.
Pin on disk tribometer
The tribotests were performed on a pin-on-disk tribometer CSM (S/N 01-02566). It contains a stationary pin pressed against the rotating disk with its axis normal to the disk. The disk specimen was mounted on the disk plate spindle. The pin specimen was held fixed in the loading arm. A normal load of 4 N was exerted on the disk sample through the loading arm carrying the pin. The tests were run up to 6000 cycles with linear speed 60 mm/s in a circular motion of radius 3 mm. Tungsten carbide (WC)-coated steel ball, 10 mm diameter, with surface roughness 0.2 µm was used as pin against steel disks. Moreover, the tribo tests were conducted at 10 Hz acquisition rate in ambient atmospheric conditions. The COF was measured continuously by recording the deviation of the elastic arm, while the wear rate was determined indirectly by measuring the weight loss of TiN-coated AISI 52100 steel specimens before and after the test. 28
Results and discussion
Morphology, surface roughness, and chemical composition of the TiN coating
The SEM images of the samples having ≈2.830 µm TiN coating thickness presenting the surface morphologies of the fine and rough samples, respectively, are shown in Figure 3. In Figure 3(a) and (b), we can see that there are white droplets and pits on the surface of the TiN coating. This is due to the intrinsic characteristics of the cathodic arc deposition technique. These defects are produced due to the metal particles which remained unreacted with the nitrogen during the deposition.29,30 The surface roughness of the samples increases due to these white droplets and pits after the TiN deposition. However, we observe larger pits and white droplets on the rough samples as compared to fine samples. The quantitative values of the surface roughness after the TiN coating of all the samples are given in Table 2.

SEM surface micrographs of the samples having ≈2.830 µm TiN coating thickness: (a) fine sample and (b) rough sample.
Surface roughness of TiN coatings at various thicknesses.
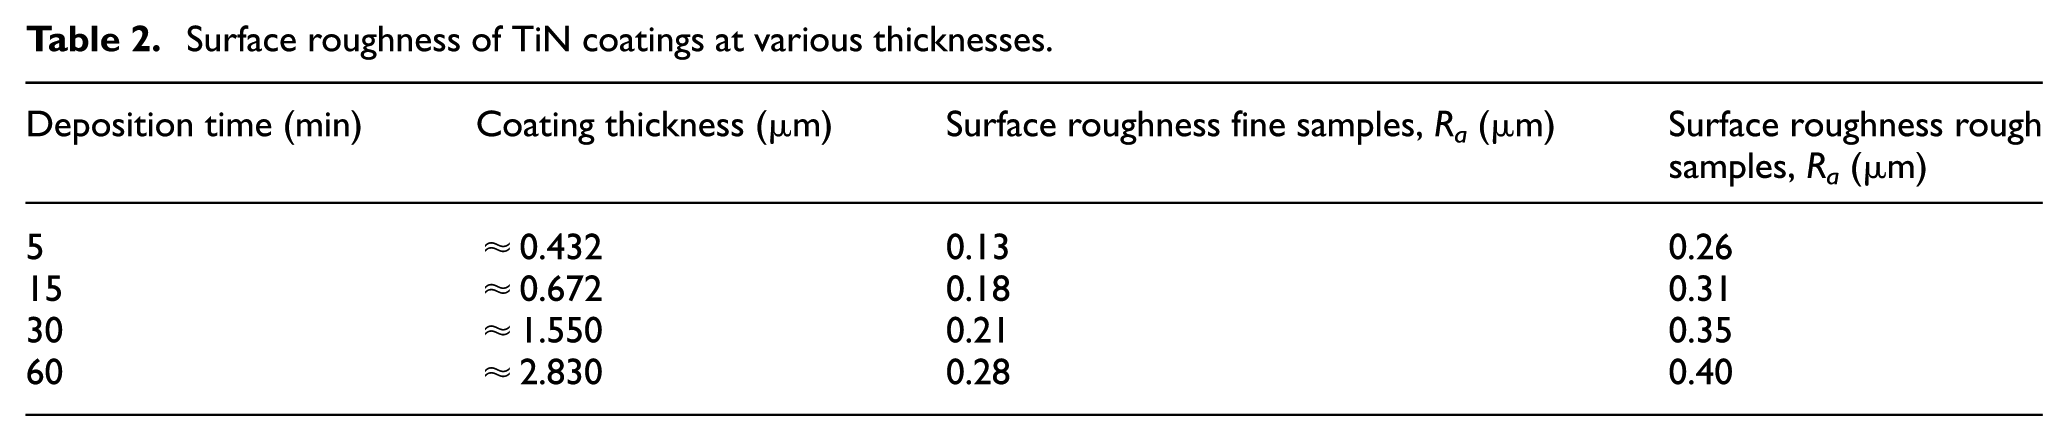
The surface roughness of the TiN-coated AISI 52100 bearing steel was in the range 0.26–0.40 µm for the rough samples and 0.13–0.28 µm for the fine samples. These values were significantly higher than their substrate surface roughness in both types of samples. Furthermore, it can be observed that the surface roughness of the TiN coatings increases as the coating thickness increases. Similar trend of the surface roughness with the increasing coating thickness had been reported previously in literature. 21
The elemental composition of the TiN coating was obtained from the EDX analysis. The EDX spectrum of the TiN coating shows (Figure 4) the presence of Ti, N, and C in the ratio 72.54%, 21.93%, and 5.53% with respect to percentage weight, respectively. The EDX reveals chemical composition of stoichiometric TiN coatings. However, carbon was detected due to the adventitious hydrocarbon surface contamination from the atmosphere.

EDX spectrum of TiN coating on AISI 52100 bearing steel.
Effect of substrate surface roughness and coating thickness on adhesion
Adhesion of the coating mainly depends upon the substrate surface roughness, deposition parameters, and coating thickness.31–33 Figure 5 presents the trend of adhesion of low-temperature TiN PVD coatings on rough and fine AISI 52100 bearing steel substrates with respect to increasing coating thickness. It is observed that the adhesion of TiN coating increases with the increase in coating thickness. 32 However, the samples with higher substrate surface roughness show superior adhesion as compared to the samples with lower substrate surface roughness. This trend is in compliance with the mechanical interlocking theory by Pizzi and Mittal 33 which states that there are crevices, asperities, pores, or irregularities on the surface of the substrate where the coating material penetrates, causing a strong bonding between the substrate and coating particles. Rough samples have more asperities or crevices on the surface as compared to fine samples which result in better interlocking and adhesion. Hence, the sample with thickest TiN coating and higher substrate surface roughness presents higher adhesion of the coating. Detailed scratch adhesion results are presented in Table 3.

Adhesion as a function of TiN coating thickness and substrate surface roughness.
Summary of adhesion, hardness, H/E, and H3/E2 ratio results.

Hence, there is no study of low-temperature TiN coating on AISI 52100 bearing steel previously reported in the literature. Therefore, we have compared our adhesion results with the most closely matched findings of the Łępicka et al., 34 who had deposited the ≈2 µm TiN coating on 316LVM stainless steel and reported the maximum of 16.53 N adhesion strength at 350°C deposition temperature by cathodic arc PVD system. Our results present maximum of 20.81 N adhesion strength of TiN coating on AISI 52100 bearing steel substrate at ≈2.830 µm coating thickness and 130°C deposition temperature.
Mechanical properties
Mechanical properties of the TiN coating were measured from nano indentation method. Nano indentation test gives the output in the form of graphs (load–depth curves) relating load and indenter depth during loading and unloading. Elastic modulus and hardness of the coating are estimated after the analysis of these curves. The hardness of the coatings is conventionally considered to be a primary factor in defining the wear resistance. The ratio of hardness and elastic modulus (H/E) has been reported by many researchers as the key parameter for explaining the wear resistance of coatings. 35 More recently, the ratio H3/E2 (resistance to plastic deformation) is also reported as the most suitable criterion to evaluate the wear resistance of coatings. 36
TiN coating on rough samples presents relatively higher values of hardness and elastic modulus in comparison with the fine samples (see Table 3). The increase in the hardness values of samples up to the critical coating thickness ≈0.672 µm is due to the finer grain size during the initial growth of TiN. This small grain size is fundamentally due to compressive strain at the interface of the TiN and the steel substrate. This behavior is in compliance with the Hall–Petch effect. 37
The graph indicating the H3/E2 ratio with respect to changes in coating thickness and surface roughness is shown in Figure 6. It shows that the H3/E2 ratio increases with the increase in coating thickness for both fine and rough samples up to ≈0.672 µm coating thickness. The value of H3/E2 ratio decreases from ≈0.672 µm coating thickness up to ≈2.830 µm coating thickness for both rough and fine samples. This is due to the enlargement of the grain size after the critical coating thickness around ≈0.672 µm which results in the decrease in the hardness values. Consequently, there is a decline in the H3/E2 ratio after critical coating thickness. The decline in the H3/E2 ratio of the TiN coatings on both fine and rough samples continues with an increase in coating thickness. But, overall, the H3/E2 ratio for rough samples is higher than the fine samples for all coating thicknesses. Detailed hardness, elastic modulus, H/E, and H3/E2 ratio results are given in Table 3.

H3/E2 ratio as a function of TiN coating thickness with respect to their substrate surface roughness.
This behavior is due to the fact that when the film starts to grow on the substrate, residual stresses are also evolved along with the film growth. Initially, compressive-type residual stresses are present up to the critical thickness but after that the shift of transition from compressive to tensile stress takes place.
The reasons for the transition from compressive to tensile stress are as follows. According to Sasabayashi et al., 38 during the early stage of TiN growth, atomic peening effect is the influential factor for the compressive stresses. As the film goes to a certain point (critical thickness), the atomic peening effect diminishes and the compressive stresses transition into tensile stresses.
Chen et al. 39 have explained the atomic-level crystal structure–based details of evolution in grain size of the TiN coatings relating to the residual stress transition with the increase in thickness of the coatings. When the TiN coating thickness is relatively small, the size of grain is also small with (200) unpacked close plane orientation. As the grain size increases with the increase in the film thickness, the orientation becomes (111) close packed plane, having lowest surface energy. Therefore, there are less possibilities of the insertion of the atoms in the lower grain boundaries which results in the decrease in the compressive stress and steadily transfigures into the tensile stress after the critical thickness. 40
Recently, Xi et al. 41 have proved these phenomena experimentally for the TiN coatings. The findings of Xi et al. reinforced our results that as the coating thickness increases hardness and consequently H3/E2 ratio also increases up to the certain critical thickness (0.672 µm in our study) and then it starts to decline onward due to increase in the grain size along with the residual tensile stresses.
The COF w.r.t. coating thickness and substrate surface roughness
The plots of the COF versus time for all TiN-coated AISI 52100 steel disk samples (mentioned in Table 1) are presented in Figure 7. The COF trend shows random spikes throughout the test for the fine samples of ≈0.432 and ≈0.672 µm coating thickness. On the other hand, the corresponding rough sample of the same coating thickness demonstrates relatively higher steadiness and lower COF in comparison with the fine sample. Both the rough and the fine samples of ≈1.550 µm coating thickness exhibit relatively higher stability of COF trend. The stability of COF trend becomes significantly higher at the maximum coating thickness (≈2.830 µm), especially for the rough samples. The variations in COF of these low-temperature PVD-based TiN coatings on AISI 52100 steel substrates are strongly correlated with the previously discussed adhesion trends (Figure 5) rather than hardness. Therefore, the random spikes in COF trends are due to the flakes of the coatings, which are chipped off during the test and settled in the test track of the sample. This behavior is further supported by the fact that the high substrate surface roughness sample exhibits relatively more stable COF trends (Figure 7) due to the high adhesion (Figure 5). Besides stability of trend, the mean value of COF is also a noteworthy indicator of the tribological performance of the coatings.
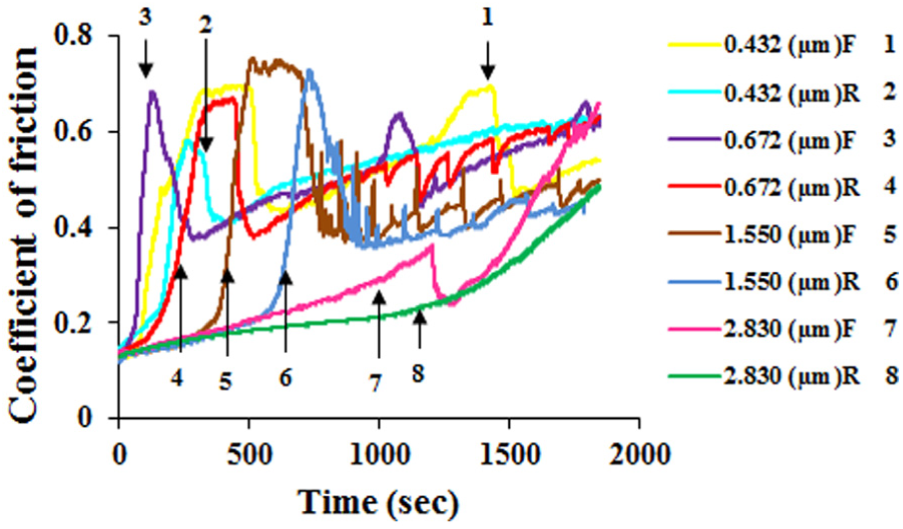
Graph showing the coefficient of friction with respect to their corresponding coating thickness and substrate surface roughness.
Figure 8 shows the mean COF of fine and rough samples against TiN coatings’ thickness. It can be seen that mean COF decreases with the increase in the coating thickness for both the fine and rough samples, but the overall mean COF values are lower for the rough samples in comparison with the fine samples. The decrease in the mean COF values appears to be inversely correlated with the increase in the adhesion of the TiN coatings. Furthermore, the TiN coating on the rough samples exhibits lesser mean COF (Figure 8) due to higher adhesion (Figure 5). In summary, TiN coatings in excess of ≈2.83 µm coating thickness on AISI 52100 substrates with roughness in the range of 0.2 ± 0.05 µm are expected to withstand the point contact shear load in a stable fashion and offer lowest mean COF. The values of mean COF of all samples are presented in Table 4.

Mean COF of fine and rough samples against TiN coatings’ thickness.
Summary of mean COF and wear rate of disk samples.
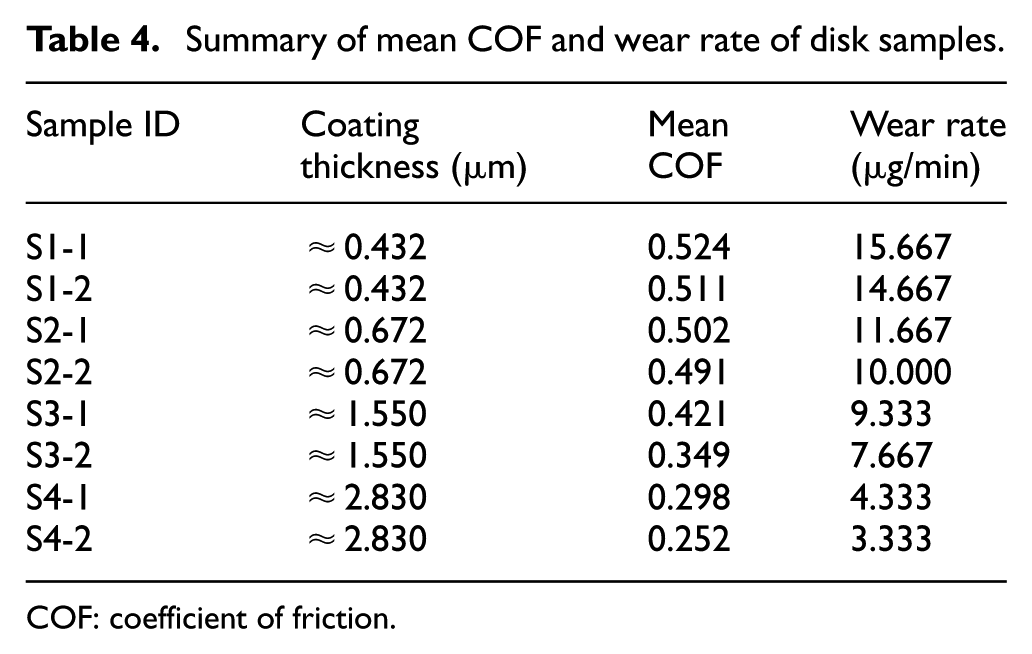
COF: coefficient of friction.
We have compared COF results with some other previous studies in order to endorse our findings. Tanno and Azushima 6 and Rodrıguez et al. 42 have reported the range of COF for TiN coatings from 0.2 to 0.7 (deposited at 600°C on tool steel) and 0.35 to 0.5 (deposited at 400°C–500°C on high-speed steel), respectively. Ali et al. 43 have measured the COF of TiN coatings on high-speed steel at low (150°C) and high (450°C) deposition temperature. He recorded 0.552 COF at 150°C and 0.610 COF at 450°C deposition temperature. We have demonstrated the values of the mean COF comparable and in some cases even lesser than the conventional high-deposition-temperature TiN PVD coatings.
Wear rate w.r.t. coating thickness and substrate surface roughness
Generally, it is considered that the higher H/E or H3/E2 ratio is a prime parameter for better wear resistance of the coatings.35,44 But, some researchers have given opposite verdicts regarding H/E and H3/E2 ratio. Mo et al. 45 and Fuentes et al. 46 have reported that the coatings with low H/E or H3/E2 ratio give relatively better wear resistance. Therefore, the coatings of high hardness and brittleness may fail earlier upon cyclic loading. Furthermore, recent results published by Ravi et al. 47 explained that the wear behavior of two sliding surfaces is a complex phenomenon and it can be better explained by investigating the progression of surface changes and corresponding wear debris instead of H/E or H3/E2 ratio only.
Figure 9 shows the wear rates of the fine and rough samples against TiN coating thickness. It is observed that as the coating thickness increases, wear of the samples decreases for both the fine and rough samples but the rough samples exhibit better wear resistance (lower wear rate) in comparison with the fine samples. The decrease in the wear is inversely correlated with the increase in the adhesion of the TiN coatings (Figure 5). Thus, the TiN coating on the rough samples exhibits lesser wear rate (Figure 9) due to the higher adhesion (Figure 5). This phenomenon of wear resistance dependence on the adhesion of the coating has been reported previously in the literature. 48 Hence, the samples which have higher adhesion of the coating present better wear resistance and tribological performance.

Wear rates of the fine and rough samples against TiN coating thickness.
In addition, Jiang et al. 49 have suggested that the higher substrate surface roughness increases the load-bearing capacity of the PVD coatings due to the development of compact layers from the wear debris formed between the asperities. These compact layers cause to build up an effective coating thickness which results in making the coatings more protected against the wear. Similarly, Ravi et al. 47 have mentioned that some wear debris, during the pin on disk test, were crushed and reattached again to the coating surface which caused reduction in the wear rate. The systematic reduction in randomness in COF (Figure 7) and wear rate (Figure 9) with increasing coating thickness, increasing substrate surface roughness, increasing adhesion (Figure 5) are reinforced by the findings of Ravi et al. and Jiang et al. In this study, low-temperature cathodic arc PVD-based TiN coatings of thicknesses in excess of ≈2.83 µm on AISI 52100 substrates with roughness in the range of 0.2 ± 0.05 µm are expected to be the most wear resistant. The detailed results of wear rate are given in Table 4.
Conclusion
In this study, TiN coating was deposited on AISI 52100 steel substrates by low-temperature cathodic arc PVD system. Adhesion, hardness, elastic modulus, and tribological properties of TiN coating were evaluated to investigate the impact of substrate surface roughness with varying coating thickness on these properties. The following conclusions had been drawn:
Adhesion of TiN coating was increased with the increase in coating thickness for both fine and rough samples. However, rough samples had showed superior adhesion as compared to fine samples. The adhesion results were compared with the conventional high-temperature TiN PVD coatings reported in literature and were found to be comparable.
The hardness of TiN coating was increased with the increase in coating thickness up to critical coating thickness (≈0.672 µm), but after that it declined with the increase in coating thickness. However, rough samples had demonstrated better hardness than the fine samples with similar trend.
COF and wear were predominately proved to be adhesion-dependent phenomenon. Samples with more substrate surface roughness and coatings thickness had shown lower COF and lower wear rate. Thus, TiN coatings of thicknesses in excess of ≈2.83 µm on AISI 52100 substrates with substrate surface roughness in the range of 0.2 ± 0.05 µm can be more wear resistant and can offer lowest COF too. Furthermore, the COF was compared with the conventional high-temperature TiN PVD coatings and was found to be comparable and in certain cases significantly lower.
Footnotes
Acknowledgements
The authors would like to thank Iftikhar Temper Company®, Sialkot, for providing the PVD coating facility and technical support for the accomplishment of this study.
Handling Editor: Noel Brunetiere
Declaration of conflicting interests
The author(s) declared no potential conflicts of interest with respect to the research, authorship, and/or publication of this article.
Funding
The author(s) received no financial support for the research, authorship, and/or publication of this article.